# 67.5% Boost in Write Performance, 50% Lower Storage Cost —— GreptimeDB v0.12 Log Performance Benchmark
Source: https://greptime.com/blogs/2025-03-10-log-benchmark-greptimedb
## Key Findings
- Compared to GreptimeDB v0.9, which initially introduced log-related functionalities, **v0.12 delivers substantial improvements in read/write performance and resource efficiency**, achieving up to **67.5% higher write throughput while reducing CPU usage to 40%**.
- In log ingestion scenarios, whether handling **structured or unstructured data**, GreptimeDB demonstrates exceptional write throughput, reaching **111% of ClickHouse’s performance and 470% of Elasticsearch’s**. Furthermore, when leveraging cost-efficient object storage, there is no significant performance degradation.
- For log queries, GreptimeDB remains competitive with ClickHouse and Elasticsearch, with each database excelling in different use cases. Thanks to multi-level caching optimizations, GreptimeDB sustains high query performance even when data is stored on object storage, achieving an optimal cost-to-performance balance.
- With its **columnar storage and advanced compression algorithms**, GreptimeDB offers the **best compression ratio among the three databases**, with persistent storage requirements at only **50% of ClickHouse’s and 12.7% of Elasticsearch’s**, effectively reducing long-term data retention costs.
## Benchmark Scenarios
### Test Data and Methodology
We used nginx access logs as the input data, with a typical log entry structured as follows:
```plaintext
129.37.245.88 - meln1ks [01/Aug/2024:14:22:47 +0800] "PATCH /observability/metrics/production HTTP/1.0" 501 33085
```
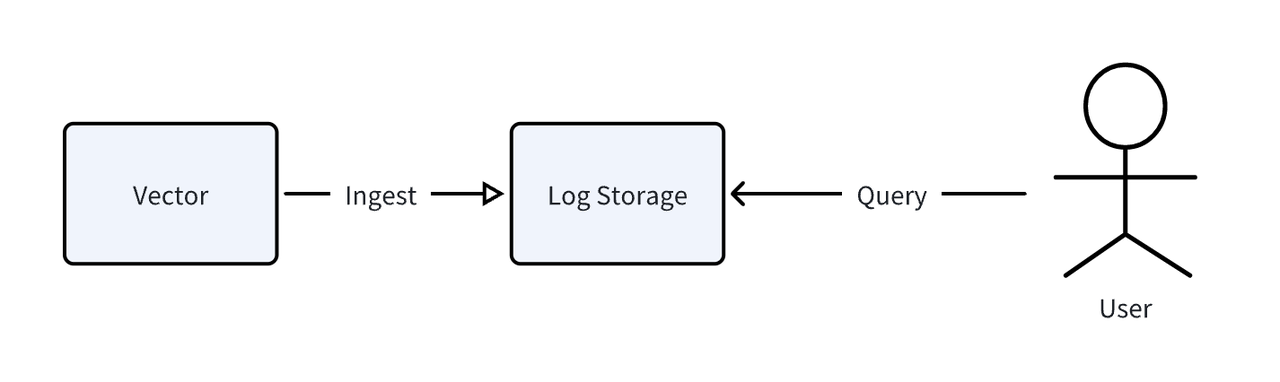
The log data was generated and ingested using Vector, an open-source observability pipeline. The overall benchmarking process is illustrated below:
Figure 1: Test flowchart
We tested two data models based on different storage and query needs:
- **Structured Data Model**: Logs were parsed into individual fields, with each field stored in separate columns. Queries targeted specific columns for filtering and retrieval.
- **Unstructured Data Model**: Except for the timestamp field, the entire log message was stored as a single text field with full-text indexing enabled. Keyword-based queries were used for searches.
## Hardware and Software Setup
### Hardware Platform
| Component | Configuration |
|-----------|--------------------------------------|
| **Server Model** | AWS c5d.2xlarge, 8 vCPU 16GiB Memory |
| **Operating System** | Ubuntu24.04 LTS |
### Software Versions
| **Database** | Version |
|-------------------|------------|
| **GreptimeDB** | v0.12 |
| **ClickHouse** | 24.9.1.219 |
| **Elasticsearch** | 8.15.0 |
> Note: Detailed database configurations are provided in the appendix.
## Read/Write Performance Benchmarking
### Write Throughput
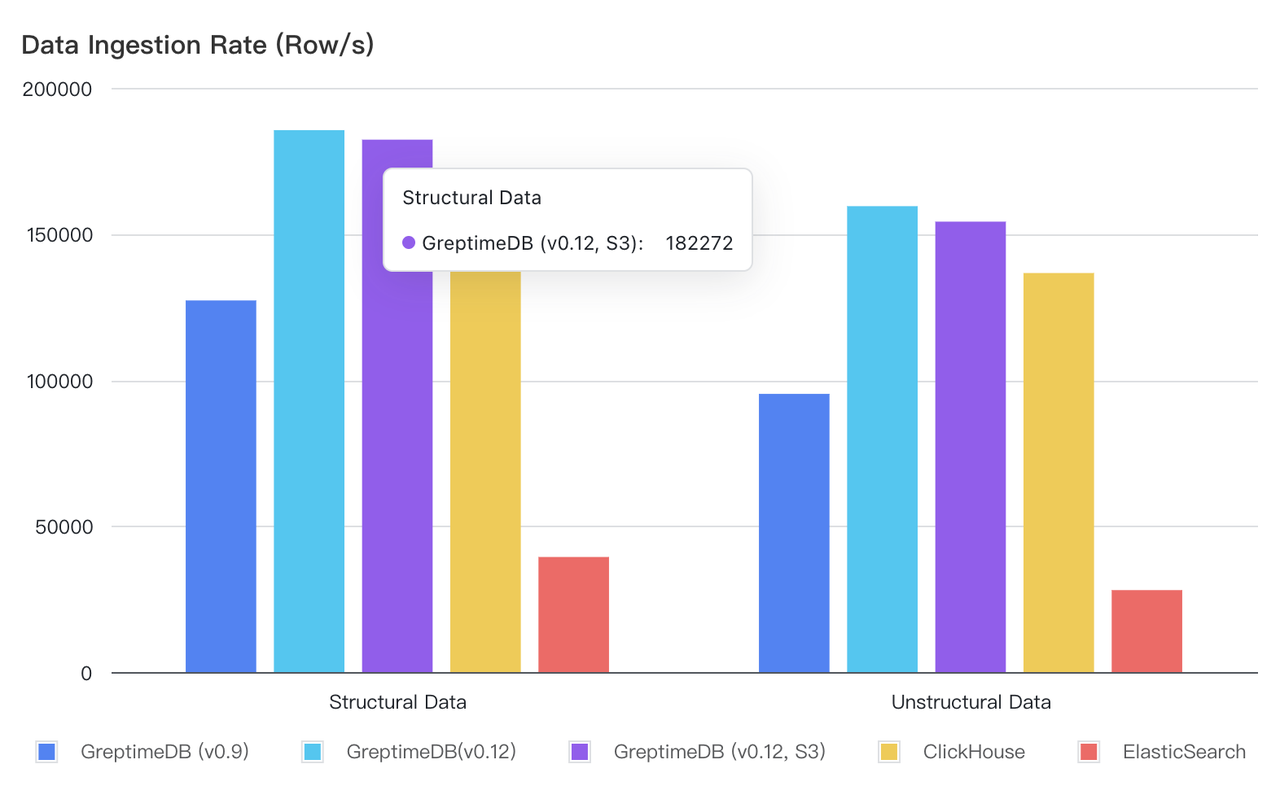
| **Database** | **Structured Model Avg. TPS** | **Unstructured Model Avg. TPS** |
|----------------------------|-------------|--------------|
| **GreptimeDB (v0.9)** | 127,226 | 95,238 |
| **GreptimeDB (v0.12)** | 185,535 | 159,502 |
| **GreptimeDB (v0.12, S3)** | 182,272 | 154,209 |
| **ClickHouse** | 166,667 | 136,612 |
| **Elasticsearch** | 39,401 | 28,058 |
Figure 2: Write/Throughput performance
**Observations:**
- GreptimeDB v0.12 significantly improves write performance, **achieving a 45.8% increase in structured data throughput and a 67.5% increase in unstructured data throughput compared to v0.9**.
- GreptimeDB outperforms ClickHouse in write throughput, while both significantly surpass Elasticsearch. **For structured logs, GreptimeDB achieves 4.7x Elasticsearch’s throughput, while for unstructured logs, it reaches 5.7x.**
- When using AWS **S3 for storage, GreptimeDB’s write throughput is reduced by only 1–2%**, making it a cost-efficient solution without compromising performance.
### Query Performance
Six different query types were evaluated to simulate real-world log analysis use cases:
1. **Count Query**: Count total rows in the dataset.
2. **Keyword Matching**: Filter logs based on user, method, endpoint, version, and status code.
3. **Time Range Query**: Retrieve approximately half of the dataset (~50 million rows) within a time range.
4. **Mid-Time Range Query**: Retrieve 1,000 rows within a middle-time window.
5. **Recent-Time Range Query**: Retrieve 1,000 rows within the most recent minute.
6. **Keyword Matching + Time Range Query**: Filter logs within a specific time range using keyword matching.
> Note:
> - Both GreptimeDB and ClickHouse use SQL for queries. GreptimeDB supports MySQL client tools, whereas ClickHouse provides its own command-line client: [ClickHouse CLI](https://clickhouse.com/docs/interfaces/cli).
> - For Elasticsearch, we used the search REST API:
[Elasticsearch Search API](https://www.elastic.co/guide/en/Elasticsearch/reference/current/search-search.html).
#### Structured Data Queries
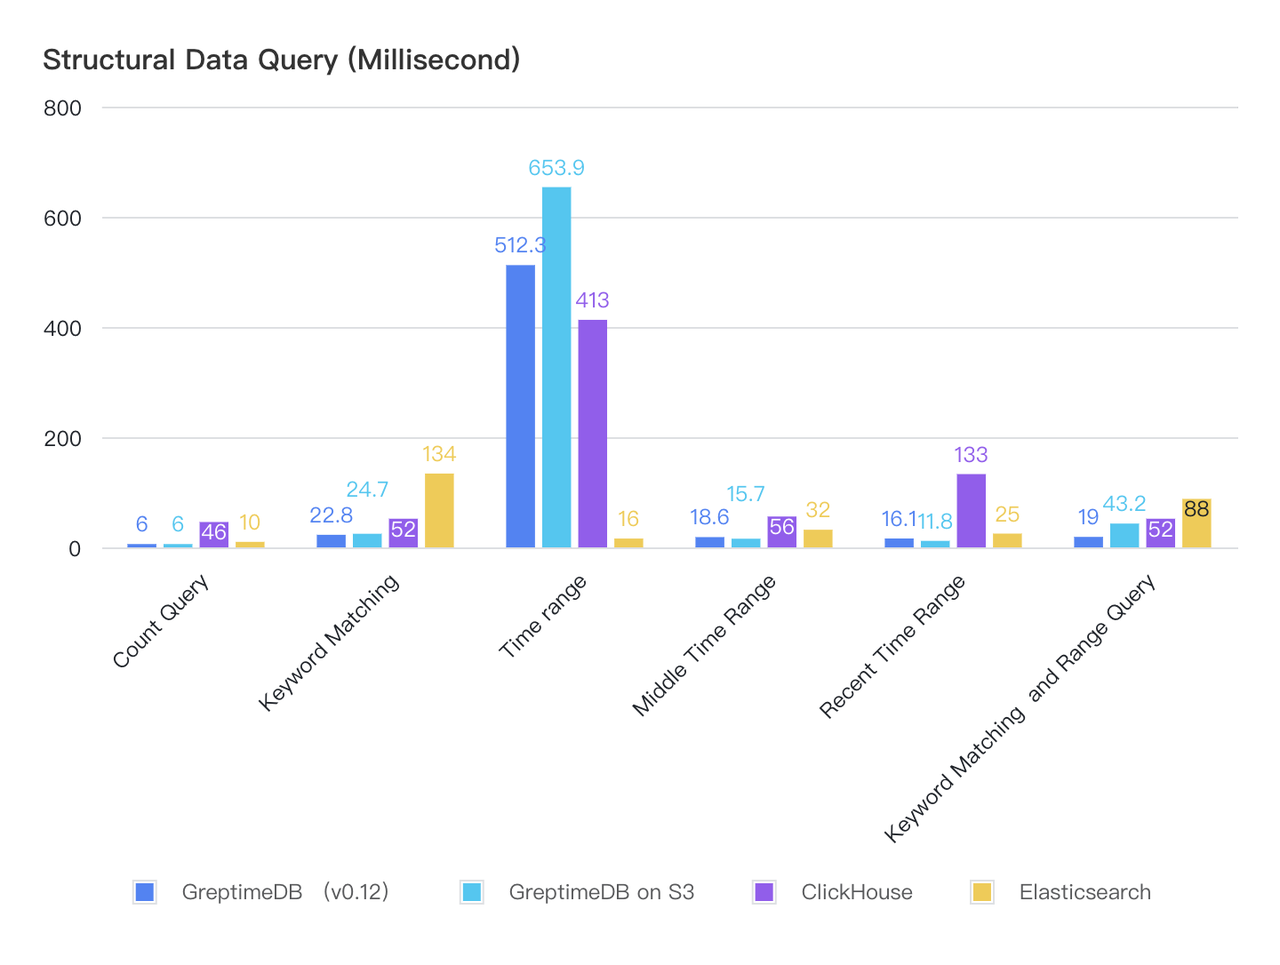
| **Query Type (ms)** | **GreptimeDB** | **GreptimeDB on S3** | **ClickHouse** | **Elasticsearch** |
|----------------------------------|----------------|----------------------|----------------|-------------------|
| **Count Query** | 6 | 6 | 46 | 10 |
| **Keyword Matching** | 22.8 | 24.7 | 52 | 134 |
| **Time range** | 512.3 | 653.9 | 413 | 16 |
| **Middle Time Range** | 18.6 | 15.7 | 56 | 32 |
| **Recent Time Range** | 16.1 | 11.8 | 133 | 25 |
| **Keyword Matching+Range Query** | 19 | 43.2 | 52 | 88 |
Figure 3: Structured data query time consumption
**Findings:**
- GreptimeDB and ClickHouse exhibit comparable query performance for structured data.
- **For large time-range scans, GreptimeDB and ClickHouse experience noticeable latency increases but complete queries within a few hundred milliseconds.**
- Thanks to multi-level caching, GreptimeDB maintains stable performance even when data is stored on S3.
#### Unstructured Data
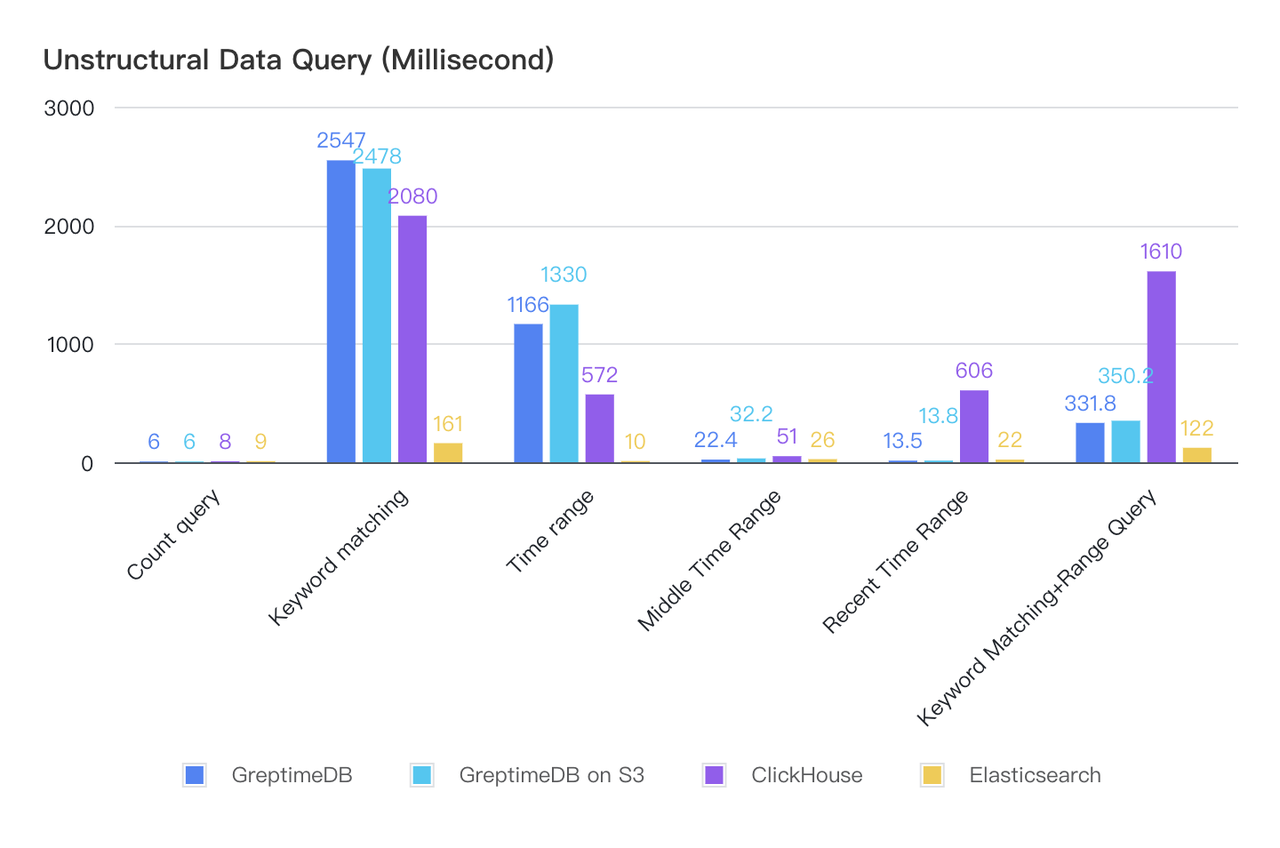
| **Query Type & Execution Time (ms)** | **GreptimeDB** | **GreptimeDB on S3** | **ClickHouse** | **Elasticsearch** |
|---------------------------------------|----------------|----------------------|----------------|-------------------|
| **Count query** | 6 | 6 | 8 | 9 |
| **Keyword matching** | 2547 | 2478 | 2080 | 161 |
| **Time range** | 1166 | 1330 | 572 | 10 |
| **Middle Time Range** | 22.4 | 32.2 | 51 | 26 |
| **Recent Time Range** | 13.5 | 13.8 | 606 | 22 |
| **Keyworld Matching and Range Query** | 331.8 | 350.2 | 1610 | 122 |
Figure 4: Unstructured data query time consumption
- **GreptimeDB v0.12 has improved performance in most unstructured data queries compared to v0.9.**
- Both GreptimeDB and ClickHouse experience **performance degradation in unstructured data queries**, falling behind Elasticsearch.
## Resource Utilization and Compression Rate
### Resource Utilization
With a **write rate limited to 20,000 rows per second**, we compared CPU and memory usage for GreptimeDB, ClickHouse, and Elasticsearch:
| **Database** | **Structured Model** | **Structured Model** | **Unstructured Model** | **Unstructured Model** |
|------------------|-------------|---------|-------------|---------|
| **Parameter** | **CPU (%)** | **Memory (MB)** | **CPU (%)** | **Memory (MB)** |
| **GreptimeDB (v0.9)** | 33.24 | 337 | 16.79 | 462 |
| **GreptimeDB (v0.12)** | 13.2 | 408 | 10.29 | 624 |
| **ClickHouse** | 9.56 | 611 | 26.77 | 732 |
| **Elasticsearch** | 40.22 | 9883 | 47.54 | 9320 |
- ClickHouse has the lowest CPU usage, while GreptimeDB is slightly higher but **shows significant improvements over v0.9** (from 33.24% to 13.2% in structured data and from 16.79% to 10.29% in unstructured data).
- **GreptimeDB consumes the least memory**, whereas Elasticsearch’s memory usage is an order of magnitude higher than both GreptimeDB and ClickHouse.
- Both GreptimeDB and ClickHouse employ **LSM Tree-like structures**, resulting in significant memory fluctuations.
### Compression Rate
We tested data compression by writing approximately **10GB of raw data** and measuring the persistent storage size across different databases:
| **Database** | **Structured Model** | **Structured Model** | **Unstructured Model** | **Unstructured Model** |
|-----------------------------|---------------|---------|---------------|---------|
| **Parameter** | **Data Size (GB)** | **Compression Ratio** | **Data Size (GB)** | **Compression Ratio** |
| **GreptimeDB** | 1.3 | 13% | 3.3 | 33% |
| **ClickHouse (Before Compression)** | 7.6 | 26% | 15.5 | 51% |
| **ClickHouse (After Compression)** | 2.6 | 26% | 5.1 | 51% |
| **Elasticsearch (Before Compression)** | 14.6 | 102% | 19 | 172% |
| **Elasticsearch (After Compression)** | 10.2 | 102% | 17.2 | 172% |
Key takeaways:
- **GreptimeDB v0.12 maintains a strong compression advantage**, storing structured data at just **13% of the original size** and **unstructured data at 33%**.
- Structured data models **leverage columnar encoding and adaptive compression strategies**, achieving significantly better compression than unstructured models.
> Note: ClickHouse and Elasticsearch continuously compress data in the background. The table above records both pre- and post-compression storage sizes.
## Conclusions
GreptimeDB v0.12 brings significant improvements in both write and query performance, making it an efficient and cost-effective choice for log processing. With superior write throughput, robust storage efficiency, and competitive query performance, GreptimeDB stands as a compelling alternative to ClickHouse and Elasticsearch in observability and logging use cases.
---
## Appendix
### Software Configuration
- **GreptimeDB (Local Storage)**: Default settings were used.
- **GreptimeDB (S3 Storage)**: Configured as follows
```toml
[storage]
type = "S3"
bucket = ""
root = "log_benchmark"
access_key_id = ""
secret_access_key = ""
endpoint = ""
region = ""
cache_path = ""
cache_capacity = "20G"
[[region_engine]]
[region_engine.mito]
enable_experimental_write_cache = true
experimental_write_cache_size = "20G"
```
### Vector Log Parsing Configuration
```toml
[transforms.parse_logs]
type = "remap"
inputs = ["demo_logs"]
source = '''
. = parse_regex!(.message, r'^(?P\S+) - (?P\S+) \[(?P[^\]]+)\] "(?P\S+) (?P\S+) (?P\S+)" (?P\d+) (?P\d+)$')
# Convert timestamp to a standard format
.timestamp = parse_timestamp!(.timestamp, format: "%d/%b/%Y:%H:%M:%S %z")
# Convert status and bytes to integers
.status = to_int!(.status)
.bytes = to_int!(.bytes)
'''
```
### Table Schema
#### Structured Data Model:
##### GreptimeDB
```sql
-- Enables append mode and sets `user`, `path`, and `status` as tags (i.e., primary keys)
CREATE TABLE IF NOT EXISTS `test_table` (
`bytes` Int64 NULL,
`http_version` STRING NULL,
`ip` STRING NULL,
`method` STRING NULL,
`path` STRING NULL,
`status` SMALLINT UNSIGNED NULL,
`user` STRING NULL,
`timestamp` TIMESTAMP(3) NOT NULL,
PRIMARY KEY (`user`, `path`, `status`),
TIME INDEX (`timestamp`)
)
ENGINE=mito
WITH(
append_mode = 'true'
);
```
##### ClickHouse
```sql
--Use the default MergeTree engine, defining the same sorting key.
CREATE TABLE IF NOT EXISTS test_table
(
bytes UInt64 NOT NULL,
http_version String NOT NULL,
ip String NOT NULL,
method String NOT NULL,
path String NOT NULL,
status UInt8 NOT NULL,
user String NOT NULL,
timestamp String NOT NULL,
)
ENGINE = MergeTree()
ORDER BY (user, path, status);
```
##### Elasticsearch
```json
{
"vector-2024.08.19": {
"mappings": {
"properties": {
"bytes": {
"type": "long"
},
"http_version": {
"type": "text",
"fields": {
"keyword": {
"type": "keyword",
"ignore_above": 256
}
}
},
"ip": {
"type": "text",
"fields": {
"keyword": {
"type": "keyword",
"ignore_above": 256
}
}
},
"method": {
"type": "text",
"fields": {
"keyword": {
"type": "keyword",
"ignore_above": 256
}
}
},
"path": {
"type": "text",
"fields": {
"keyword": {
"type": "keyword",
"ignore_above": 256
}
}
},
"status": {
"type": "long"
},
"timestamp": {
"type": "date"
},
"user": {
"type": "text",
"fields": {
"keyword": {
"type": "keyword",
"ignore_above": 256
}
}
}
}
}
}
}
```
#### Unstructured Data Model
##### GreptimeDB
```sql
--message column enables the FULLTEXT option, which turns on full-text indexing.
CREATE TABLE IF NOT EXISTS `test_table` (
`message` STRING NULL FULLTEXT WITH(analyzer = 'English', case_sensitive = 'false'),
`timestamp` TIMESTAMP(3) NOT NULL,
TIME INDEX (`timestamp`)
)
ENGINE=mito
WITH(
append_mode = 'true'
);
```
##### ClickHouse
```sql
SET allow_experimental_full_text_index = true;
CREATE TABLE IF NOT EXISTS test_table
(
message String,
timestamp String,
INDEX inv_idx(message) TYPE full_text(0) GRANULARITY 1
)
ENGINE = MergeTree()
ORDER BY tuple();
```
##### Elasticsearch
```json
{
"vector-2024.08.19": {
"mappings": {
"properties": {
"message": {
"type": "text",
"fields": {
"keyword": {
"type": "keyword",
"ignore_above": 256
}
}
},
"service": {
"type": "text",
"fields": {
"keyword": {
"type": "keyword",
"ignore_above": 256
}
}
},
"source_type": {
"type": "text",
"fields": {
"keyword": {
"type": "keyword",
"ignore_above": 256
}
}
},
"timestamp": {
"type": "date"
}
}
}
}
}
```
---
#### About Greptime
Greptime offers industry-leading time series database products and solutions to empower IoT and Observability scenarios, enabling enterprises to uncover valuable insights from their data with less time, complexity, and cost.
[GreptimeDB](https://github.com/GreptimeTeam/greptimedb) is an open-source, high-performance time-series database offering unified storage and analysis for metrics, logs, and events. Try it out instantly with [GreptimeCloud](https://www.greptime.com/product/cloud), a fully-managed DBaaS solution—no deployment needed!
The [Edge-Cloud Integrated Solution](https://greptime.com/product/carcloud) combines multimodal edge databases with cloud-based GreptimeDB to optimize IoT edge scenarios, cutting costs while boosting data performance.
Star us on [GitHub](https://github.com/GreptimeTeam/greptimedb) or join GreptimeDB Community on [Slack](https://www.greptime.com/slack) to get connected.