# Migrating from InfluxDB to GreptimeDB: A Practical Guide
Source: https://greptime.com/blogs/2026-06-02-influxdb-to-greptimedb-migration-guide
How do you switch an application from InfluxDB to GreptimeDB? This article walks through the full path.
If you're still weighing the switch on performance grounds, the [GreptimeDB vs. InfluxDB benchmark report](/blogs/2024-08-07-performance-benchmark) compares write and query throughput on the TSBS CPU workload.
The first thing InfluxDB users notice when migrating to GreptimeDB is protocol compatibility: GreptimeDB supports the InfluxDB line protocol, so many write paths only need a new URL, credentials, and database name. What actually determines migration quality, though, usually comes later: importing historical data smoothly, and rewriting existing InfluxQL queries as GreptimeDB SQL.
This guide breaks the migration into four stages. Stage 1 uses the [TSBS](https://github.com/timescale/tsbs) IoT use case to build a dataset that resembles a real connected-vehicle workload, purely to make the later stages reproducible. If you already have your own InfluxDB data and queries, skip Stage 1 and start from the write migration or the historical data migration.
1. Prepare demo data (optional): write the TSBS IoT dataset into InfluxDB.
2. Migrate write requests: switch live writes from InfluxDB to GreptimeDB.
3. Migrate historical data: import existing line protocol data from InfluxDB into GreptimeDB.
4. Migrate InfluxQL: rewrite the TSBS IoT queries as GreptimeDB SQL, using GreptimeDB's range query where it fits.
The official documentation also has a more general [InfluxDB migration guide](https://docs.greptime.com/user-guide/migrate-to-greptimedb/migrate-from-influxdb/) and a [range query reference](https://docs.greptime.com/reference/sql/range/). This article puts those capabilities to work in one end-to-end migration scenario.
## Check the data model before you migrate
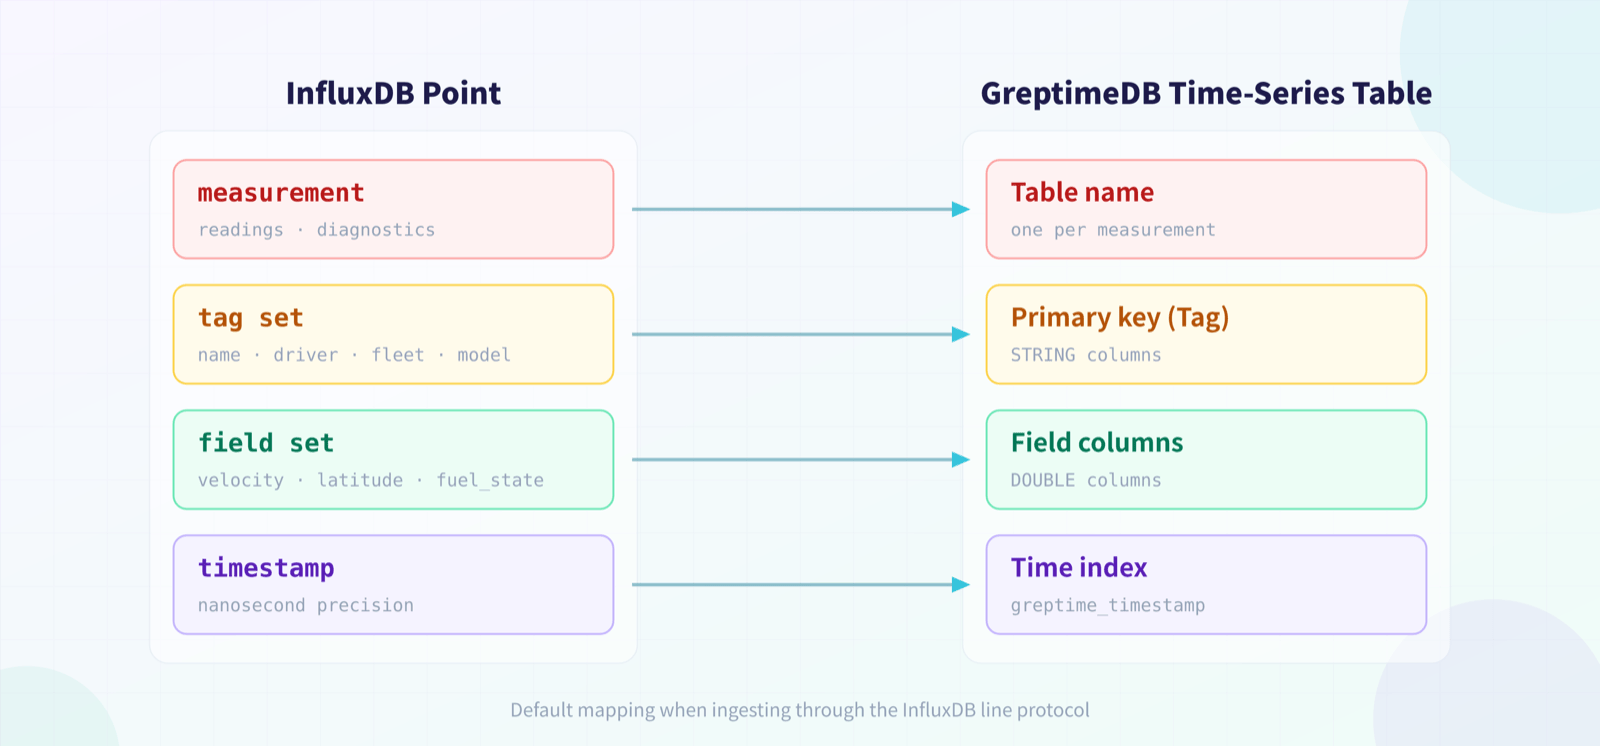
An InfluxDB point consists of a measurement, a tag set, a field set, and a timestamp. When you write it to GreptimeDB through the InfluxDB line protocol, GreptimeDB maps it onto a time-series table:
- The measurement becomes the table name, such as `readings` or `diagnostics`.
- Tags become primary key columns, such as `name`, `driver`, `fleet`, and `model` in TSBS IoT.
- Fields become regular field columns, such as `latitude`, `longitude`, `velocity`, `fuel_state`, and `current_load`.
- The timestamp becomes `greptime_timestamp`, a `TimestampNanosecond` column that is also the time index.
Default mapping from an InfluxDB point to a GreptimeDB time-series table
This means query migration doesn't have to treat measurements, tags, and fields as special concepts; they are already ordinary SQL tables and columns. After migrating, start by running:
```sql
DESC TABLE readings;
DESC TABLE diagnostics;
SHOW CREATE TABLE readings;
SHOW CREATE TABLE diagnostics;
```
If you created tables manually before migrating, you can name the time column `ts` or anything else. The SQL in the rest of this article assumes the default time column `greptime_timestamp` created automatically by line protocol ingestion.
## 1. Prepare demo data (optional)
This stage only exists to give the write migration, historical data migration, and query rewrites a reproducible dataset. If you already have an InfluxDB instance, line protocol data, or real production queries, skip to Stage 2.
Start a local InfluxDB 1.8 instance. This article uses the InfluxDB 1.x database model, which makes it easy to demonstrate the migration with TSBS-generated InfluxDB line protocol data and InfluxQL queries.
```shell
docker run --rm --name influxdb-1-8 \
-p 8086:8086 \
influxdb:1.8
```
Install TSBS. The TSBS repository ships several commands; this article needs `tsbs_generate_data` to generate data, and you can also use `tsbs_generate_queries` to generate sample InfluxQL queries.
```shell
git clone https://github.com/timescale/tsbs.git
cd tsbs
make
```
Generate InfluxDB line protocol data for the IoT use case. The scale below works for a local demo; for production load testing, increase `--scale` and widen the time range.
```shell
./bin/tsbs_generate_data \
--use-case="iot" \
--seed=123 \
--scale=100 \
--timestamp-start="2026-01-01T00:00:00Z" \
--timestamp-end="2026-01-02T00:00:00Z" \
--log-interval="10s" \
--format="influx" \
| gzip > tsbs-iot-influx.gz
```
Create the InfluxDB database and write the data. TSBS outputs line protocol, which goes straight into InfluxDB's `/write` API. To keep individual requests small, split the file by lines first.
```shell
curl -sS -XPOST "http://localhost:8086/query" \
--data-urlencode "q=CREATE DATABASE benchmark"
mkdir -p tsbs-iot-parts
gunzip -c tsbs-iot-influx.gz \
| split -l 5000 - ./tsbs-iot-parts/data.
for file in ./tsbs-iot-parts/data.*; do
curl -sS -XPOST "http://localhost:8086/write?db=benchmark&precision=ns" \
--data-binary @"${file}"
done
```
A quick check:
```shell
curl -G "http://localhost:8086/query" \
--data-urlencode "db=benchmark" \
--data-urlencode "q=SHOW MEASUREMENTS"
curl -G "http://localhost:8086/query" \
--data-urlencode "db=benchmark" \
--data-urlencode "q=SELECT count(*) FROM readings"
```
TSBS IoT typically generates two core measurements:
- `readings`: operational readings such as vehicle position, velocity, and fuel consumption.
- `diagnostics`: diagnostic data such as vehicle status, fuel state, and current load.
## 2. Migrate write requests
The core of the live write migration is pointing the InfluxDB write endpoint at GreptimeDB. GreptimeDB supports both the InfluxDB line protocol v1 and v2 write APIs.
First, start GreptimeDB. The command below runs a standalone GreptimeDB in Docker for this walkthrough:
```shell
docker run -p 0.0.0.0:4000-4003:4000-4003 \
-v "$(pwd)/greptimedb_data:/greptimedb_data" \
--name greptime --rm \
greptime/greptimedb:v1.0.2 standalone start \
--http-addr 0.0.0.0:4000 \
--rpc-bind-addr 0.0.0.0:4001 \
--mysql-addr 0.0.0.0:4002 \
--postgres-addr 0.0.0.0:4003
```
> For other installation options, see the official documentation: https://docs.greptime.com/getting-started/installation/overview/
If your application uses the InfluxDB v1 write API:
```shell
curl -XPOST "http://127.0.0.1:4000/v1/influxdb/write?db=public&precision=ns" \
--data-binary \
'readings,name=truck_0,fleet=South,driver=driver_0 latitude=37.7749,longitude=-122.4194,velocity=42.0 1451606400000000000'
```
If your application uses the InfluxDB v2 write API:
```shell
curl -XPOST "http://127.0.0.1:4000/v1/influxdb/api/v2/write?db=public&precision=ns" \
--data-binary \
'readings,name=truck_0,fleet=South,driver=driver_0 latitude=37.7749,longitude=-122.4194,velocity=42.0 1451606400000000000'
```
Two details are worth confirming up front.
First, `db` maps to the GreptimeDB database name. An InfluxDB v2 bucket is also carried through the `db` parameter here; if you use an official InfluxDB client, set the bucket to the GreptimeDB database name and leave the organization empty. Note that GreptimeDB does not create databases automatically: if the `db` parameter is anything other than the pre-created `public` database, create the target database first with a `CREATE DATABASE` statement.
Second, `precision` must match the precision of the original timestamps. GreptimeDB's InfluxDB line protocol API interprets timestamps as nanoseconds by default; if the original requests write milliseconds, microseconds, or seconds, pass `precision=ms`, `precision=us`, or `precision=s` explicitly.
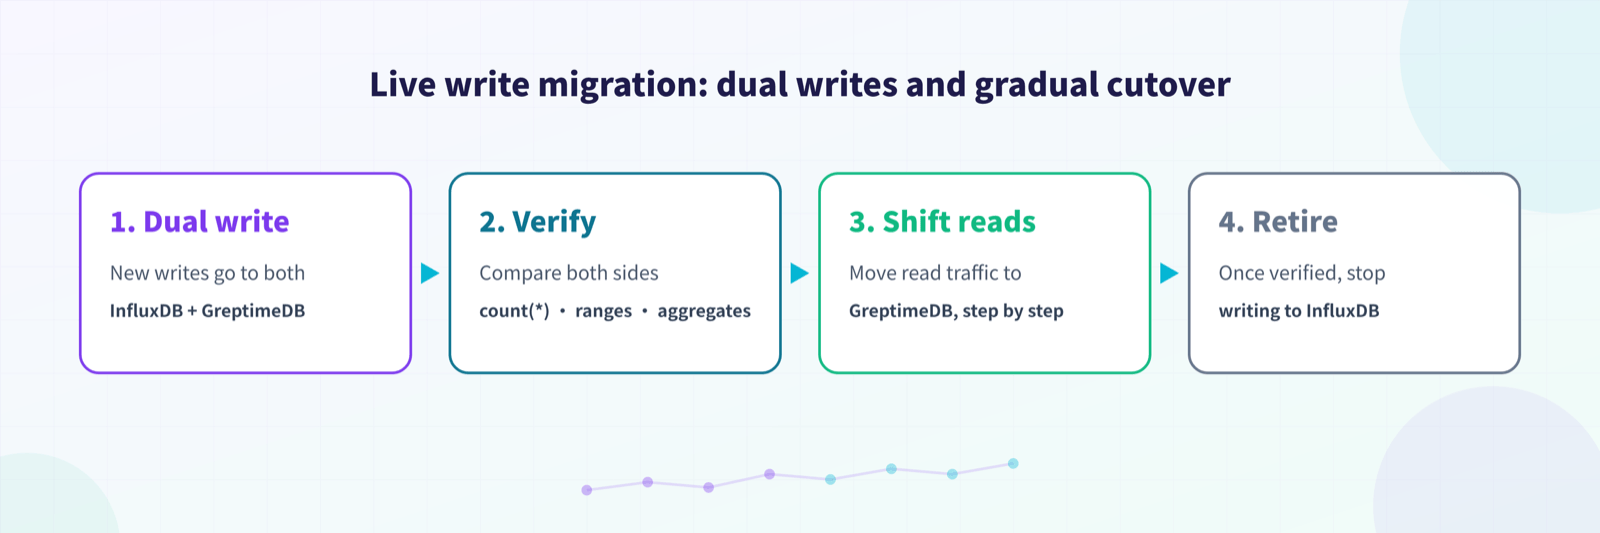
For a live migration, use dual writes or a gradual cutover: send new writes to both InfluxDB and GreptimeDB, compare `count(*)`, time ranges, and key aggregation results, then shift read traffic to GreptimeDB step by step. Once everything checks out, stop writing to InfluxDB.
Live write migration: dual writes and gradual cutover
## 3. Migrate historical data
The most direct route for historical data is to keep using the InfluxDB line protocol. Nothing fancy here: as long as you can export the history as line protocol, you can import it through GreptimeDB's InfluxDB write API.
In this TSBS walkthrough, `tsbs-iot-influx.gz` is itself the historical data file. Importing it into GreptimeDB reuses the shell pattern from the official migration documentation:
```shell
export GREPTIME_HOST="localhost"
export GREPTIME_DB="public"
for file in ./tsbs-iot-parts/data.*; do
curl -i --retry 3 \
-X POST "http://${GREPTIME_HOST}:4000/v1/influxdb/write?db=${GREPTIME_DB}&precision=ns" \
--data-binary @"${file}"
sleep 1
done
```
If your historical data comes from a real InfluxDB instance rather than a TSBS-generated file, a few guidelines apply:
- For small datasets, re-export the data as line protocol from the application side or with a script, then import it through the GreptimeDB write API.
- For large datasets, export in batches by measurement and time range, keep individual batch files small, and record checkpoints so you can resume.
- For measurements with high-cardinality tags, confirm before importing that the primary key columns of the GreptimeDB table match your expectations; automatic table creation maps line protocol tags to primary key columns.
- After importing, verify at least the row count, time range, non-null field counts, and key aggregation queries for each measurement.
Common verification SQL:
```sql
SELECT
count(*) AS row_count,
min(greptime_timestamp) AS min_ts,
max(greptime_timestamp) AS max_ts
FROM readings;
SELECT
count(*) AS row_count,
min(greptime_timestamp) AS min_ts,
max(greptime_timestamp) AS max_ts
FROM diagnostics;
SELECT fleet, count(*) AS row_count
FROM readings
GROUP BY fleet
ORDER BY row_count DESC;
```
## 4. Migrate InfluxQL to GreptimeDB SQL
The TSBS InfluxDB IoT queries cover two kinds of workloads:
- Real-time status queries: things like the last location of a set of vehicles, low fuel, high load, or unusually long driving sessions.
- Analytical queries: aggregations by fleet, model, driver, day, or 10-minute window.
Before rewriting InfluxQL, map its concepts to their GreptimeDB SQL counterparts:
- An InfluxQL measurement corresponds to a GreptimeDB table name, such as `readings` or `diagnostics`.
- InfluxQL tags and fields are both columns in GreptimeDB; tags are usually also primary key columns.
- InfluxQL's `time` corresponds to `greptime_timestamp` in tables created automatically by line protocol ingestion.
- InfluxQL's `GROUP BY time(10m), "name", "driver"` becomes a GreptimeDB range query: `avg(value) RANGE '10m' ... ALIGN '10m' BY (name, driver)`.
- For plain discrete bucketing, `date_bin('10 minutes'::INTERVAL, greptime_timestamp)` followed by `GROUP BY` also works.
- For selector queries like `ORDER BY time DESC LIMIT 1`, rewrite with `row_number() OVER (...)` to express "the latest point per group" explicitly.
- For state-change queries like `difference()` and `elapsed()`, rewriting with `lag()`, `lead()`, and CTEs is usually more readable.
The examples below migrate TSBS IoT InfluxQL queries to GreptimeDB SQL. They assume the TSBS data was written to GreptimeDB through line protocol, so the time column is `greptime_timestamp`.
> AI tools handle most of this rewriting well. A simple prompt:
>
> "I'm migrating from InfluxDB to GreptimeDB. Rewrite the following InfluxQL as SQL that GreptimeDB supports:
>
> \
>
> Refer to at least these documents:
>
> 1. GreptimeDB's InfluxDB data model: https://docs.greptime.com/user-guide/ingest-data/for-iot/influxdb-line-protocol/#data-model
>
> 2. GreptimeDB's Range Query, optimized for time-series workloads: https://docs.greptime.com/reference/sql/range/
>
> 3. GreptimeDB's SQL reference: https://docs.greptime.com/reference/sql/overview/"
There is now a purpose-built skill for this: InfluxQL in, GreptimeDB SQL out. It maps time windows, fill modes, percentiles, regex literals, and Grafana macros. Anything that can't translate exactly gets flagged, never faked. Install it into your AI coding agent with:
```shell
npx skills add https://github.com/GreptimeTeam/docs/tree/main/skills/influxql-to-greptimedb-sql
```
### 4.1 Vehicles with low average velocity in a 10-minute window
TSBS InfluxQL:
```sql
SELECT "name", "driver"
FROM (
SELECT mean("velocity") AS mean_velocity
FROM "readings"
WHERE time > '2026-01-01T00:00:00Z' AND time <= '2026-01-01T00:10:00Z'
GROUP BY time(10m), "name", "driver", "fleet"
LIMIT 1
)
WHERE "fleet" = 'South' AND "mean_velocity" < 1
GROUP BY "name";
```
The core of this query is "aggregate velocity per vehicle over 10-minute windows." A GreptimeDB range query expresses those window semantics directly:
```sql
WITH velocity_by_window AS (
SELECT
greptime_timestamp,
name,
driver,
avg(velocity) RANGE '10m' AS mean_velocity
FROM readings
WHERE greptime_timestamp > '2026-01-01T00:00:00Z'::TIMESTAMP
AND greptime_timestamp <= '2026-01-01T00:10:00Z'::TIMESTAMP
AND fleet = 'South'
ALIGN '10m' BY (name, driver)
)
SELECT name, driver, greptime_timestamp, mean_velocity
FROM velocity_by_window
WHERE mean_velocity < 1;
```
Here `RANGE '10m'` means each aggregation window covers 10 minutes of data, `ALIGN '10m'` emits one aligned window result every 10 minutes, and `BY (name, driver)` corresponds to the tag grouping in InfluxQL.
### 4.2 Vehicles with long driving sessions within 4 hours
The TSBS long-driving query first computes average velocity over 10-minute windows, then counts the windows where the average exceeds 1. The InfluxQL structure looks roughly like this:
```sql
SELECT "name", "driver"
FROM (
SELECT count(*) AS ten_min
FROM (
SELECT mean("velocity") AS mean_velocity
FROM readings
WHERE "fleet" = 'South'
AND time > '2026-01-01T00:00:00Z'
AND time <= '2026-01-01T04:00:00Z'
GROUP BY time(10m), "name", "driver"
)
WHERE "mean_velocity" > 1
GROUP BY "name", "driver"
)
WHERE ten_min > 22;
```
In GreptimeDB SQL, put the "10-minute driving window" in a CTE and aggregate again on top of it:
```sql
WITH driving_windows AS (
SELECT
greptime_timestamp,
name,
driver,
avg(velocity) RANGE '10m' AS mean_velocity
FROM readings
WHERE fleet = 'South'
AND greptime_timestamp > '2026-01-01T00:00:00Z'::TIMESTAMP
AND greptime_timestamp <= '2026-01-01T04:00:00Z'::TIMESTAMP
ALIGN '10m' BY (name, driver)
)
SELECT
name,
driver,
count(*) AS driving_10m_windows
FROM driving_windows
WHERE mean_velocity > 1
GROUP BY name, driver
HAVING count(*) > 22;
```
The threshold `22` comes from the TSBS calculation: within the 4-hour span, each hour allows a 5-minute break, and converting the remaining driving time into 10-minute windows gives 22. The 24-hour version follows the same rewrite; just widen the time range to 24 hours and adjust the threshold to the corresponding window count.
### 4.3 Average daily driving duration
The TSBS daily driving duration query also starts with 10-minute window aggregation, then counts windows per day and divides by 6 to convert 10-minute windows into hours. The InfluxQL structure can be summarized as:
```sql
SELECT count("mv") / 6 AS "hours driven"
FROM (
SELECT mean("velocity") AS "mv"
FROM "readings"
WHERE time > '2026-01-01T00:00:00Z'
AND time < '2026-01-02T00:00:00Z'
GROUP BY time(10m), "fleet", "name", "driver"
)
WHERE time > '2026-01-01T00:00:00Z'
AND time < '2026-01-02T00:00:00Z'
GROUP BY time(1d), "fleet", "name", "driver";
```
GreptimeDB SQL:
```sql
WITH ten_minute_windows AS (
SELECT
greptime_timestamp,
fleet,
name,
driver,
avg(velocity) RANGE '10m' AS mean_velocity
FROM readings
WHERE greptime_timestamp > '2026-01-01T00:00:00Z'::TIMESTAMP
AND greptime_timestamp < '2026-01-02T00:00:00Z'::TIMESTAMP
ALIGN '10m' BY (fleet, name, driver)
),
daily_sessions AS (
SELECT
fleet,
name,
driver,
date_bin('1 day'::INTERVAL, greptime_timestamp) AS day,
count(*) / 6.0 AS hours_driven
FROM ten_minute_windows
WHERE mean_velocity > 1
GROUP BY fleet, name, driver, day
)
SELECT
fleet,
name,
driver,
avg(hours_driven) AS avg_daily_hours
FROM daily_sessions
GROUP BY fleet, name, driver
ORDER BY fleet, name, driver;
```
This query shows a common migration pattern: the first layer is a range query that shapes raw points into 10-minute windows, and the second layer is plain SQL that rolls them up by day. For multi-stage aggregations like this, CTEs are easier to maintain than InfluxQL's nested subqueries.
## Summary
A migration from InfluxDB to GreptimeDB splits into two tracks that can run in parallel:
- Writes and historical data take the InfluxDB line protocol compatibility path, getting data into GreptimeDB reliably first.
- Queries move from InfluxQL to SQL: measurements, tags, and fields become tables and columns, and `GROUP BY time(...)` becomes `date_bin(...)` or a GreptimeDB range query.
For typical time-series analytical workloads like TSBS IoT, GreptimeDB's SQL is often more direct than InfluxQL: window functions for latest points, `lag()`/`lead()` for state changes, `date_bin()` for fixed-window bucketing, and `RANGE ... ALIGN ... BY ... FILL ...` when you need step-aligned windows with gap filling. Don't migrate by syntax substitution alone; recover the business semantics first, then pick the clearest, most maintainable SQL that GreptimeDB offers.