On this page
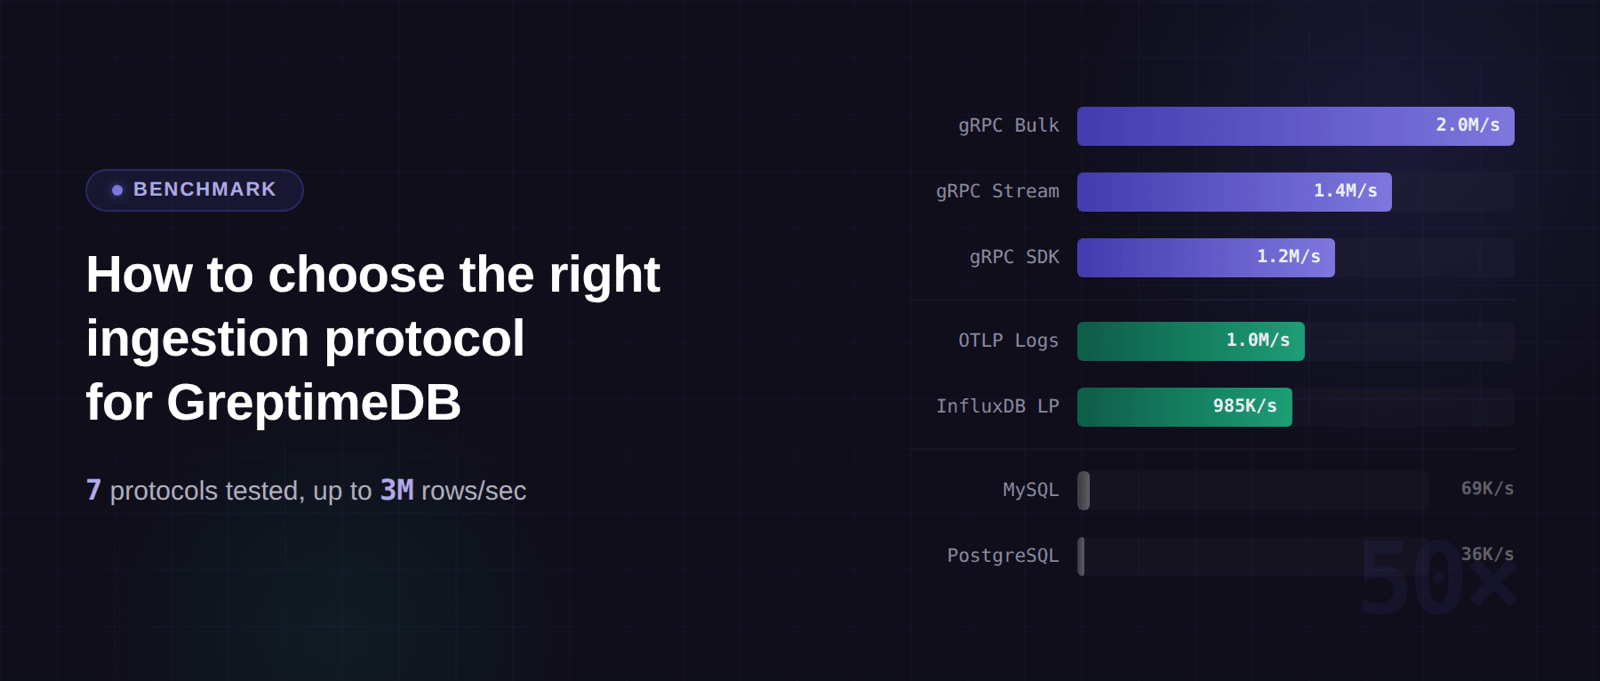
Different ingestion protocols can differ by up to ~37x in throughput. This post uses benchmark data to help you pick the right one.
Updated 2026-04-21: The data below has been regenerated on GreptimeDB v1.0 GA. A few changes relative to the original run are worth noting. The OTLP path now uses the
greptime_identitypipeline to expand attributes into individual columns, producing a storage layout comparable to the other protocols. v1.0 also made Flat SST / BulkMemtable the default; the stricter Arrow schema check on that path surfaced a timestamp type mismatch in the Go ingester, which has been fixed ingreptimedb-ingester-gov0.7.2. PostgreSQL now has prepared-statement caching enabled. Release context is in the v1.0 GA post.
GreptimeDB supports over a dozen ingestion protocols, and the most common question in our community is: which one should I use?
There's plenty of scattered data out there, but test conditions vary so much that direct comparison is impossible. So I built an open-source benchmark tool, greptimedb-ingestion-benchmark, to test the most common protocols under identical conditions. This post shares the results and recommendations.
Protocols tested
Three categories, picked from GreptimeDB's many ingestion options:
GreptimeDB gRPC protocol, used through official SDKs, with three write modes:
| Write mode | Description |
|---|---|
| gRPC SDK (Unary) | One RPC call per batch, simplest |
| gRPC Stream | Bidirectional streaming over a persistent connection, suited for high-frequency and sustained high-throughput writes |
| gRPC Bulk (Arrow) | Arrow Flight DoPut with columnar transfer, highest throughput |
Open standard protocols: InfluxDB Line Protocol (HTTP text) and OTLP Logs (HTTP + Protobuf).
SQL protocols: MySQL INSERT and PostgreSQL INSERT.
We tested OTLP Logs rather than OTLP Metrics. In GreptimeDB's OTLP data model, Metrics maps each metric name to a separate table. This benchmark has 5 metric fields, so the Metrics model would create 5 tables — not a fair comparison. The Logs model writes all fields into a single table, keeping conditions consistent. In this run the OTLP Logs path uses the greptime_identity pipeline, which expands log attributes into individual columns instead of packing them into a JSON column — so the resulting storage layout is comparable to the other protocols.
On Schemaless writes: gRPC SDK, gRPC Stream, InfluxDB LP, and OTLP all support automatic table creation[1] — just write new fields and GreptimeDB adds columns on the fly. SQL INSERT and gRPC Bulk (Arrow) require pre-created tables. SQL depends on an existing table structure for INSERT INTO statements; Arrow Bulk needs the target table to exist for column mapping via the DoPut interface. If your data structure changes frequently (IoT device fields, LLM conversation data, etc.), go with a Schemaless-capable protocol.
Test setup
10 million rows, 1 million time series (1,000 hosts × 5 regions × 10 datacenters × 20 services), 5 float64 metric fields per row, fixed random seed (seed=42). Each protocol writes to its own isolated table. 5 concurrent workers, all SDKs at default settings.
Test environment: MacBook Pro 14-inch (M4 Max, 48 GB), GreptimeDB v1.0 GA standalone mode, greptimedb-ingester-go v0.7.2. This is a single-machine test to compare relative differences between protocols, not to measure absolute throughput limits. A production distributed cluster will yield higher absolute numbers, but the relative ordering stays the same. Full methodology in the repository README.
Results
batch=1000, 1M series
1 million time series is close to real production cardinality, and batch=1000 is a reasonable default for most workloads.
| Protocol | Throughput (rows/sec) | Duration | P50 latency | P99 latency |
|---|---|---|---|---|
| gRPC Bulk (Arrow) | 2,678,839 | 3.7s | 1.54 ms | 8.80 ms |
| gRPC Stream | 1,562,134 | 6.4s | 2.88 ms | 10.77 ms |
| gRPC SDK | 1,174,221 | 8.5s | 4.15 ms | 10.80 ms |
| InfluxDB LP | 889,051 | 11.3s | 5.42 ms | 13.06 ms |
| OTLP Logs (HTTP) | 621,367 | 16.1s | 7.79 ms | 16.38 ms |
| PostgreSQL INSERT | 73,760 | 135.6s | 66.58 ms | 101.58 ms |
| MySQL INSERT | 72,103 | 138.7s | 67.65 ms | 119.37 ms |
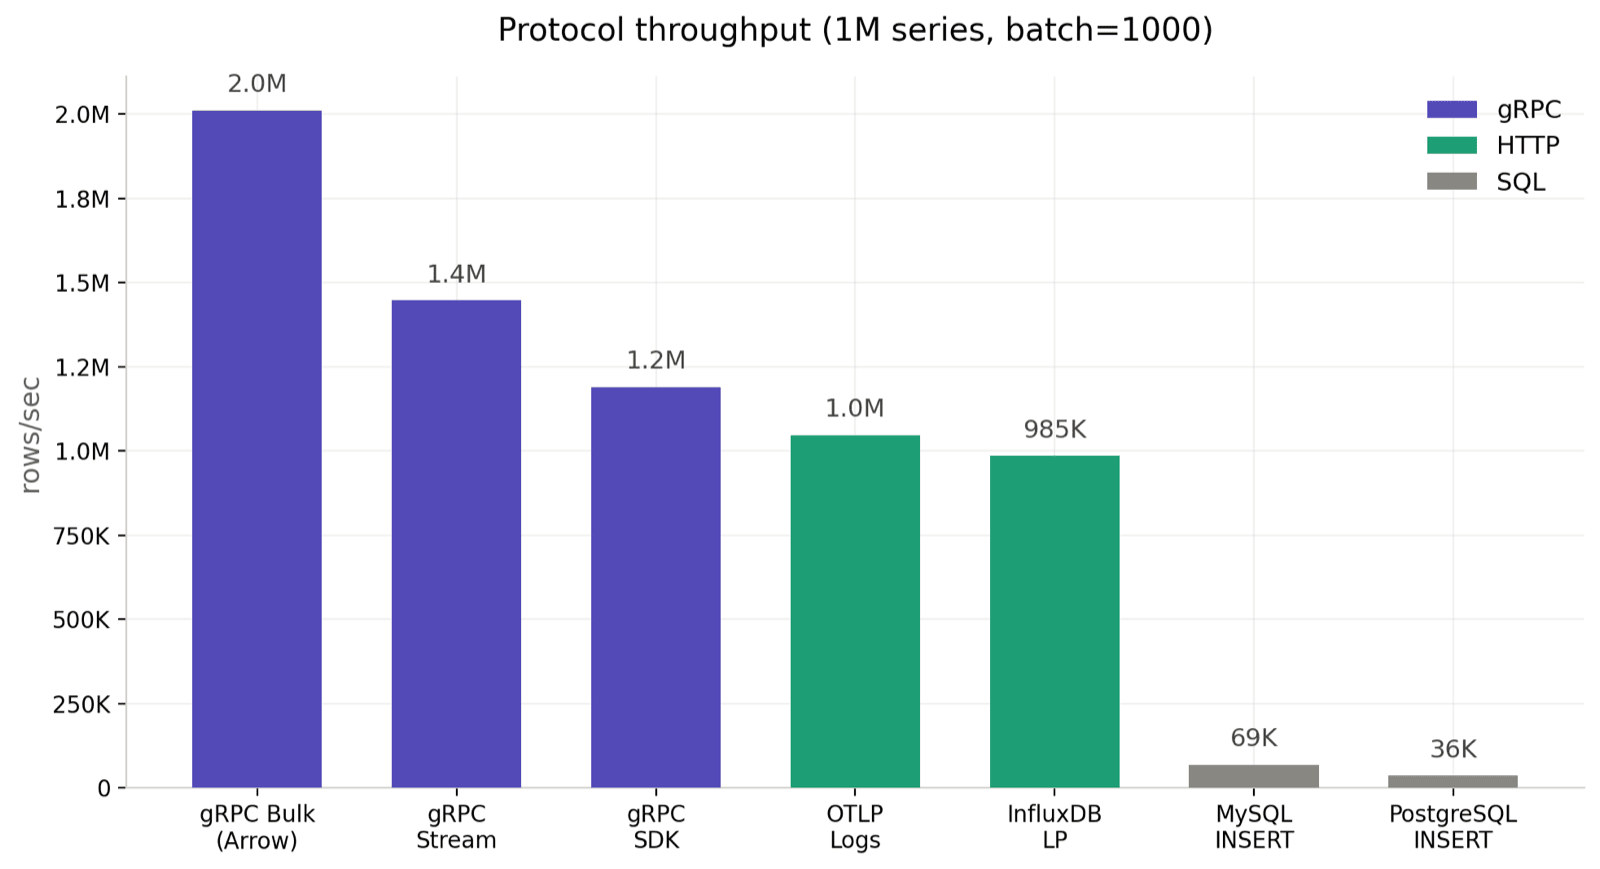
The three gRPC modes land between 1.17M and 2.68M rows/sec. HTTP protocols — InfluxDB LP at 889K and OTLP Logs at 621K — sit in the next tier. SQL comes in at 72K–74K rows/sec. That's roughly a 37x gap between the fastest and slowest.
OTLP at 621K rows/sec falls below InfluxDB LP, which is expected. Both run over HTTP with one request-response per batch, but OTLP additionally runs the greptime_identity pipeline server-side to expand attributes into columns; that expansion is the dominant CPU cost. In return, OTLP logs are stored in a column layout comparable to the other protocols, and, as the cardinality section below shows, this path is nearly insensitive to series count.
A note on the SQL results: both the connection pool and concurrency were set to 5, same as every other protocol in this benchmark. In practice, you can improve SQL write throughput by increasing the connection pool size and concurrency, but that's outside the scope of this test. The numbers here reflect relative performance under identical concurrency.
Lower cardinality reference: batch=1000, 100K series
With fewer time series (a few hundred hosts, say), most protocols are essentially flat — but not all:
| Protocol | Throughput (rows/sec) | P50 latency | P99 latency |
|---|---|---|---|
| gRPC Bulk (Arrow) | 1,950,517 | 1.37 ms | 12.92 ms |
| gRPC Stream | 1,653,225 | 2.64 ms | 11.47 ms |
| gRPC SDK | 1,228,298 | 3.96 ms | 9.87 ms |
| InfluxDB LP | 945,912 | 4.99 ms | 15.26 ms |
| OTLP Logs (HTTP) | 616,848 | 7.46 ms | 18.16 ms |
| PostgreSQL INSERT | 74,218 | 65.90 ms | 106.31 ms |
| MySQL INSERT | 73,813 | 66.12 ms | 107.61 ms |
gRPC Bulk is actually slower at 100K series than at 1M — the opposite of every other protocol. That isn't a typo; the "Series cardinality impact" section below digs into why.
Batch size impact
Four batch sizes (50 / 200 / 1,000 / 2,000) at 1M series:
| Protocol | batch=50 | batch=200 | batch=1000 | batch=2000 |
|---|---|---|---|---|
| gRPC Bulk (Arrow) | 806,495 | 1,524,316 | 2,678,839 | 3,335,918 |
| gRPC Stream | 641,485 | 1,076,555 | 1,562,134 | 1,759,202 |
| gRPC SDK | 552,341 | 950,197 | 1,174,221 | 1,415,292 |
| InfluxDB LP | 507,072 | 761,088 | 889,051 | 1,082,739 |
| OTLP Logs (HTTP) | 425,849 | 564,228 | 621,367 | 683,222 |
| MySQL INSERT | 66,788 | 67,692 | 72,103 | 73,534 |
| PostgreSQL INSERT | 66,490 | 68,176 | 73,760 | 73,617 |
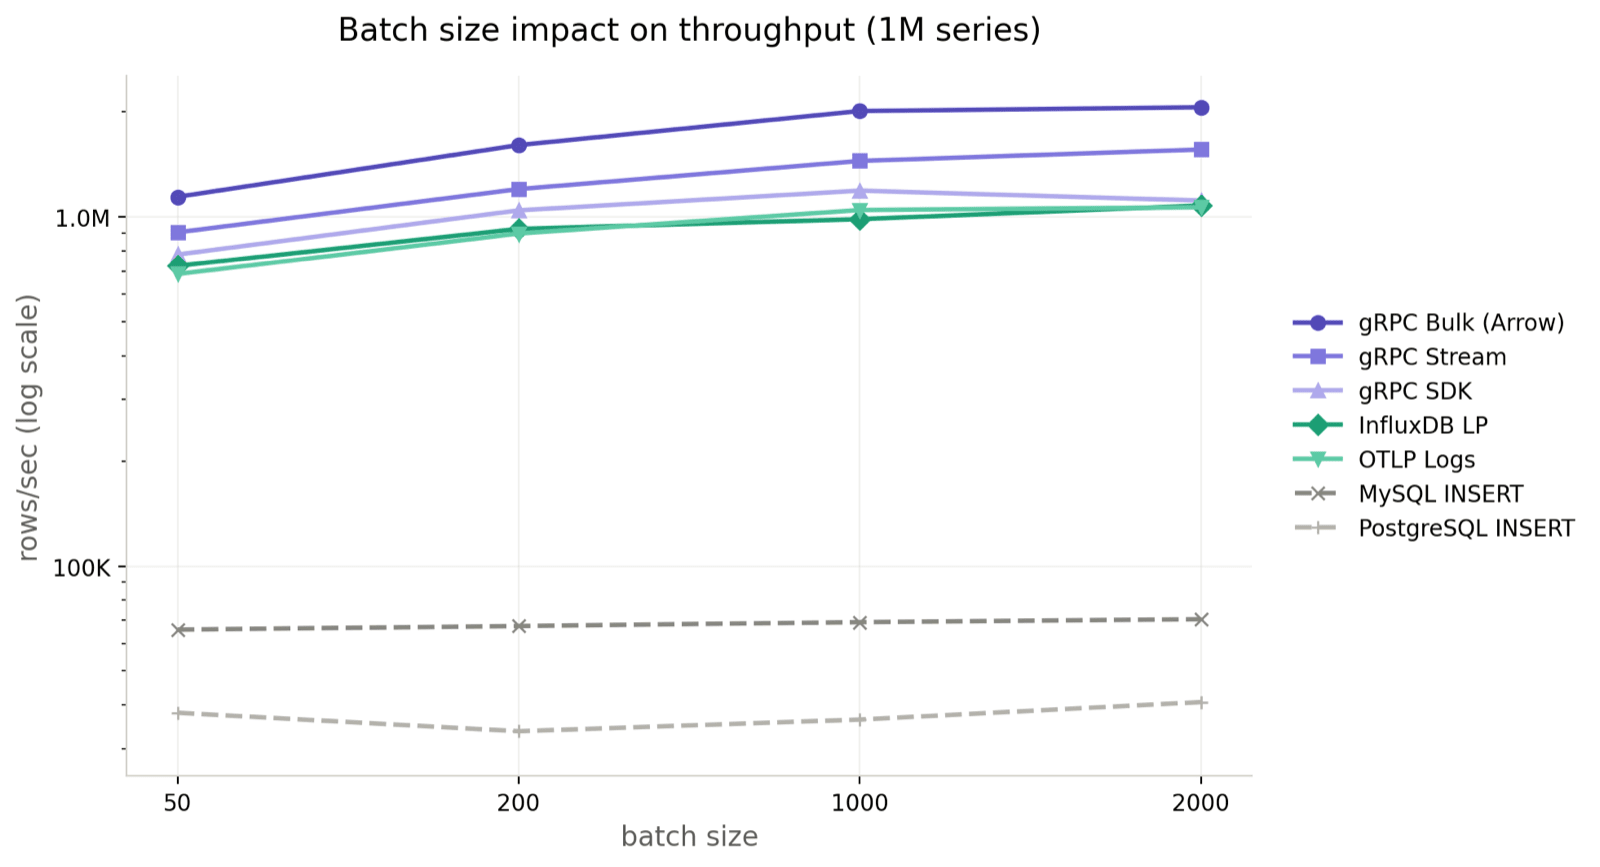
The gRPC family keeps gaining as batches grow. Bulk goes from 806K at batch=50 to 3.34M at batch=2000 — more than 4x. Stream 2.7x (641K → 1.76M), SDK 2.6x. The latency tradeoff is reasonable too: at batch=2000, P99 stays in the low-teens ms for gRPC Bulk (13.78 ms).
InfluxDB LP scales better than OTLP (507K → 1.08M vs 426K → 683K). OTLP runs protobuf plus pipeline processing, both of which are heavier than InfluxDB's plain text line protocol.
SQL barely moves. MySQL goes from 67K to 74K, PostgreSQL from 66K to 74K. Throughput is saturated by the INSERT ... VALUES (...) row-by-row execution model; bigger batches mostly just inflate per-statement latency (P99 climbs from ~7 ms to ~200 ms).
Series cardinality impact
One piece of v1.0 context matters for this section: Flat SST / BulkMemtable is now the default storage format (see the v1.0 GA announcement). Every protocol in this benchmark writes through the new BulkMemtable, and the cardinality sweep reflects that clearly.
100K vs 1M series, batch=1000:
| Protocol | 100K series | 1M series | Change |
|---|---|---|---|
| gRPC Bulk (Arrow) | 1,950,517 | 2,678,839 | +37.3% |
| gRPC Stream | 1,653,225 | 1,562,134 | −5.5% |
| gRPC SDK | 1,228,298 | 1,174,221 | −4.4% |
| InfluxDB LP | 945,912 | 889,051 | −6.0% |
| OTLP Logs (HTTP) | 616,848 | 621,367 | +0.7% |
| PostgreSQL INSERT | 74,218 | 73,760 | −0.6% |
| MySQL INSERT | 73,813 | 72,103 | −2.3% |
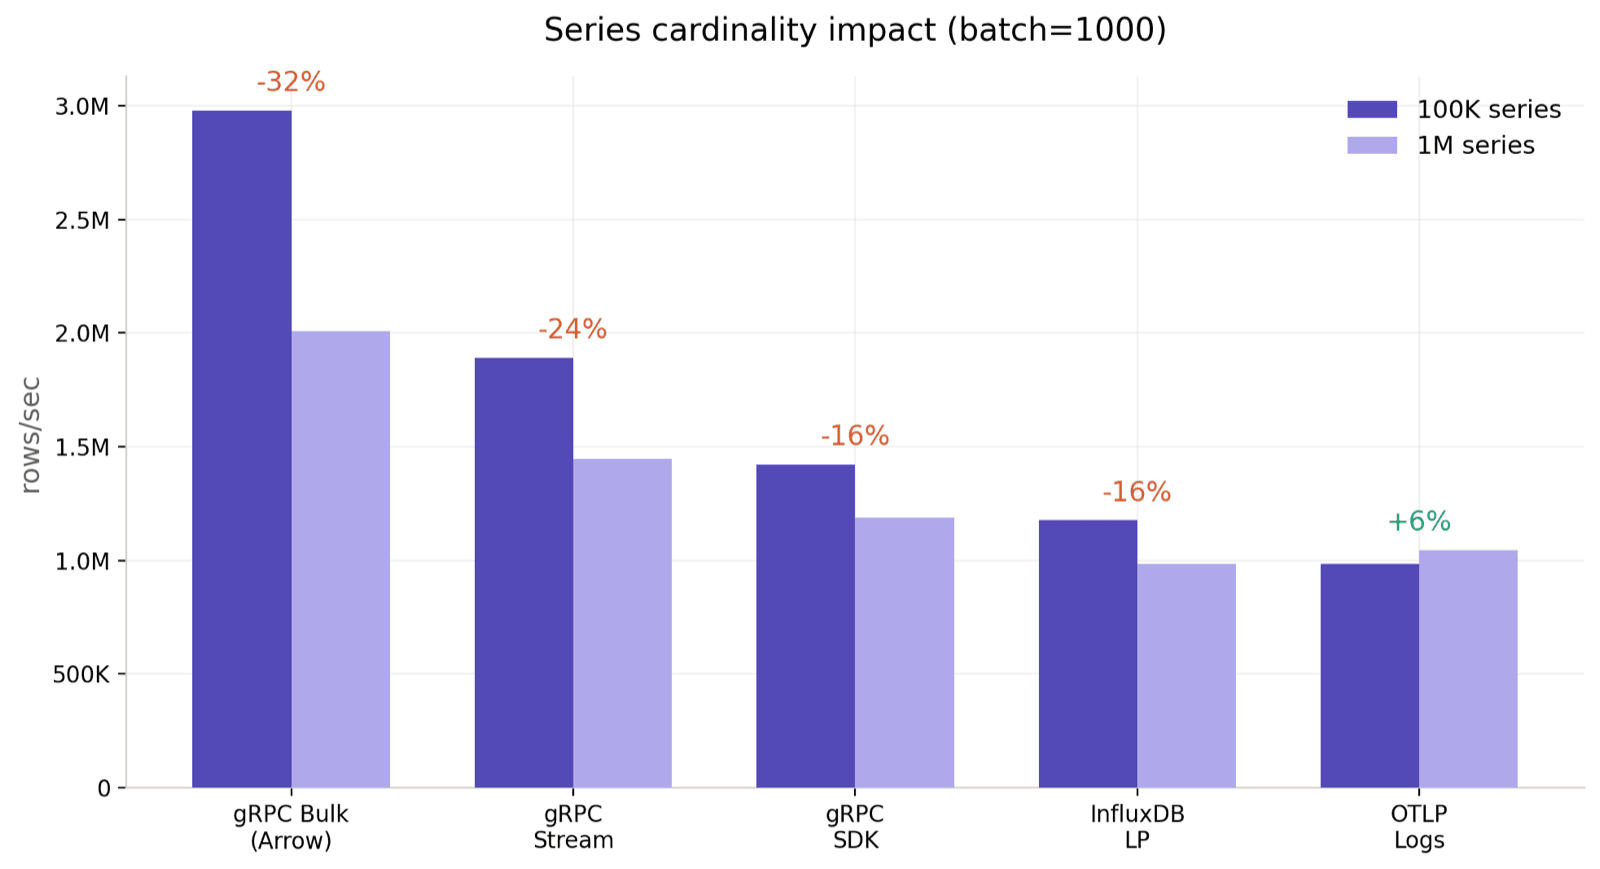
Two observations stand out. Almost everything except gRPC Bulk is flat within ±6%. gRPC Bulk is the outlier and moves in the opposite direction: +37.3% faster at 1M series than at 100K. The result is stable across repeated runs, not a one-off.
Where the difference actually lives
At 10M rows and batch=2000, dumping information_schema.region_statistics plus the mito flush metrics gives a clear picture:
| Metric | 100K series | 1M series |
|---|---|---|
| Throughput rows/sec | 2,159K | 2,933K (+36%) |
| Wall clock | 4.63 s | 3.41 s (Δ = −1.22 s) |
| Region count | 1 | 1 |
Flush count (reason="EngineFull") | 3 | 3 |
| SST output size | 491 MB | 493 MB |
flush_elapsed_sum{type="total"} | 2.31 s | 1.02 s |
flush_memtables sum | 2.28 s | 0.99 s |
write_batch (parquet IO) sum | 2.23 s | 2.01 s |
A few facts read directly off the table above. The two runs have identical region count, flush count, and SST output size, so the gap does not come from triggering more flushes or writing more bytes. write_batch (parquet IO) is nearly identical as well, so the bottleneck is not IO. The only row that moves materially is flush_memtables: at 100K it takes 2.3x as long as at 1M, and that ~1.29 s delta covers almost the entire 1.22 s wall-clock gap. The cardinality reversal is, at its core, a reversal in how long each flush takes inside BulkMemtable.
Control experiment: no flush, no gap
If flush is the source of the gap, shrinking the total write down to something that doesn't trigger a flush should make the gap disappear. It does:
| Scenario | 100K | 1M | Flush count |
|---|---|---|---|
| total = 1M rows (no flush) | 5,138K / 4,981K rows/sec | 5,425K / 3,537K rows/sec | 0 |
| total = 10M rows (3 flushes) | 2,186K rows/sec | 2,929K rows/sec | 3 |
Without a flush, the two cardinalities are indistinguishable (100K even edges ahead on one run). Once flushes start firing, the gap reappears.
50M rows: the same pattern at 5x scale
To confirm this isn't a 10M-row artifact, we reran at 50M rows on the same machine and config:
| batch | 100K rows/sec | 1M rows/sec | 1M advantage | 100K flushes / total | 1M flushes / total | Per-flush ratio |
|---|---|---|---|---|---|---|
| 1000 | 1,604K | 2,235K | +39% | 12 / 5.80 s | 12 / 3.85 s | 1.5× |
| 10000 | 3,171K | 4,090K | +29% | 12 / 14.86 s | 12 / 10.22 s | 1.45× |
Flush count is identical across both cardinalities (12), and the overall shape matches. Each 100K flush runs roughly 50% slower than the corresponding 1M flush. The gap narrows from +39% (batch=1000) to +29% (batch=10000) but does not disappear. Results at 10M and 50M rows agree, so this is a structural effect rather than small-sample noise.
Why only gRPC Bulk shows this
Every other protocol does per-row work on the way in: partition routing, row-to-column conversion, schema validation. That cost grows with cardinality and roughly cancels the flush speedup on the memtable side, which is why Stream, SDK, InfluxDB, OTLP, and SQL all come out within a few percent of flat. Bulk skips almost all of that per-row work (whole Arrow RecordBatches are appended as parts), so the flush-side cardinality effect is no longer hidden. In this range it works in the user's favor.
Why the gap is so large
gRPC's advantage comes from encoding efficiency. Protocol Buffers is a compact binary format — small payloads, fast parsing. The three modes differ in connection handling: SDK sends one independent RPC per batch; Stream reuses a bidirectional stream, skipping per-batch connection negotiation for roughly 20–30% higher throughput; Bulk uses the Arrow Flight protocol[2] for columnar transfer, and since GreptimeDB also uses Arrow internally as its in-memory format, writes are near zero-copy — that's where the 2.68M rows/sec (and 3.34M at batch=2000) comes from. The tradeoff: you need to pre-create the table.
InfluxDB LP and OTLP both run over HTTP, with a full request-response cycle per batch. That's their ceiling. InfluxDB LP uses a text format but is otherwise a thin path; OTLP adds greptime_identity pipeline processing on the server, which is why it ends up below InfluxDB LP in this run even though both are HTTP + batch-oriented.
SQL is slow for two reasons. First, the processing path is long: the client assembles INSERT INTO ... VALUES (...) text, the server parses the SQL, converts types row by row, then writes. Every step adds overhead, and the text payload is much larger than binary. Second, the concurrency model: MySQL and PostgreSQL protocols use synchronous connections — one connection handles one statement at a time, and concurrency is limited by the connection pool. This is fundamentally different from gRPC's asynchronous streaming model. None of this is GreptimeDB-specific — any time-series database accepting SQL writes faces the same protocol overhead.
How to choose
Most workloads: gRPC SDK. Around 1.17M rows/sec, simple code, Schemaless support. Our official SDKs cover Go, Java, Rust, Erlang, and .NET. If you don't have special requirements, start here. For JS/TS stacks (no gRPC JS client yet), use InfluxDB LP or OTLP instead — both have mature JS libraries and perform at the hundreds-of-thousands-rows-per-second level.
Bulk imports: gRPC Bulk. Data migrations, backfills, ETL. ~2.68M rows/sec at batch=1000, over 3.3M at batch=2000; 10 million rows in under 4 seconds. Requires pre-created tables. The Erlang SDK doesn't support this mode yet.
High-frequency or sustained high-throughput: gRPC Stream. IoT gateways, monitoring collectors, or any scenario with continuous non-stop writes. Also a good fit when write frequency is very high with small payloads per request. Bidirectional streaming avoids per-batch connection setup, delivering ~1.56M rows/sec with Schemaless support.
InfluxDB ecosystem: InfluxDB Line Protocol. Already running Telegraf or outputting Line Protocol? Plug straight into GreptimeDB's compatible endpoint. Around 890K rows/sec, near-zero migration cost.
OTel ecosystem: OTLP. Already using OpenTelemetry Collector or OTel SDKs? OTLP is the natural fit at around 620K rows/sec with Schemaless support. The throughput is lower than InfluxDB LP because the server-side greptime_identity pipeline expands attributes into proper columns — worth the cost because it gives you a comparable storage layout. Note that Metrics and Logs use different data models[3]: Metrics creates one table per metric name (suited for Prometheus-style monitoring), while Logs writes to a unified log table (suited for flexible data structures). Pick based on your actual data model.
Development and debugging: MySQL / PostgreSQL. Write throughput is low (~72K rows/sec for both), but mysql, psql, DBeaver, ORMs, and language drivers all connect directly. No Schemaless support — create tables first. Slow writes don't mean slow queries: MySQL/PG protocols are GreptimeDB's primary query interface.
Quick reference
| gRPC SDK | gRPC Stream | gRPC Bulk | InfluxDB LP | OTLP | MySQL/PG | |
|---|---|---|---|---|---|---|
| Throughput | 1.17M/s | 1.56M/s | 2.68M/s | 890K/s | 620K/s | ~72K/s |
| Schemaless | ✅ | ✅ | ❌ Pre-create | ✅ | ✅ | ❌ Pre-create |
| Wire format | Protobuf | Protobuf | Arrow IPC | Text | Protobuf | SQL text |
| SDK coverage | Go/Java/Rust/Erlang/.NET | Same | Same (no Erlang) | All languages | All languages | All languages |
| Best for | General default | High-freq / sustained | Bulk import | InfluxDB migration | OTel ecosystem | Queries & debugging |
In short: pick gRPC for performance (start with SDK, move to Stream or Bulk when needed), pick the compatible protocol for your existing ecosystem (InfluxDB LP / OTLP), and use SQL for queries and debugging.
Reproduce it yourself
bash
git clone https://github.com/killme2008/greptimedb-ingestion-benchmark.git
cd greptimedb-ingestion-benchmark
bin/run.sh
The script downloads GreptimeDB, starts it, runs every protocol, and prints results. Customize as needed:
bash
bin/run.sh -protocols grpc,grpc_bulk,influxdb -batch-size 500,1000,2000
bin/run.sh -host 10.0.0.1  # connect to a remote instance
Got different results, or findings from a specific workload? We'd love to hear about it on GitHub Discussions or Slack.


