

On this page

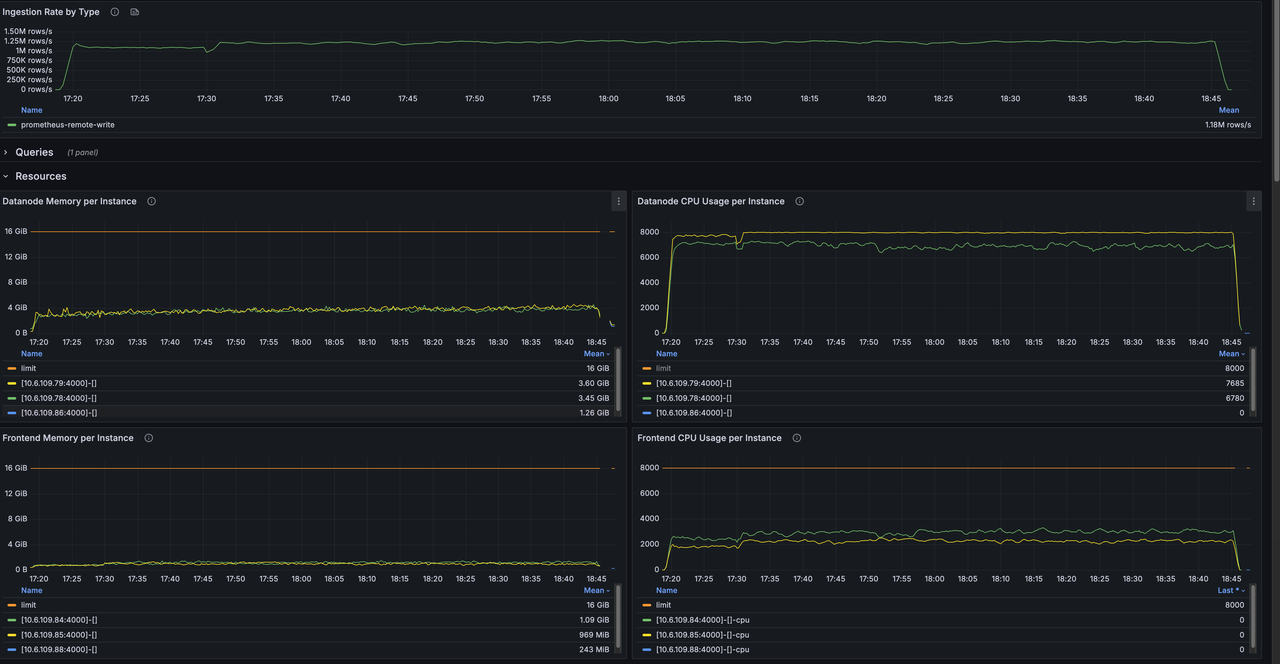
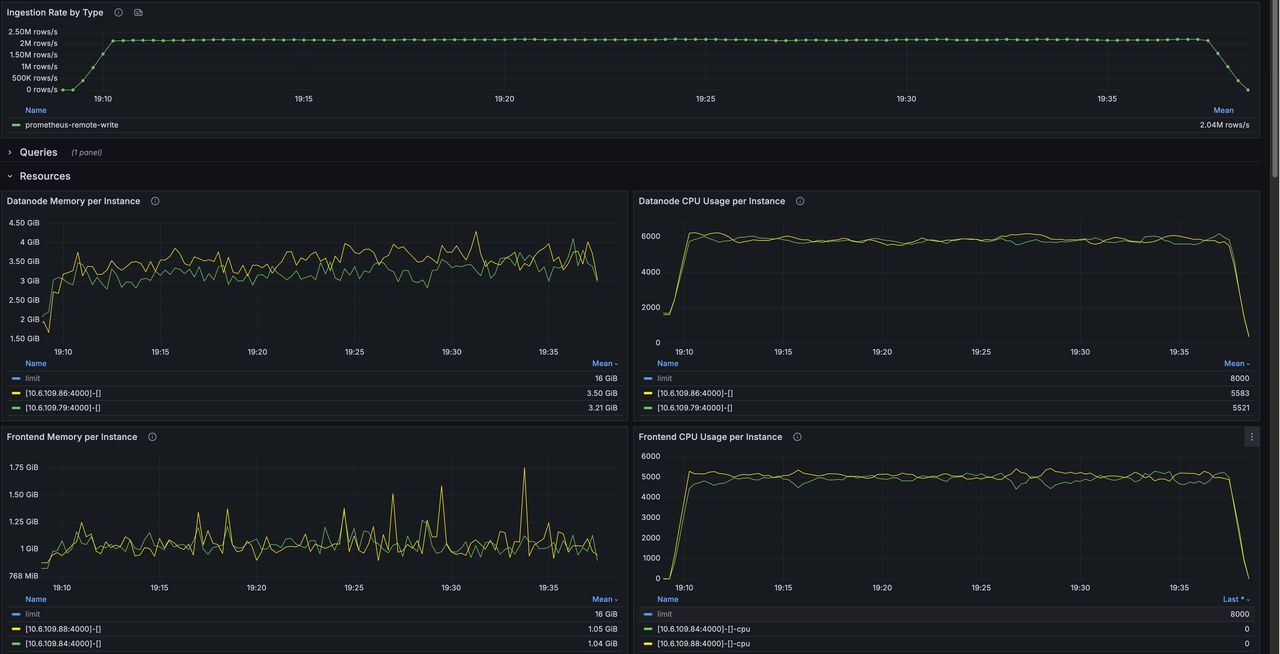
GreptimeDB v1.0 introduces Pending Rows Batcher on the Prometheus Remote Write[1] path. On a 16-region physical table, under the same workload, throughput rises from 1.20M points/sec to 2.17M points/sec, while Datanode CPU usage drops by about 20%.
The cost is roughly double the Frontend CPU. We moved work that used to sit on the Datanode's hot path over to the Frontend, so batched data can flow straight to the storage layer in columnar format. This post walks through the new write path and the problem it solves.
Why Prometheus ingestion is hard on a time-series database
In observability workloads, Prometheus pushes metrics to remote storage via the Remote Write protocol. Each request typically carries only tens to hundreds of data points, but the request rate is very high. The database has to keep up with a steady firehose of small, fragmented writes.
On the original row-by-row write path, every request independently triggers a fixed set of actions:
- Table schema parsing
- Schema alignment:
ALTER TABLEfor missing columns,CREATE TABLEfor missing tables - Row encoding and gRPC transmission
- Row-by-row decoding, primary-key encoding, Memtable write, and WAL append on the Datanode
Many of these are repeated fixed costs. Consecutive writes to the same table re-trigger the same schema checks and format conversions. As TPS climbs, that overhead dominates throughput.
The real bottleneck: the Region Worker's critical section
Fixed overhead is only half the story. The deeper bottleneck lives inside the Datanode.
In GreptimeDB, writes to each Region are serialized through a dedicated Region Worker. To maintain write ordering, the Worker holds a &mut reference to the Region while processing a write, which forms a critical section. No other task can touch the Region while that section is held.
On the row-by-row write path, the work inside the critical section includes:
- Row decoding and validation
- Primary-key encoding and sorting
- Schema alignment and column conversion
- Memtable write
- WAL append
Encoding and sorting are CPU-intensive, and they noticeably extend lock-hold time. Under high TPS, the Region Worker becomes the bottleneck: new requests queue up behind whichever one is still walking through the critical section.
Reducing fixed overhead and shortening the critical section: that's what Pending Rows Batcher is for.
The solution: a three-stage pipeline
Pending Rows Batcher coalesces row data from multiple requests on the Frontend, performs schema alignment and row-to-column conversion in one pass, then writes the columnar batch directly to the Datanode via a BulkInsert RPC. The path has three parts:
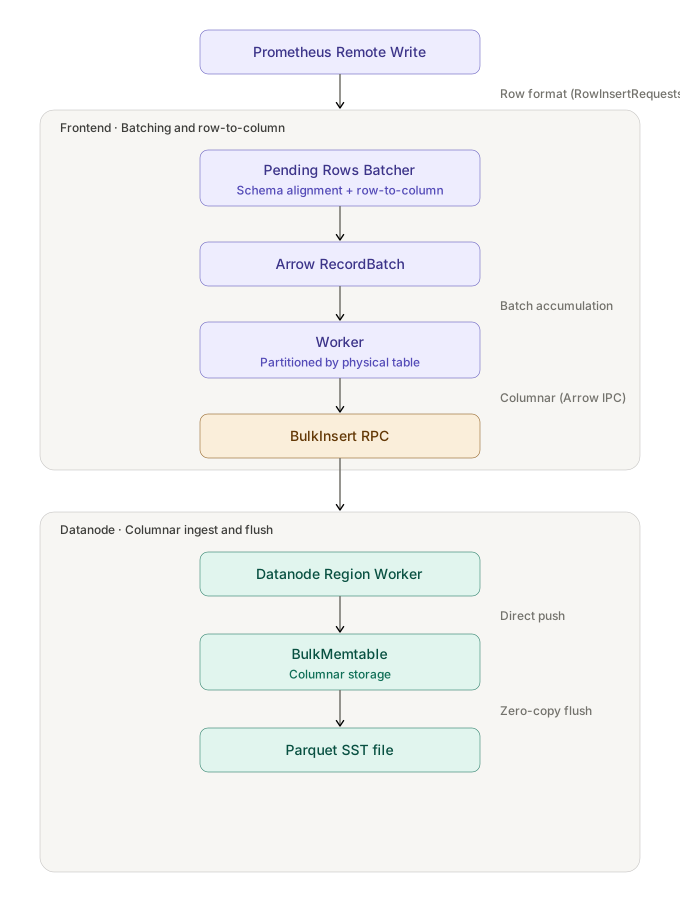
- The Batcher on the Frontend handles batching and row-to-column conversion
- The BulkInsert path transports columnar batches
- BulkMemtable[2] on the Datanode receives the data in its columnar form
The flow breaks down into three stages: submit and align the schema at ingress, accumulate batches per physical table, then bulk write the columnar batch to the Datanode.
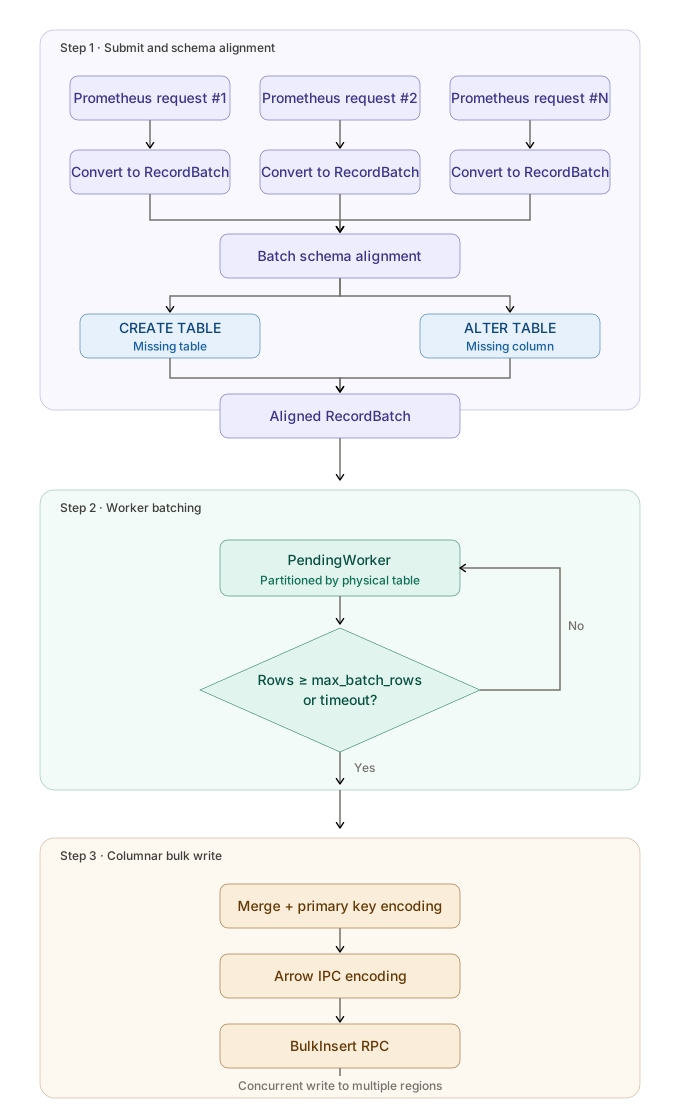
The idea is to move the expensive work — decoding, encoding, sorting, schema alignment — out of the Datanode's critical section and onto the Frontend. The Region Worker then has nothing to do except consume pre-encoded RecordBatches.
Key points along the write path
Submit and schema alignment
When a Prometheus Remote Write request arrives, the Batcher converts it to an Arrow RecordBatch[3] and aligns the schema along the way:
- For existing logical tables, missing tag columns are detected and added via batched
ALTER TABLEcalls - For previously unseen metric tables, the tables are auto-created via batched
CREATE TABLEcalls - All DDL operations are grouped by physical table and executed in batches, avoiding per-request DDL overhead
Schema-change cost gets amortized across the entire batch instead of being paid request by request.
Logical tables vs. physical tables
A quick detour through the Metric Engine abstraction first.
In Prometheus workloads, each metric is exposed to the user as a logical table — different metric names map to different logical tables. Under the hood, multiple logical tables can map to a single physical table, and that physical table is the one that handles the actual data writes, partitioning, and Region management.

So the Batcher doesn't simply do "one batch per metric". It aligns schemas at the logical-table level first, then merges by the physical table they map to. Multiple metrics sharing the same physical table also share a Worker and a flush rhythm, and they end up as a single larger columnar batch on the way to the Datanode.
This is why the phrase "partitioned by physical table" keeps coming up. The logical table is what the user sees as a metric table and its schema; the physical table is what decides how data is organized and scheduled for bulk writes underneath.
Worker batching: two flush triggers
Each physical table has a dedicated background Worker. RecordBatches submitted to the Worker accumulate until either of two triggers fires. Total rows reach max_batch_rows (100,000 by default) and the Worker flushes immediately, or pending_rows_flush_interval elapses since the last flush and the Worker flushes on a timer. Workers idle for more than 3× flush_interval get shut down automatically to release resources.
Timed flushes bound the latency floor; full-batch flushes maximize batch size. Together they balance low latency against large batches.
Columnar bulk write
On flush, the Batcher merges the RecordBatches of all logical tables in the batch, encodes them as Arrow IPC, and writes them to the target Region in a single BulkInsert RPC. Compared to the original row-by-row Insert, this cuts network round-trips, lets the Datanode work directly on columnar data without row-to-column conversion, and supports partition-based splitting so writes to different Regions run in parallel.
How the critical section gets shorter
Mapped back to the critical section bottleneck, the division of labor along the path looks like this:
- Frontend (outside the critical section): row-to-column conversion, schema alignment, primary-key encoding, partition splitting. These CPU-intensive operations run asynchronously inside the Batcher and don't tie up any Region Worker.
- Datanode (inside the critical section): when the Region Worker receives a BulkInsert request, it pushes the already-encoded Arrow IPC RecordBatch straight into the Region. No decoding, no sorting, no row-by-row processing.
The work inside the critical section shrinks from "decode + primary-key encode + sort + Memtable write + WAL" down to "ingest a pre-encoded RecordBatch". Lock-hold time drops sharply, and the Region Worker's throughput climbs with it.
Columnar end-to-end: the role of BulkMemtable
Once the Frontend has turned row data into an Arrow RecordBatch, the next question is what happens to that columnar data on the Datanode side.
If the Datanode still used the original row-based Memtable (TimeSeriesMemtable), the columnar batch would get torn back apart into per-row Mutations, encoded primary-key-by-primary-key, and inserted row by row. Whatever the Batcher gained from coalescing would be wiped out. The network would save a few round-trips, but the storage layer would fall right back into row-by-row processing.
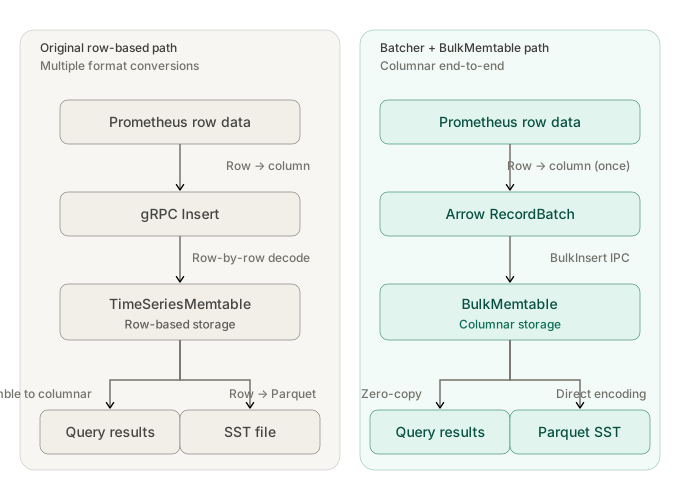
BulkMemtable, also introduced in GreptimeDB v1.0, closes this gap. It's a Memtable built specifically for columnar bulk writes: it only accepts RecordBatch input, stores data in a columnar layout internally, and exposes a RecordBatch iterator on scan.
With BulkMemtable in place, the full write path looks like this:
Prometheus Remote Write → Batcher (row-to-column + accumulate) → BulkInsert RPC (Arrow IPC) → BulkMemtable (columnar storage) → flush (columnar Parquet) → query (columnar scan)
After the Batcher does its single "row → column" conversion, the data never falls back to row format again. That gives us:
- No format conversion overhead: BulkMemtable receives RecordBatches directly, no need to tear them back into per-row structures
- Zero-copy flush: data already encoded as in-memory Parquet bytes goes straight into SST files
- Vectorized queries: RecordBatches emitted on scan can be consumed directly by DataFusion
BulkMemtable's internal design — Part hierarchy, merge strategy, in-memory Parquet encoding — is a deep topic on its own. We covered it in a separate post: Optimizing time-series databases for high cardinality: GreptimeDB's Flat format design. The takeaway for this post is simpler: Pending Rows Batcher and BulkMemtable together form a columnar pipeline from ingress to storage.
Performance
The benchmark runs against a physical table with 16 Regions. Under an identical Prometheus Remote Write workload, we measure write throughput and resource usage under the default mode and the Pending Rows Batcher mode.
Write throughput
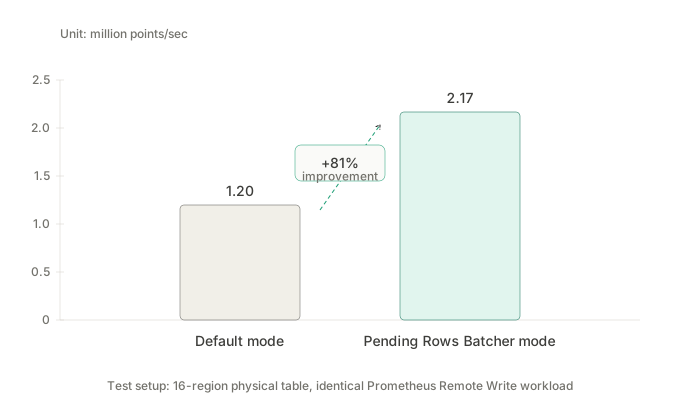
With Pending Rows Batcher enabled, write throughput rises from 1.20M points/sec to 2.17M points/sec, an 81% improvement.
Resource usage
| Metric | Default mode | Batcher mode | Change |
|---|---|---|---|
| Write throughput | 1.20M points/sec | 2.17M points/sec | +81% |
| Datanode CPU | 14.9 cores | 11.95 cores | -20% |
| Datanode memory | 7.14 GB | 6.36 GB | -11% |
| Frontend CPU | 5.2 cores | 10.15 cores | +95% |
| Frontend memory | 2.09 GB | 2.04 GB | flat |
The Frontend CPU bump is expected. Schema alignment, row-to-column conversion, and primary-key encoding all moved over there. The trade is Frontend compute for higher throughput and lower Datanode load. In most deployments the Datanode is the constrained resource, since it's directly tied to storage, flushing, and query performance, while the Frontend is stateless and easy to scale horizontally. The trade pays off in production.
Raw monitoring data
The two Grafana screenshots below were captured during the benchmark and can serve as raw reference for the numbers above.
How to enable
Bulk write mode is configured on the Frontend. If your workload is dominated by high-TPS, small-batch Prometheus Remote Write requests, enable the Metric Engine and set the Pending Rows Batcher parameters in the Frontend config:
toml
[prom_store]
enable = true
with_metric_engine = true
pending_rows_flush_interval = "5s"
max_batch_rows = 20000
max_concurrent_flushes = 256
worker_channel_capacity = 65526
max_inflight_requests = 3000
Key parameters:
enable: enable the Prometheus Remote Write storage entry point.with_metric_engine: store Prometheus metrics through the Metric Engine. This is a prerequisite for the logical/physical table mapping and the bulk write path.pending_rows_flush_interval: the batching time window. Set to 0 to disable the Batcher. The example uses 5 seconds.max_batch_rows: the maximum row count per batch. Once reached, the batch flushes immediately. The example uses 20,000.max_concurrent_flushes: the maximum number of flushes in flight at once.worker_channel_capacity: the channel capacity for each Worker, used to buffer requests submitted to that physical table's Worker.max_inflight_requests: the maximum number of in-flight requests, used as backpressure to prevent the Frontend from piling up unfinished writes.
Summary
Pending Rows Batcher uses a three-stage pipeline (align schema, accumulate, columnar bulk write) to lift Prometheus Remote Write throughput by more than 80% and cut Datanode resource usage at the same time.
What it does is repartition the work between the Frontend and the Datanode. The Frontend takes on more preprocessing (accumulation, schema alignment, row-to-column conversion, primary-key encoding) so the Datanode's Region Worker can stay focused on the operations that actually need to be inside the critical section. Combined with BulkMemtable's columnar pass-through, the write path no longer bounces data between row and column formats.
For high-cardinality, high-TPS observability workloads, enabling the new path takes a handful of Frontend config lines.
Related PRs: #7831, #7877, #7902, #8054.


