On this page
We released GreptimeDB v1.1.0 on June 14, 2026.
Update (June 18, 2026): upgrade to v1.1.1, not v1.1.0. v1.1.0 has a JSON compatibility bug — legacy JSONB columns carried over from a v1.0.x upgrade can return incorrect query results or fail during flush. If you use the JSON data type, skip v1.1.0 and go straight to v1.1.1, which fixes it.
It's another production-focused release after the v1.0 GA. Compared with v1.0, this one centers on a few clear areas:
- Adjusting the data distribution of existing tables
- More efficient Flow execution in incremental scenarios
- A data semantic layer built for LLMs and agents
- Observability for trace data in the Dashboard
- Stability fixes across queries, storage, WAL, metadata, and protocol compatibility
Development at a glance
Here are the development stats for v1.1.0:
- 215 changes are included in this release note
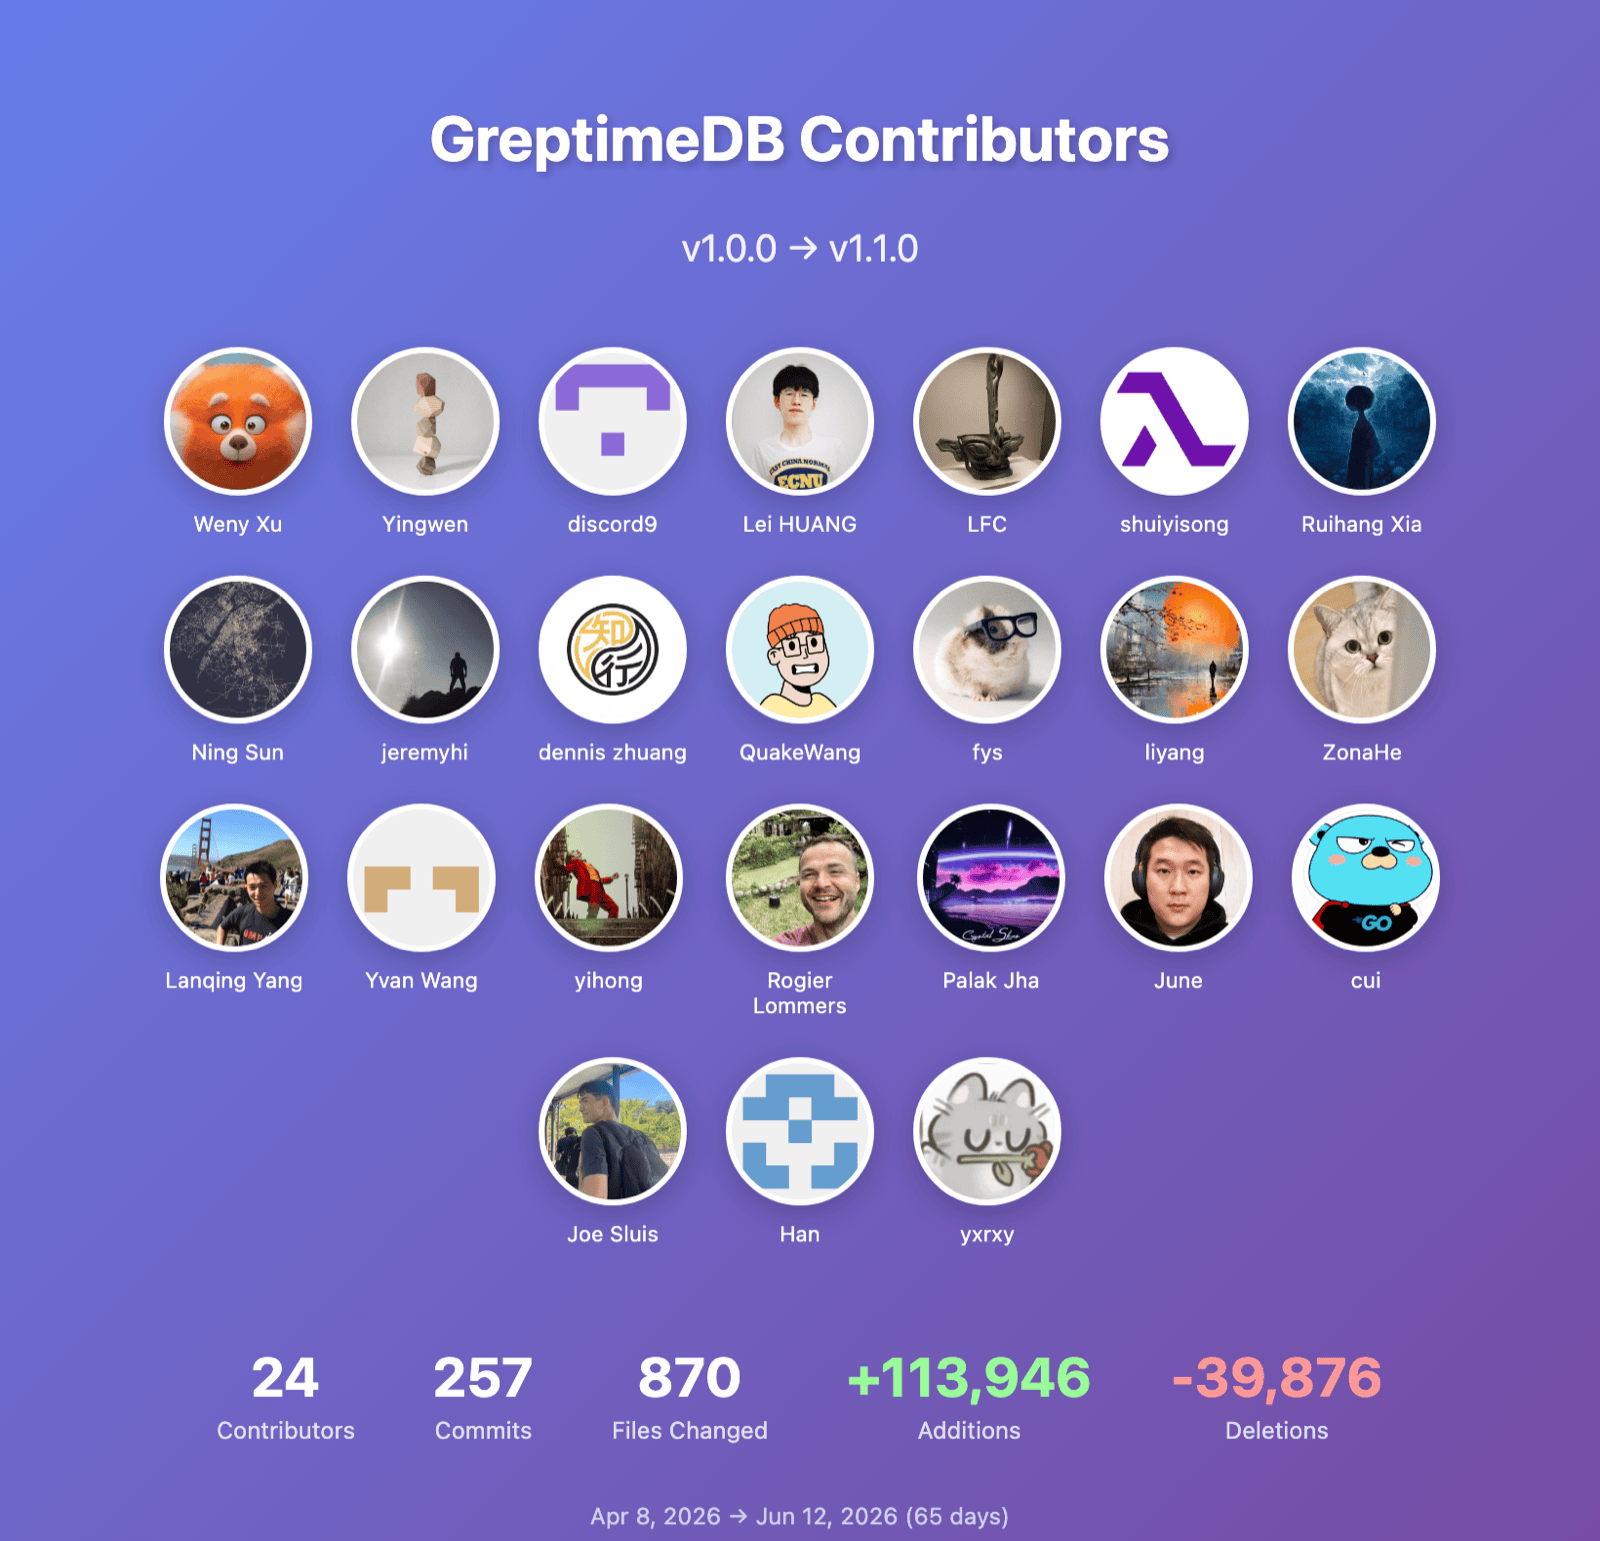
- 21 contributors took part in this release
- 5 of them submitted code to GreptimeDB for the first time
Breakdown of the main improvements:
- 94 feature enhancements: online repartitioning of existing tables, incremental Flow reads, CSV import options, JSON2, Import/Export v2, the Table Semantic Layer, Remote Dynamic Filter, Dashboard trace visualization, and more
- 43 bug fixes: stability issues in Region edit, incremental Flow reads, WAL replay, metadata cache, MySQL prepare, OTLP JSONB logs, and others
- 25 refactors: internal cleanup across Mito/Mito2, Region edit, compaction, export-v2, and pipeline ingestion
- 7 performance optimizations: PromQL rate, metrics table join, SparseValues decode, and WAL entry encoding
- 10 test improvements: added coverage for repartition chaos, CSV skip bad records, JSON benchmarks, and rebuild index
- 29 engineering and dependency improvements
- 4 breaking changes
- 1 RFC: the Table Semantic Layer
Thanks to everyone who contributed to this release, and a warm welcome to the developers and users joining the GreptimeDB community.
Highlights of this release
Online repartitioning for existing tables
One key change in v1.1.0 is support for partitioning tables that started out with no partition rules.
In earlier versions, only tables created with PARTITION ON COLUMNS could keep adjusting their partition layout via SPLIT PARTITION and MERGE PARTITION. Starting with v1.1.0, you can also split an existing table without partition rules from a single Region into multiple partitions using ALTER TABLE ... PARTITION ON COLUMNS.
For example:
SQL
ALTER TABLE sensor_readings PARTITION ON COLUMNS (device_id, area) (
  device_id < 100 AND area < 'South',
  device_id < 100 AND area >= 'South',
  device_id >= 100 AND area <= 'East',
  device_id >= 100 AND area > 'East'
);
So you no longer have to lock in your future data distribution when you create the table. As data grows and access patterns change, you can repartition an existing table step by step.
Note that this requires a distributed cluster with shared object storage and GC enabled. After the initial partitioning, you can keep using SPLIT PARTITION and MERGE PARTITION to fine-tune the layout.
Previously, repartitioning could only adjust boundaries on the existing partition columns. This release adds an optional ON COLUMNS clause to SPLIT PARTITION and REPARTITION, so you can add partition columns to an existing table, for example expanding from device_id to device_id and area. Without ON COLUMNS, the current partition columns are reused.
Experimental incremental reads in Flow
In batching mode, Flow used to re-run the entire source query on every execution. For a large, continuously appended source table, that means a lot of repeated scanning you don't need.
v1.1.0 introduces an experimental incremental read. Once enabled, Flow reads only the data appended since its last run, which cuts redundant computation in append-only scenarios.
The feature is off by default. You can enable it in the flownode configuration:
toml
[flow.batching_mode]
experimental_enable_incremental_read = true
Or per Flow via the WITH option:
SQL
WITH (experimental_enable_incremental_read = 'true')The source table has to be append-only, meaning it was created with append_mode = 'true'. If that condition isn't met, Flow falls back to a full-snapshot query.
This feature is still experimental, so test it in a non-production environment before turning it on.
The Table Semantic Layer lands its first pieces
v1.1.0 starts rolling out the Table Semantic Layer in phases: a lightweight layer of semantic information on top of your table data that makes it easier for LLMs, agents, and tools like visualization and alerting to understand and use that data.
It reuses existing mechanisms and adds no new protocol or DDL keywords. Table-level semantics live under the greptime.semantic.* namespace in table_options, field-level information comes from the standard SQL column COMMENT, and everything is discovered through views in information_schema. These annotations are also filled in automatically when data arrives over protocols like Prometheus Remote Write and OpenTelemetry. This release lands the first three pieces: semantic identification, automatic annotation, and the information_schema.table_semantics view.
SQL
CREATE TABLE my_metrics (
  ts TIMESTAMP TIME INDEX,
  val DOUBLE
) WITH (
  'greptime.semantic.signal_type' = 'metric',
  'greptime.semantic.source' = 'custom',
  'greptime.semantic.metric.type' = 'counter',
  'greptime.semantic.metric.unit' = 'By'
);
These semantics are then exposed to tools through the MCP server and table_semantics.
The companion MCP server reaches 0.5.0
GreptimeDB's companion MCP server, which lets LLMs and agents access data through the Model Context Protocol, also shipped 0.5.0 in the same cycle. This version brings three changes: prompts now use sandboxed Jinja rendering, a more complete describe table that returns sample data and semantic metadata, and a development-oriented allow-write mode for testing.
Trace visualization in the built-in Dashboard
The built-in Dashboard supports a trace list view and a Gantt view for individual trace detail. No setup required — a single SQL query drills into a trace.
With metrics, logs, and traces all integrated, you can browse and pinpoint trace data right here, with no need to stand up a separate external visualization stack from day one. This follows a direction GreptimeDB has pursued for a while: handle metrics, logs, and traces in one place, and plug into existing ecosystems wherever possible.
Performance optimizations
v1.1.0 brings a batch of performance improvements:
- PromQL runs faster. Range functions like
rateandincreaseimproved by up to 97% in benchmarks, and TSID-based joins speed up metric joins. End-to-end average latency for PromQL queries is generally 20–40% lower than in v1.0. - Scans read fewer rows. Parquet prefiltering, prefilter result caching, and remote dynamic filtering during Datanode scans cut unnecessary row reads. With prefiltering on, the TSBS
cpu-max-all-8query ran 4.5x faster. - Reads touch less storage. Page index reads and range cache reuse reduce storage reads for scan-heavy queries. In one workload, page index reads cut the SST bytes fetched by 93.2%.
Other notable improvements
Beyond the changes above, v1.1.0 includes a set of enhancements across queries, storage, import/export, and the semantic layer.
- A new JSON2 type: supports insert, flush, query concretization, planner, compaction, and field access pushdown to Parquet (note: this feature is not fully ready yet)
- Import/Export v2 got more complete: the import-v2 pipeline, retry, resume, progress mode, and progress UI, plus export-v2 snapshot listing, verification, and delete
- CSV import:
COPY FROMaddsSKIP_BAD_RECORDS(skip rows that fail to parse or convert types) andHEADERS = 'false'(import header-less files and map columns by position) - Remote Dynamic Filter moved forward: the base capability, Frontend registration, fan-out updates, and Datanode scan application
- More query-side optimizations: the PromQL binary op join simplifier, range cache, prefilter cache, nested projection, and parquet nested leaf projection
- More protocol and interface coverage: gRPC-Web, pgwire 0.40, prepared statement execution timeout, and PostgreSQL parameter parsing range checks
- Execution and runtime isolation: the Datanode separates its query and write runtimes so large queries and writes no longer drag each other down, plus support for remote WAL logical pruning
- Operations and security: password verifier formats, a password hash generation command, the information_schema statistics table, and SST primary key range inspection
Individually, not all of these are headline features, but together they cover queries, writes, import/export, protocol compatibility, and observability.
Key fixes
v1.1.0 also fixes a batch of stability issues, mostly in the areas below.
Region, WAL, and metadata stability
This release focuses on several critical paths in long-running distributed deployments:
- Region edits and compaction: GreptimeDB now queues new writes during a Region edit and still lets compaction publish, so states don't conflict.
- Closing follower Regions: closing a follower Region now skips unnecessary flushes.
- Region stats: a Region now counts only the SSTs it owns, so the numbers are more accurate.
- WAL and metadata: error classification for WAL prune retries is more complete, remote WAL replay checkpoint handling is improved, and the cache no longer returns stale values after metadata invalidation.
- Leader handoff: the Metasrv leader now closes its heartbeat stream promptly when it steps down.
These fixes mainly affect long-running stability in distributed deployments, especially the paths around Region edits, metadata refresh, WAL replay, and leader handoff.
Flow correctness and compatibility
Incremental Flow reads come with both new capabilities and fixes in v1.1.0. The release note includes incremental read correctness hardening, support for complex SQL full-query Flows, and a fix for running eval-interval Flows without a time window.
If you're evaluating Flow, these fixes matter just as much as the new capabilities.
Protocol, query, and data format fixes
v1.1.0 fixes LIMIT placeholder inference in MySQL prepare, preservation of unknown placeholders, nested projection roots, inverted index pruning, OTLP JSONB logs compatibility with existing schemas, and a gRPC max connection age panic.
These span client compatibility, query planning, data formats, and runtime stability. They're the kind of edge cases you're more likely to hit in everyday use.
Compatibility notes
v1.1.0 includes 4 breaking changes worth checking before you upgrade.
1. gRPC CLI option names aligned with configuration naming
If your scripts, automation, or ops docs reference the old gRPC CLI option names directly, check them against the new naming before upgrading.
2. Corrected information_schema index metadata output
This release corrects index metadata in information_schema. Verify any downstream queries, monitoring, or integration logic that relies on the old output format or old field meanings.
3. Adjusted scoped flow repair snapshot behavior
v1.1.0 fences the scoped flow repair snapshot so state can't be misused across scopes. If you rely on Flow repair or recovery paths, watch for the behavior change after upgrading.
4. Mito2 removes PartitionTreeMemtable
This is an internal Mito2 refactor. Ordinary SQL usage won't notice it, but if you have internal extensions, tests, or debugging logic that depend on this structure, you'll need to update them.
Who should look at v1.1.0
For existing GreptimeDB users, the scenarios worth evaluating first include:
- You need to re-plan partitions for large existing tables
- You already run v1.0 anywhere and have hit a performance issue or a bug
- Your Flow source table is append-only and full re-scans are expensive
- You're accessing GreptimeDB with LLMs or agents and want your data to be easier to understand and use
- You want to view traces directly in the built-in Dashboard
- You're running distributed clusters, WAL, Flow, the MySQL/PostgreSQL protocols, or OTLP ingestion
If any of these apply to you, it's worth testing and evaluating v1.1.0 soon.
Closing
For the full changelog, see the GitHub Release.
Thanks to everyone who filed an issue, opened a PR, joined a discussion, or ran GreptimeDB in a real environment. A special shout-out to the 5 first-time contributors in this release:
v1.1.0 continues the direction set after the v1.0 GA: keep production usability and stability solid.


