
On this page

Observability Is Converging. Humans Aren't the Only Ones Querying It Anymore ended with a question: when agents become the main consumers of telemetry data, does the database itself have to change? This post is our answer, and an attempt at a definition.
We changed the GreptimeDB homepage to read "The open-source observability database."
The name has little market behind it today. Gartner tracks Observability Platforms, not observability databases. ClickHouse calls ClickStack an observability stack, Apache Doris files observability under use cases, and Grafana, Datadog, and Honeycomb all sell a platform. Even ClickHouse, the company with the best claim to database-engine credibility, says only that the database is the central component of an observability platform, and does not call its observability product an observability database[1].
We chose a position that no analyst covers and that no competitor shares.
But we are not doing this to coin a new word. It works the other way round: we need the word to constrain the product. Call it positioning. GreptimeDB serves telemetry data only, and the database engine has to understand what that data means, then decide how to store it, how to index it, how to query it, and how to scale it. Drop any one of those and "observability" is only a use case attached to a database.
What an observability database is
My definition of an observability database:
A database that provides unified storage and querying for telemetry data, including metrics, logs, traces, and wide events. It understands the semantics in the data and uses them to optimize storage, query execution, and scaling, and it supports real-time semantic queries and cross-signal correlation.
Unification has to be visible to users at four levels.
First, one logical data model. In the logical model of an observability database, metrics, logs, traces, wide events, and, once they are production-ready, profiles should all appear as tables. They share one schema system, type system, time index, and tag system. Cross-signal correlation can be written as ordinary SQL, instead of a UI issuing several independent queries and stitching the results together.
A wide event here means one very wide timestamped event record. In GreptimeDB it is not a separate signal type; it is a table with a lot of columns.
Second, one storage format. Data is kept in a columnar format, so users do not have to maintain entirely different compression, indexing, and cost models per signal.
Third, one storage layer. Object storage holds long-term retention, while local disk and memory handle hot data and caching. Storage capacity and compute can scale separately, and retention policy does not have to be set three times, once per signal.
Fourth, one query engine. SQL handles exploratory analysis and cross-table relationships, and PromQL continues to serve metric queries. PromQL is also compiled into a logical query plan and handed, like SQL, to the GreptimeDB query engine to optimize, turn into a physical plan, and execute, with no separate PromQL-specific copy of the data. That is why PromQL also has TQL EXPLAIN and TQL ANALYZE, which show the query plan and the runtime metrics[2].
Note that all four describe the system the user sees; they do not imply a single physical design underneath.
Today's stack splits the data, and splits the problem with it
For a long time, observability has borrowed existing kinds of databases. Metrics look like time series, so they went into a TSDB. Logs look like documents, so they went into Elasticsearch. Later, columnar databases turned out to be cheaper, and logs started moving into ClickHouse and Doris. Traces usually get a backend of their own, Tempo for example.
Each of these choices is reasonable on its own. Put together, they leave the integration work to platform and SRE teams.
The metrics, logs, and spans from one request are written into different systems. A trace_id may be stored three times, and a pod name may be pod in one schema, pod_name in another, and k8s.pod.name in a third. Grafana's cross-store correlation saves the copy-paste, but the mechanism is still a link with variables in it: query one data source, then plug a field value into a query template pointed at another data source. Underneath, these are still independent queries in different systems[3].
Architectures like this work, and a large number of production systems run exactly this way. The problem shows up when one question has to be answered across systems. A single investigation has to interpret labels, sampling ratios, and entity identity at the same time, and line up the time ranges of several systems. Each additional system crossed adds a query, a round of moving results, a round of semantic alignment, and a round of time alignment.
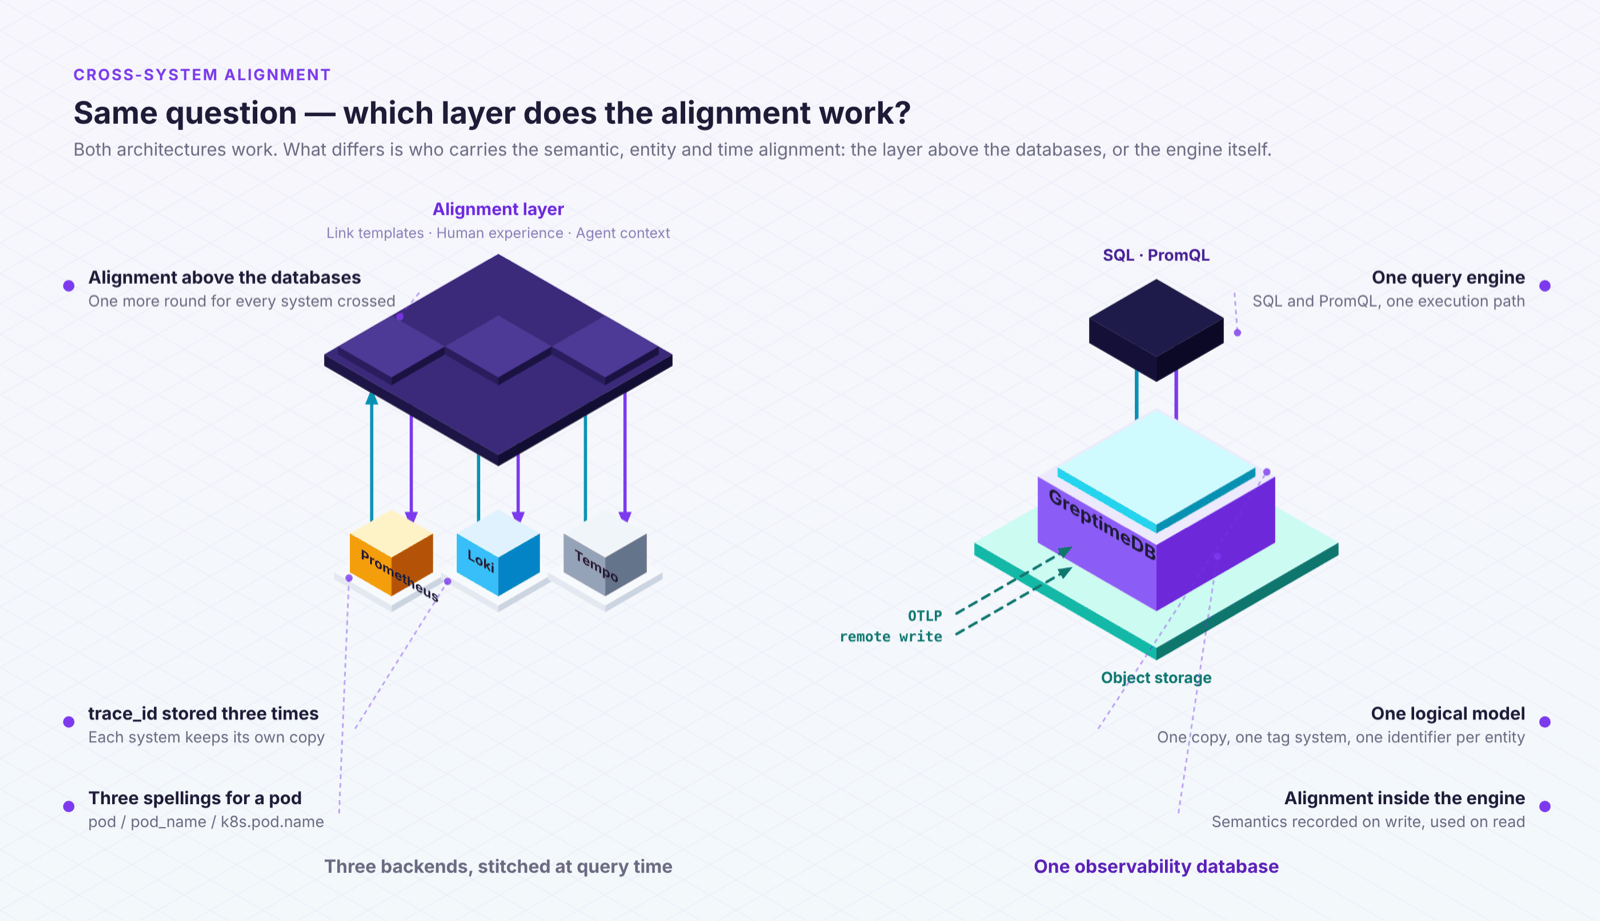
Engineers close many of these gaps from experience. Agents amplify the cost. A human investigates only as fast as they can read charts and write queries. An agent can explore a large number of hypotheses at once, in query shapes that are harder to predict. Putting the database behind an AI front door does not make the physical limits disappear. Point reads still read data, joins still consume memory, and cross-source correlation still pays for network round trips.
To measure these costs, we built a benchmark that fixes the model and the prompt and changes only the query interface: on one side, the native APIs of Prometheus, Loki, and Tempo; on the other, read-only SQL and PromQL on GreptimeDB. Six models, 14 incidents, 504 end-to-end investigations. The unified-interface side read about 48% fewer input tokens and cost about 45% less in model API spend; both results were consistent across the six models, and the input-token reduction stayed significant after Holm correction in three of them. Correct diagnoses were 130 for the unified interface and 105 for the three backends[4].
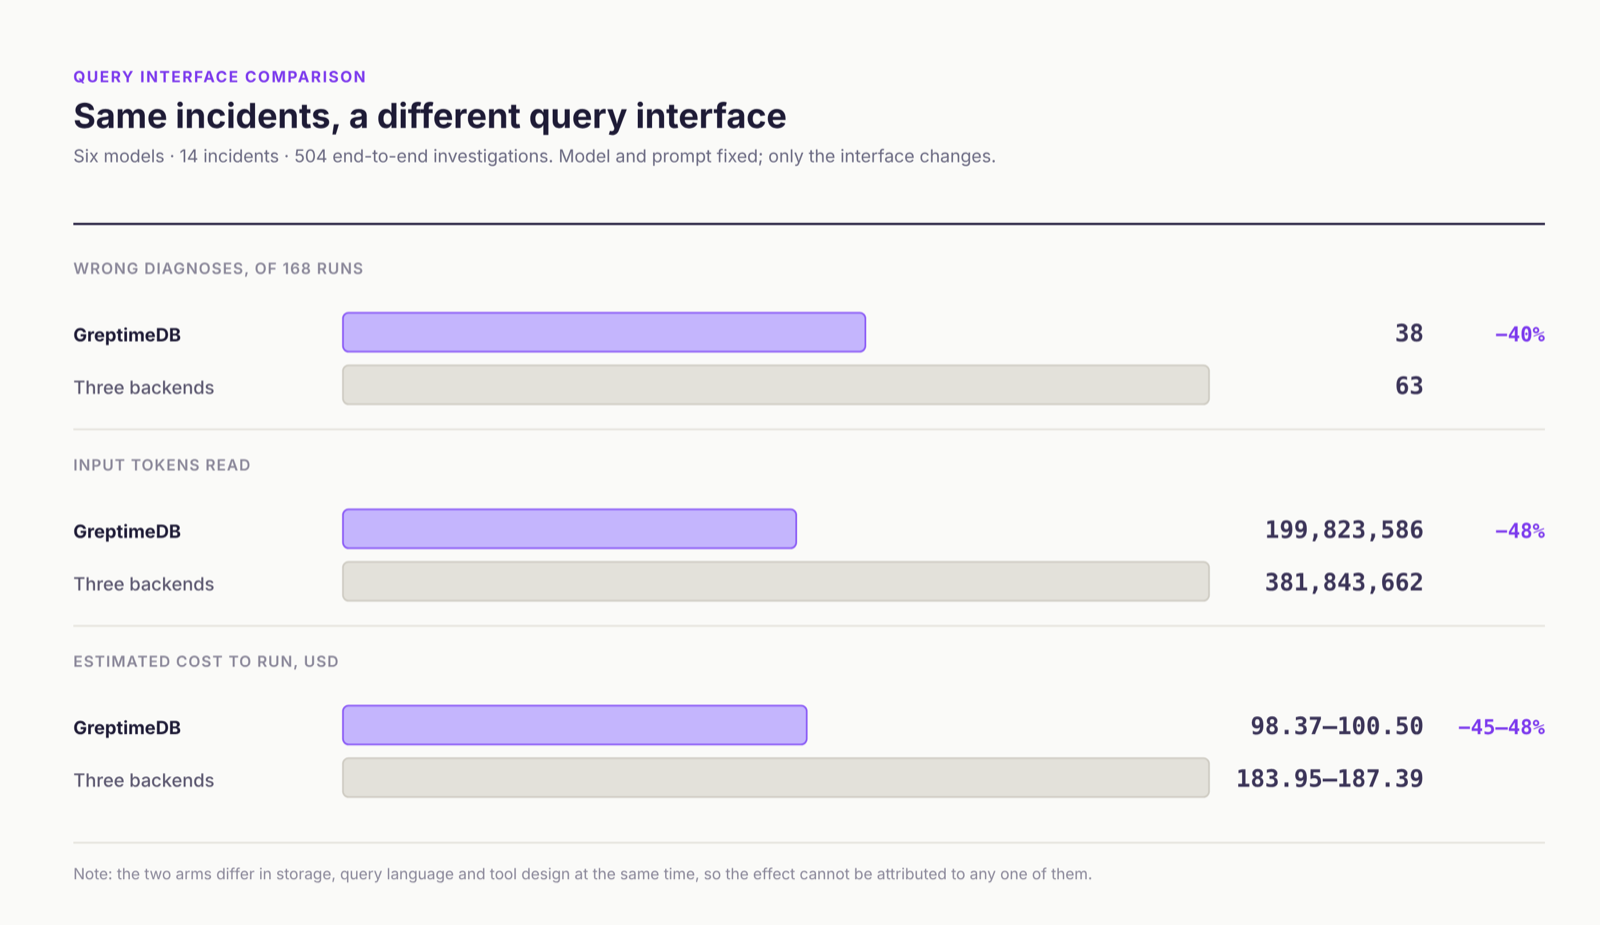
Changing the interface also changed the storage, the query language, and the tool design, so the effect cannot be attributed to any one of them alone.
We want to move this alignment work inside the database.
Agents need the database to keep the semantics
The cost above comes from query volume. Another kind of cost comes from how agents get things wrong. An engineer who is unsure whether a metric is a cumulative counter usually checks the docs or asks the maintainer. An agent sees only table names, column names, and values. If it gets the semantics wrong, it can write a query that is syntactically correct and semantically wrong, such as calling sum on a counter: the query succeeds, the chart renders, the result is wrong, and nothing raises an error. In Grafana's 2026 survey, respondents named having to supply too much context by hand as the top blocker to using AI for critical work, at 26%[5].
These semantics are complete only when the data is written. OTLP declares a metric's type, unit, and temporality in the protocol, but once the data becomes table rows, the unit is dropped during row encoding and cannot be recovered after the write, and temporality is not visible from the metric name either. On the Prometheus side, a counter is often only inferred from the _total suffix rather than declared by the protocol. If the database does not record this at write time, no MCP server, platform, or agent above it can put it back, however it is designed. Only the database can do this. GreptimeDB v1.3 records these as table options when it auto-creates a table: metric.type, metric.unit, metric.temporality, and metric.metadata_quality, which separates protocol-declared (declared) from suffix-inferred (inferred)[6].
Here is what that looks like on a v1.3.0 instance, after writing metrics over OTLP and over Prometheus remote write:
sql
SELECT table_name, source, metadata_quality, semantic_options
FROM information_schema.table_semantics
WHERE table_schema = 'semantics_demo'
  AND table_name IN ('http_server_requests_total',
                     'queue_jobs_processed_total',
                     'prometheus_http_requests_total')
ORDER BY source, table_name;
+--------------------------------+---------------+------------------+-------------------------------------------------+
| table_name | source | metadata_quality | semantic_options |
+--------------------------------+---------------+------------------+-------------------------------------------------+
| http_server_requests_total | opentelemetry | declared | {"metric.original_name":"http.server.requests", |
| | | | "metric.temporality":"cumulative", |
| | | | "metric.type":"counter", |
| | | | "metric.unit":"{request}"} |
| queue_jobs_processed_total | opentelemetry | declared | {"metric.original_name":"queue.jobs.processed", |
| | | | "metric.temporality":"delta", |
| | | | "metric.type":"counter", |
| | | | "metric.unit":"{job}"} |
| prometheus_http_requests_total | prometheus | inferred | NULL |
+--------------------------------+---------------+------------------+-------------------------------------------------+The first two tables arrived over OTLP, so the type, the unit, and the temporality are all declared by the protocol; queue.jobs.processed is a delta counter, and the original metric name is kept as well. The last one arrived over Prometheus remote write 1.0. The _total suffix suggests a counter, but the protocol declares nothing, so metric.type is left empty and the metadata is recorded as inferred.
Recording them is not enough; they also have to be findable. The first step of an agent's investigation is usually finding which table and which signal the evidence is in. Semantics stored as table options can be read with a single SQL query against information_schema.table_semantics, with no need to scan table names and guess first. In that same benchmark we measured the semantic layer separately: rows returned dropped in all 35 table-discovery results, the cases that require locating the table and signal holding the evidence[4:1]. For now, the semantic layer helps mainly at this evidence-finding step, and entity relationships across layers are still being extended down into the infrastructure layer.
Once found, they also have to be used correctly. If temporality and metadata quality stay in the database, the query layer can pick the algorithm that matches the semantics, or tell the agent plainly that a value is only inferred. GreptimeDB v1.3 already has one example: OTLP delta Sum and Histogram metrics are written with an otlp_aggregation_temporality="delta" label, and PromQL's rate() and increase() compute per series, summing interval values for delta series while still treating cumulative series as counters. One query can cover both kinds of series without computing a delta series as if it were a counter[7].
Throw this information away and ask every tool above to guess it again, and the result is several mutually inconsistent semantic layers.
Why this position is still open
The problem is clear. So why has this position stayed open?
Two kinds of product dominate observability today.
One is the platform. Platforms collect data and provide charts, alerting, service maps, root cause analysis, and incident response. Gartner's definition of Observability Platforms follows the same boundary: storing and analyzing telemetry data is only one of the required capabilities, alongside cross-signal exploration, component discovery and mapping, business transaction modeling, outage cause analysis, contextual enrichment, and collection from public clouds[8].
The other is the general-purpose data engine. ClickHouse, Elasticsearch, and Doris can all carry a substantial observability load, but none of them can limit itself to that. ClickHouse also serves real-time analytics, Doris also does warehousing and search, and Elastic now positions the company around Search AI. Serving observability well expands their market. Calling themselves an observability database would shrink it.
The position may not be open for lack of value. The more direct explanation: only a database willing to give up the other workloads can carry the name.
GreptimeDB accepts that limit.
The limit also comes with an obligation. Putting metrics, logs, and traces into the same columnar database is still far from the definition above. A general analytics engine can do that too, possibly very well. An observability database has to answer a different question: when the database knows a row is a counter, a span, a resource attribute, or a Kubernetes entity, can it make a better decision than a general engine?
Standards make this kind of database practical
This could not be built before, not because nobody thought of it, but because special-purpose databases used to die on migration cost. An engine can understand one class of data very well and still require the user to accept a new schema, SDK, and query language. Re-instrumenting every service just to change one storage layer is usually not worth it.
That barrier is much lower now. OpenTelemetry unified the transport protocol, Resource, InstrumentationScope, Attributes, and the cross-signal correlation keys. Prometheus remote write is already the de facto standard in the metrics ecosystem. Kubernetes resource labels have stable conventions. A database can recognize semantics in data that already exists, without first persuading the user to adopt a GreptimeDB-specific model.
OpenTelemetry is not the only thing to look at. In Grafana's 2025 survey, metrics adoption was 95% and traces 57%, and responding organizations were still using an average of eight observability technologies. In the 2026 survey, the shares collecting metrics, traces, and logs with OpenTelemetry were only 57%, 50%, and 48%[5:1]. Prometheus's job and instance and the Kubernetes resource conventions are stable because so many systems depend on them that they can barely be changed now. A database that only understands OTel misses a large amount of data that already exists.
Coverage is also uneven across the standards. The HTTP and database semantic conventions are stable, and a core set of Kubernetes resource attributes became stable with v1.42.0 in June 2026, while some Kubernetes metrics are still release candidates. The GenAI conventions are still in Development and have been moved into a separate repository[9]. Semantics are most reliable on traditional infrastructure workloads, and change fastest around agents. So the database has to record where each piece of semantic metadata came from and how far it can be trusted: write unknown when it does not know, write mixed when sources disagree, and do not manufacture a false certainty to keep the schema tidy. The metadata_quality above is one case of this, and unknown and mixed are values shared across GreptimeDB's semantic fields[6:1].
GreptimeDB's semantic layer is designed along these lines, in two parts. The first part is table semantics, which records what a single table represents. Signal type, source, metric type, unit, temporality, and protocol conventions are kept when the data becomes a table, and stay visible to queries through table options and information_schema.table_semantics[6:2]. The second part is the semantic graph, which records structure across tables: which entities the rows describe and how those entities relate. It is queried through two tables, greptime_private.semantic_entities and greptime_private.semantic_relationships, covered in the topology section below[10]. Today the one querying is usually an engineer; tomorrow it may be an alert generator, an MCP server, or a troubleshooting agent.
Physical specialization is done by the database
The previous post quoted Charity Majors on the pillars being a lie. Her point is that these three kinds of data should not be stored separately, and I agree with that. But not storing them separately does not mean they can share one physical design. Infrastructure metrics usually arrive at high frequency with relatively stable dimensions, and have to be kept for a long time at a very low unit cost. Logs and wide events carry high-cardinality attributes, and logs also need text search. Spans are wide rows, filtered by attribute and also fetched by trace_id to rebuild a call tree. No single primary key, index, or sharding rule is best for all of these workloads at once.
The common objection starts exactly here: metrics are a cardinality problem, logs are a search problem, traces are a lookup-by-ID problem; each database can only be good at one or two of them and has to compromise on the third; therefore there is no observability database, only a choice of store by dominant signal.
I agree with the first step. The three workloads really are three different storage problems. The second step does not hold, because it treats "one physical design" as the same thing as "one database." One physical design cannot serve all three workloads at once, but one database can hold several physical designs, specialized per signal, with no compromise on any of them. The third step also assumes two things: that a team has only one dominant signal, and that it never needs to answer a question across signals. What the earlier sections describe is the cost when those two assumptions do not hold.
What makes GreptimeDB different is not that it removes this specialization, but that protocol semantics trigger it automatically and the design keeps improving afterwards. Take Elastic. To optimize logs and metrics separately, it offers two index modes in one engine, logsdb and time_series. The two modes have different sort requirements, so the user chooses when creating the index and has to understand the consequences of the choice[11]. Specialization is exposed to the user as configuration here, and it is a choice the engine could have made itself: the data already says whether it is logs or metrics.
There is one rule. Where the protocol is certain, the engine decides. Where the protocol is not certain, the engine does not guess; it takes the more general approach and adjusts to real load. Every example below is that rule at work.
When OTLP traces auto-create a table, the schema follows the structure of a span. duration_nano could be computed from timestamp and timestamp_end, but it is still materialized as its own column, because the engine knows duration is the value people filter and sort by. The physical design comes from the protocol as well: a nanosecond-precision time index, and the service and operation companion tables generated along with it[12]. You configure none of this.
The design can also keep evolving. Since v1.3, traces have a second data model: v1 flattens attributes into separate table columns; v2 collects them into three fixed JSON2 columns. The change came from what users ran into. For the same attribute key, different SDKs and programming languages do not always send the same type: the first write may be a string, and later writes an empty string or an int. With flattened columns, v1 converts what it can and rejects the spans it cannot; JSON2 does not have that problem. The protocol will not tell you this, because OTLP does not declare a type contract for attributes and the answer depends on how your particular set of producers behaves. So the engine does not guess: you choose v1 or v2 through a pipeline header.
The compaction parameters fall under the same rule. In a general-purpose database, the TWCS time window, the trigger file count, and the output file size usually have to be tuned by a person or an external tool. Choose the wrong window and queries slow down and write amplification goes up; changing it afterwards forces a one-time rewrite of historical data. In GreptimeDB some of these parameters are decided directly by semantics: the Metric Engine's physical tables use a one-day compaction window by default, which suits metric queries over long time ranges better.
Scaling is the same rule. A distributed database has two questions to answer when it scales: along which key the data is split, and when to split it and into how many parts. The first can be answered by semantics, the second only by load. Trace semantics answer the first: point reads by trace_id are the most common access pattern, and trace IDs are usually generated at random, so trace tables are partitioned by default on the first character of trace_id, writes spread across regions (GreptimeDB's unit of table partitioning), and the spans of one trace land in the same partition[12:1]. Metrics have no partition key that works in general, and the database will not pick one just to look automatic. The Metric Engine lets a large number of logical metric tables share one physical table, so what scales is the physical table's regions, independent of the number of metric names[13]. Region Balancer moves regions to less-loaded datanodes based on write and query load. All of these actions assume shared object storage; what transfers between nodes is ownership of a region, not the data files[14].
Specialization does not stop at the choices made when the table is created. We are also building a dedicated storage layout and execution path for PromQL. Here is how the same rule lands as physical design for metrics and for traces:
| metrics | traces | |
|---|---|---|
| Engine and table mode | Metric Engine; many logical metric tables share one physical wide table; sparse primary key encoding | Mito Engine; append-only, set by the protocol; primary key is service_name |
| Partitioning | No partition key that works in general, so none is chosen up front; when to split and into how many parts is left to load (Auto Repartition in GreptimeDB Enterprise) | 16 partitions on the first character of trace_id |
| Indexing | Inverted index segments sized down to 256 rows for metrics | Skipping indexes on trace_id, service_name, and parent_span_id |
| Compaction | One-day window by default on the physical table | No deduplication needed; no dedicated window yet, inferred from the time span of the existing files |
What is unified is the logical model, the storage, and the query engine, not a requirement that all signals share one physical design.
The topology is already in the telemetry
A span already records the caller, the callee, and when the call happened. Resource attributes record which service, pod, and node a metric or log belongs to. This data is itself evidence of entities and relationships.
The common approach is to maintain a service catalog or graph store alongside it. The cost is synchronization. After a service is renamed, a deployment moves, or a label changes, the catalog and the telemetry can quietly stop matching. Nothing errors out; the mismatch surfaces when an investigation gets two contradictory answers.
GreptimeDB derives entities and relationships from the telemetry instead, and keeps the graph as a logical view, the semantic graph mentioned above. It is available in v1.3 and still marked experimental: the two tables greptime_private.semantic_entities and greptime_private.semantic_relationships are computed at query time from stored telemetry and not written to disk separately; the calls edges generated from traces carry RED metrics; multi-hop traversal is written as ordinary SQL with WITH RECURSIVE, and SQL/PGQ graph query syntax is not implemented yet[10:1].
A derived view lags too, but the lag can be measured and bounded, while the divergence of an independent catalog has no natural bound. Where lower query latency is needed, the Flow Engine can maintain an incremental materialized view at write time, and there is still only one logical definition.
There is one point here that is easy to miss: relationships carry time. A calls B holds only inside some window. After a release finishes, an instance exits, or a route changes, the relationship changes. A service catalog detached from time keeps describing a world that is partly out of date, which works against troubleshooting rather than for it. GreptimeDB records derived edges in 60-second windows, so "current topology" is a query over the most recent windows, and entities and edges that stop producing telemetry disappear on their own[10:2].
This layer is not only for agents. On top of it we built a service map in the GreptimeDB Dashboard: a real-time service dependency graph. The nodes, the call edges, and the request count, error count, and latency on each edge all come from a few time-ranged SQL queries against these two tables. The Dashboard does not pair up spans itself and does not maintain a separate topology store. It is only one consumer of this layer of data, and the same queries can be issued by Grafana, an MCP server, or a troubleshooting agent, so it does not cross the product boundary described above.
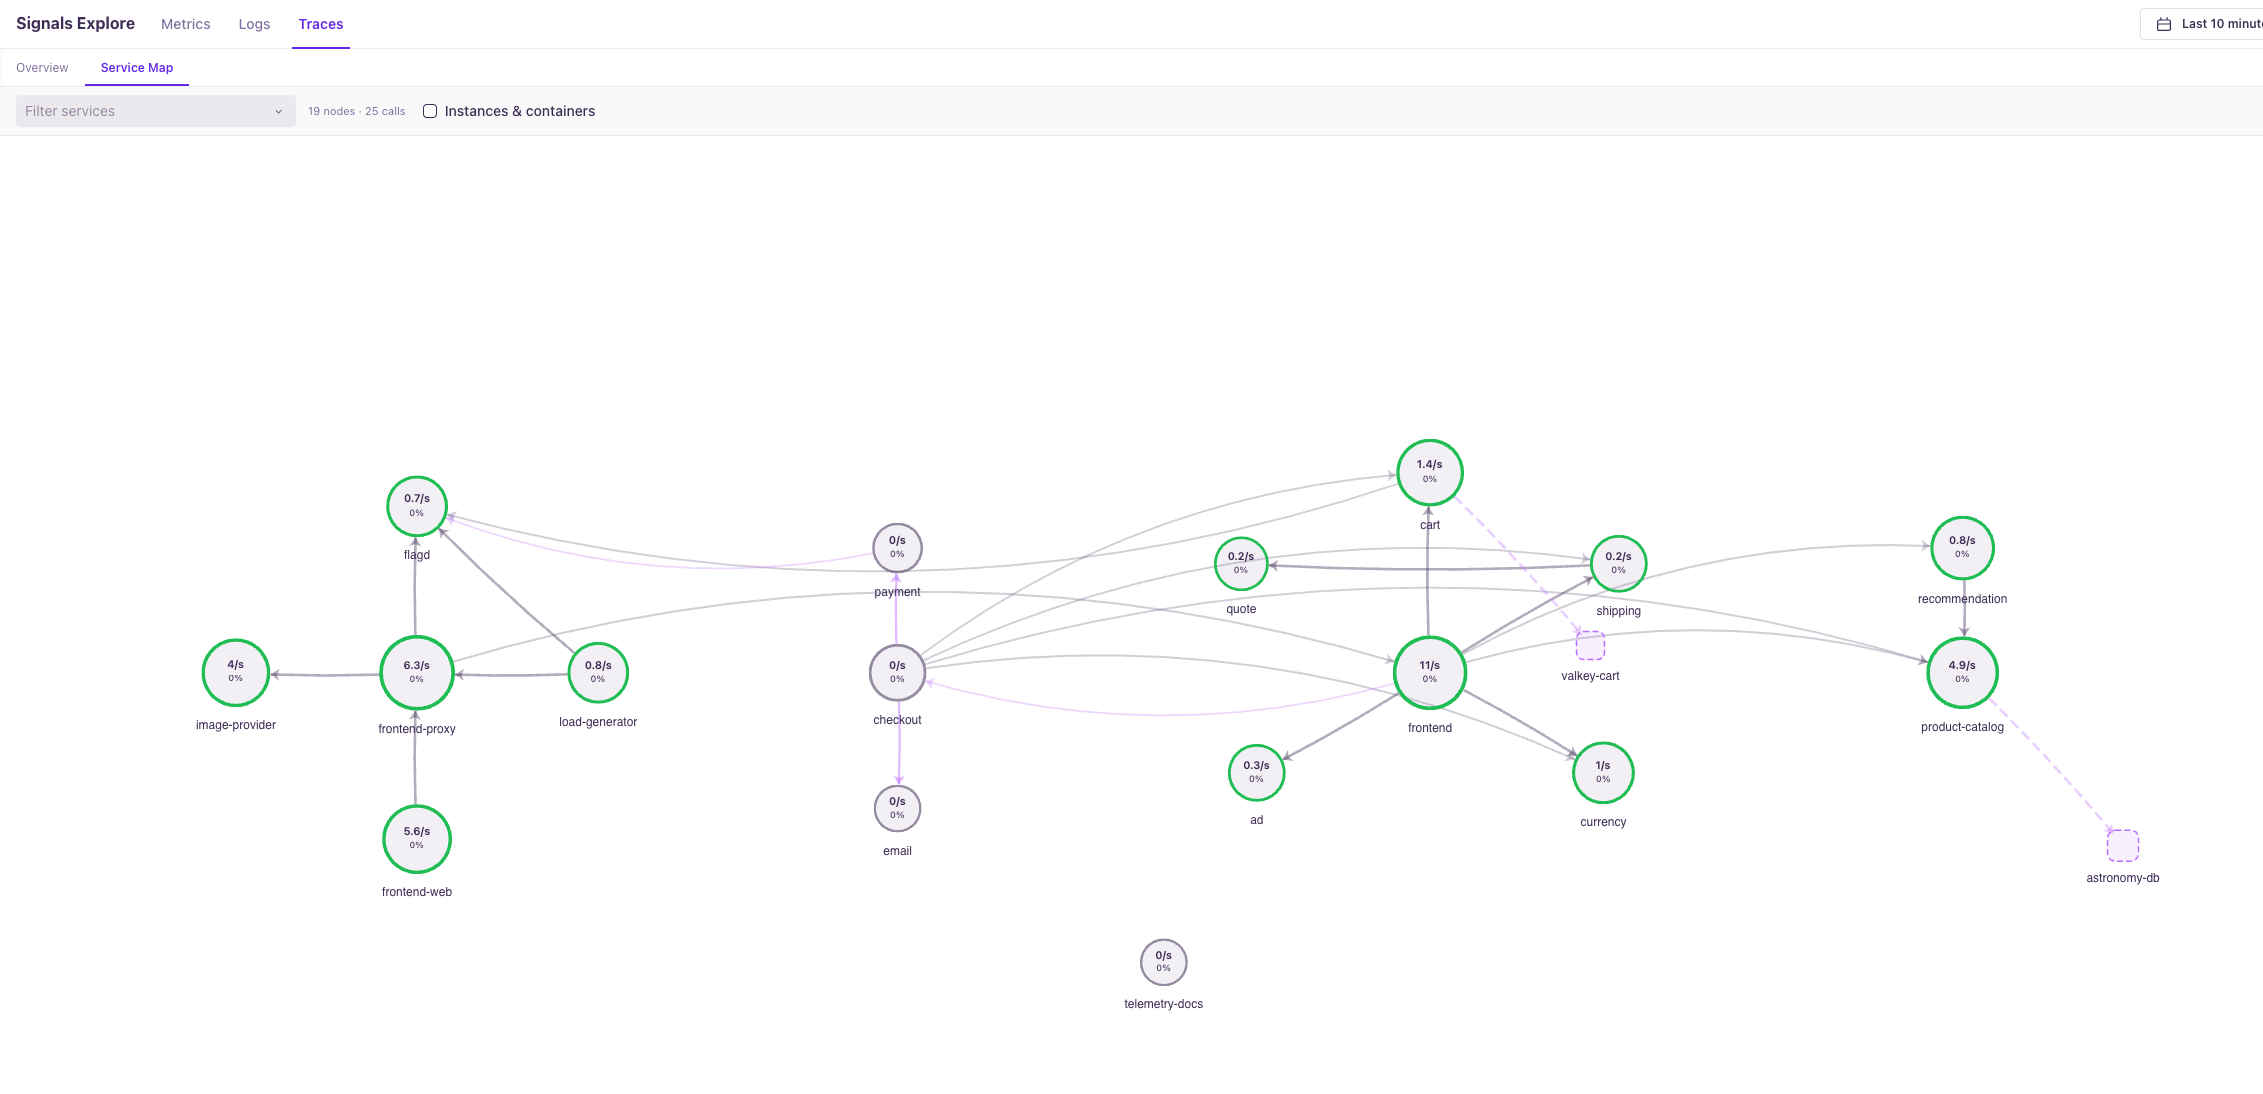
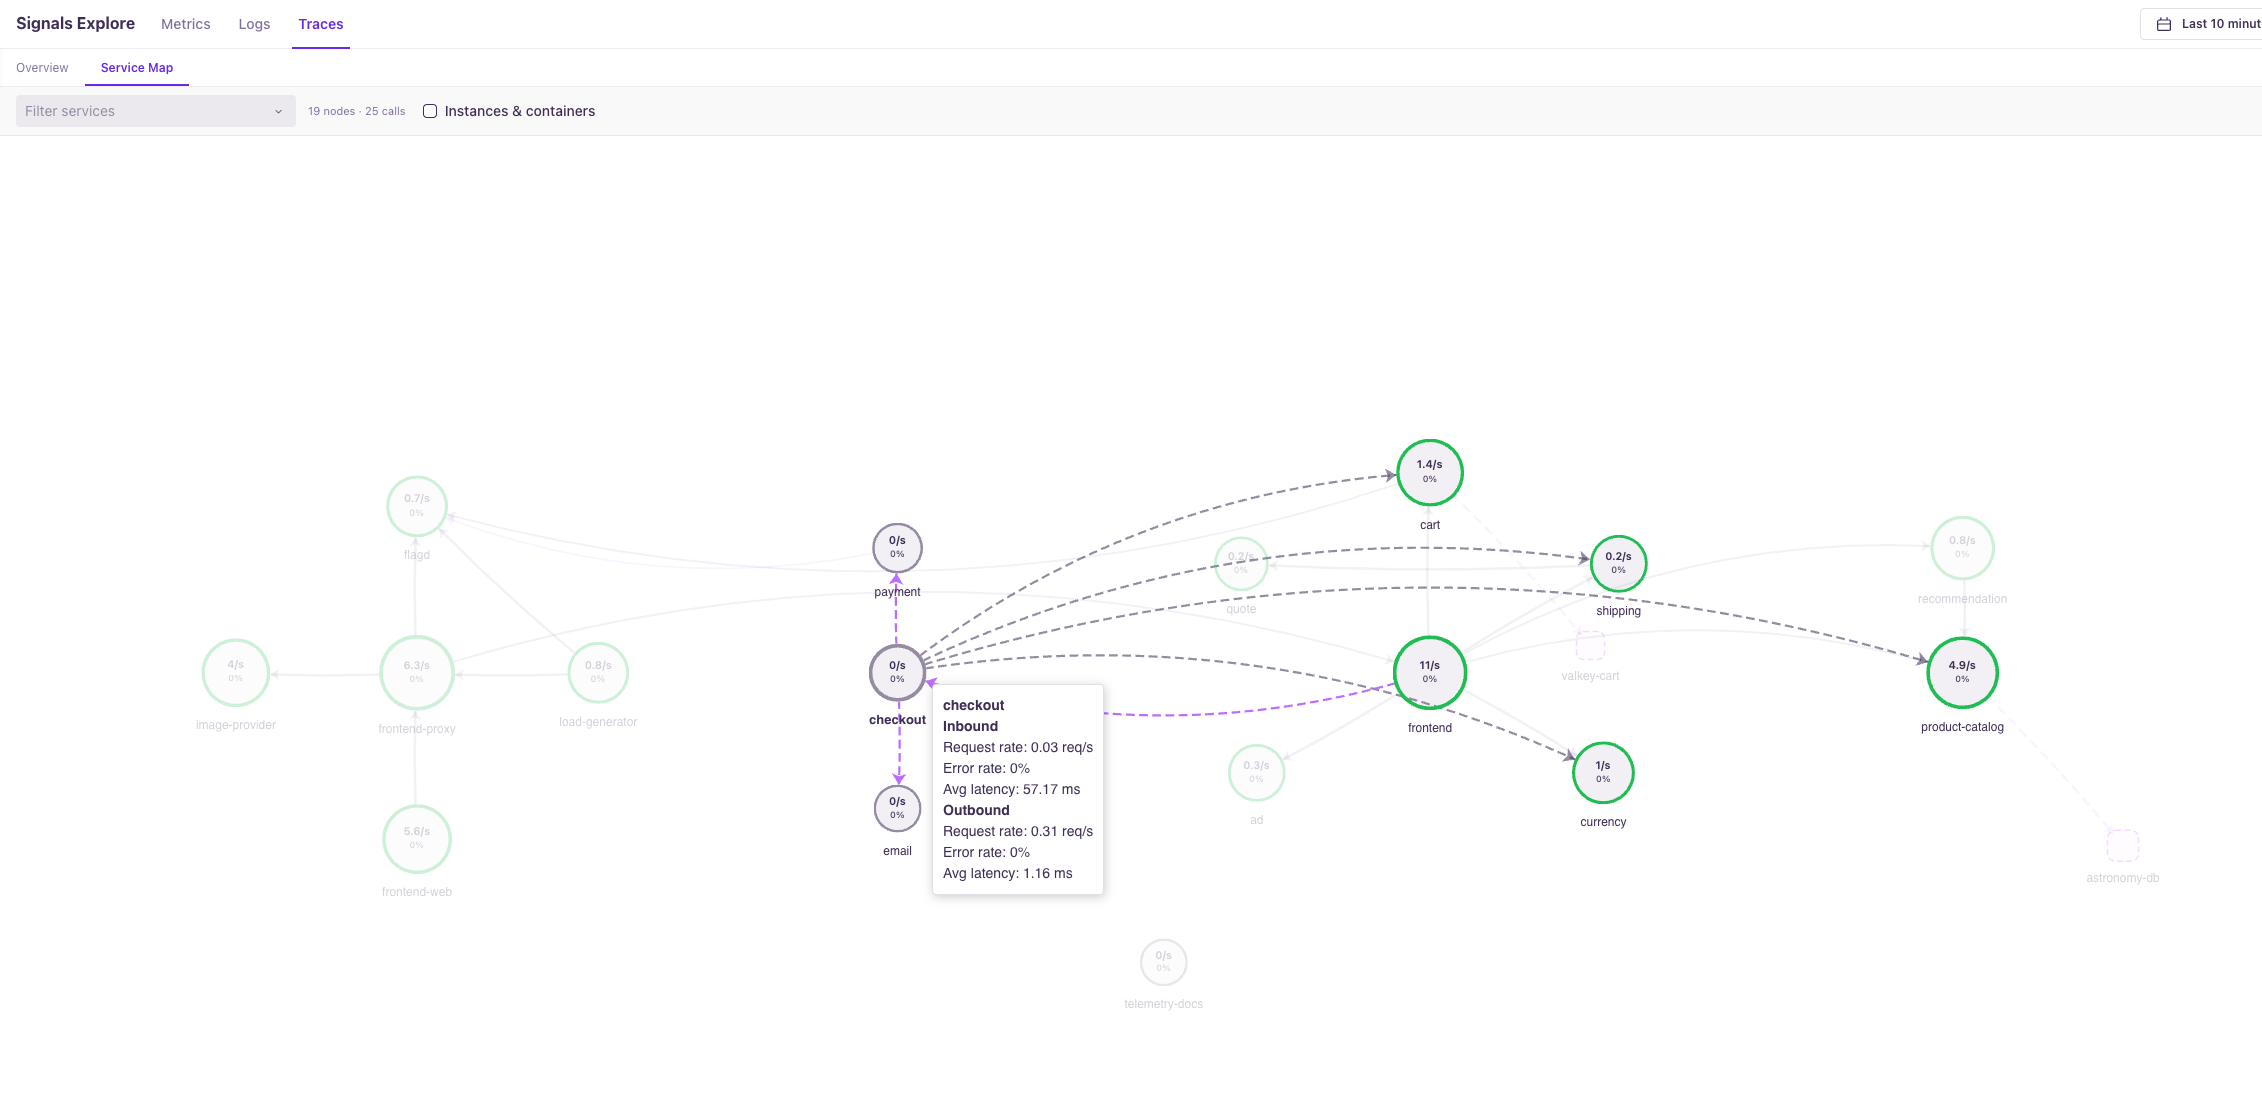
The service map has been merged into the Dashboard main branch and is not yet included in the Dashboard built into v1.3.0[15]; it is expected to ship with v1.3.1.
We measured this layer in the same benchmark too. The graph can answer dependency questions directly: of the 12 dependency-retrieval results, 11 returned fewer rows with fewer calls[4:2]. The effect is concentrated where the graph has edges. In the node-fault cases, the problem is on the node, while the graph currently reaches only services and pods; the next step is to complete the chain from service to pod to node. GreptimeDB v1.3 already connects one segment with zero configuration: kube-state-metrics reports which node each pod runs on, and traces carrying k8s.pod.uid can be correlated to the corresponding pod, as long as each table uses the same identifier value for the same entity[10:3].
What unification costs
Unification does not require compromising on any class of signal, but it has a cost. Specializing per signal means maintaining several physical designs and execution paths inside one database, far more engineering than handling a single signal, and the extra layouts and indexes take storage and background maintenance. Our other choice is to put scalability ahead of single-node performance: distributed execution and decoupled compute and storage expand capacity and throughput, and cross-signal real-time semantic queries come with that. Decoupled compute and storage brings one more benefit: background work like compaction, and the index rebuilding that comes with it, does not have to compete for the same nodes as writes and queries, and can be handed to separate, scalable nodes. This is remote compaction (available in GreptimeDB Enterprise).
Object storage brings a clear cost of its own. Parquet is good at large sequential scans but not at fetching one record by trace_id. A single point read can trigger several rounds of serial HTTP range requests[16]. GreptimeDB reduces this with local caching and hot/cold tiering, but cold point reads are still slower than hot ones. This cost comes from object storage rather than from unification: Tempo also stores traces as Parquet on object storage.
The product boundary still has to hold. An Observability Database sits below an Observability Platform and does not try to take over every layer above it.
For critical alerts we still recommend a local Prometheus. Prometheus emphasizes that each server should be standalone, depending on no network storage and no other remote services, and that principle still holds[17]. A local Prometheus evaluates the rules that page a human, and remote-writes the data to GreptimeDB for long-term retention, cross-signal correlation, dashboards, and both real-time and historical queries. GreptimeDB has alerting of its own as well: Trigger defines the rule in SQL, evaluates it on a fixed interval, and pushes it out in an Alertmanager-compatible format[18], which suits rules a local Prometheus cannot evaluate, such as those across signals or over long time windows.
Visualization stays with Grafana, and with CNCF's Perses[19]. Data collection stays compatible with the OpenTelemetry Collector and the Prometheus ecosystem. We have no reason to invent another dashboard, another agent, or another query language.
These boundaries and costs are part of the definition itself. An observability database cannot just describe what unification makes easier; it also has to state what it gave up in order to unify.
How the name earns its place
"Observability Database" will not bring ready-made search traffic in the short term, and it will not put GreptimeDB in the Magic Quadrant for Observability Platforms. It is first of all a product commitment:
- telemetry semantics must not be lost once they enter the database;
- metrics, logs, traces, wide events, and future signals are logically correlatable, with real-time semantic queries;
- the database should generate the initial physical design and sharding from protocol semantics, then keep optimizing indexes, primary keys, append-only mode, sharding, and scaling against real load;
- SQL and PromQL are executed by the same query engine;
- the database does not cross the product boundary into alerting, visualization, and incident response.
This name will be settled by the people who use it. If platform engineering teams and the people building observability products start calling this layer an observability database, and measuring it against the points above, the category exists.
GreptimeDB has put the name on its homepage first. Next, the product has to turn it into a useful definition.
To check it directly, point an existing OpenTelemetry Collector or Prometheus remote write at GreptimeDB, then run cross-signal queries in SQL and query metrics in both SQL and PromQL. The docs are at docs.greptime.com; what is done, what is not, and the known hard parts of entity relationships are in issue #8609; the full method, raw records, and limitations behind the numbers above are at Agent RCA Bench.
References
GreptimeDB docs: TQL; GreptimeDB RFC: Rewrite PromQL in Rust ↩︎
Same telemetry, different query interfaces: results from 504 agent RCA runs; Agent RCA Bench leaderboard and raw records ↩︎ ↩︎ ↩︎
Grafana Observability Survey 2025; Grafana Observability Survey 2026; Grafana Labs 2026 survey press release ↩︎ ↩︎
GreptimeDB docs: Table semantics; GreptimeDB RFC: Table semantic layer ↩︎ ↩︎ ↩︎
OpenTelemetry semantic conventions v1.42.0 release notes; open-telemetry/semantic-conventions-genai; Semantic conventions 2026 roadmap; OpenTelemetry: Kubernetes attributes processor reaches v1.0.0 ↩︎
GreptimeDB docs: Semantic graph; GreptimeDB docs: Declaring entities and relationships; GreptimeDB issue #8609: Entity relationships and graph query ↩︎ ↩︎ ↩︎ ↩︎
GreptimeDB docs: Design your table schema and the Metric Engine; GreptimeDB RFC: Repartition ↩︎
GreptimeDB Enterprise docs: Auto Repartition; GreptimeDB Enterprise docs: Region Balancer; GreptimeDB docs: Region migration; GreptimeDB docs: Repartition ↩︎
ClickHouse: Are open table formats and lakehouses the future of observability? ↩︎


