
On this page

Summary
August 2026 · 2026-08-01 – 2026-08-31
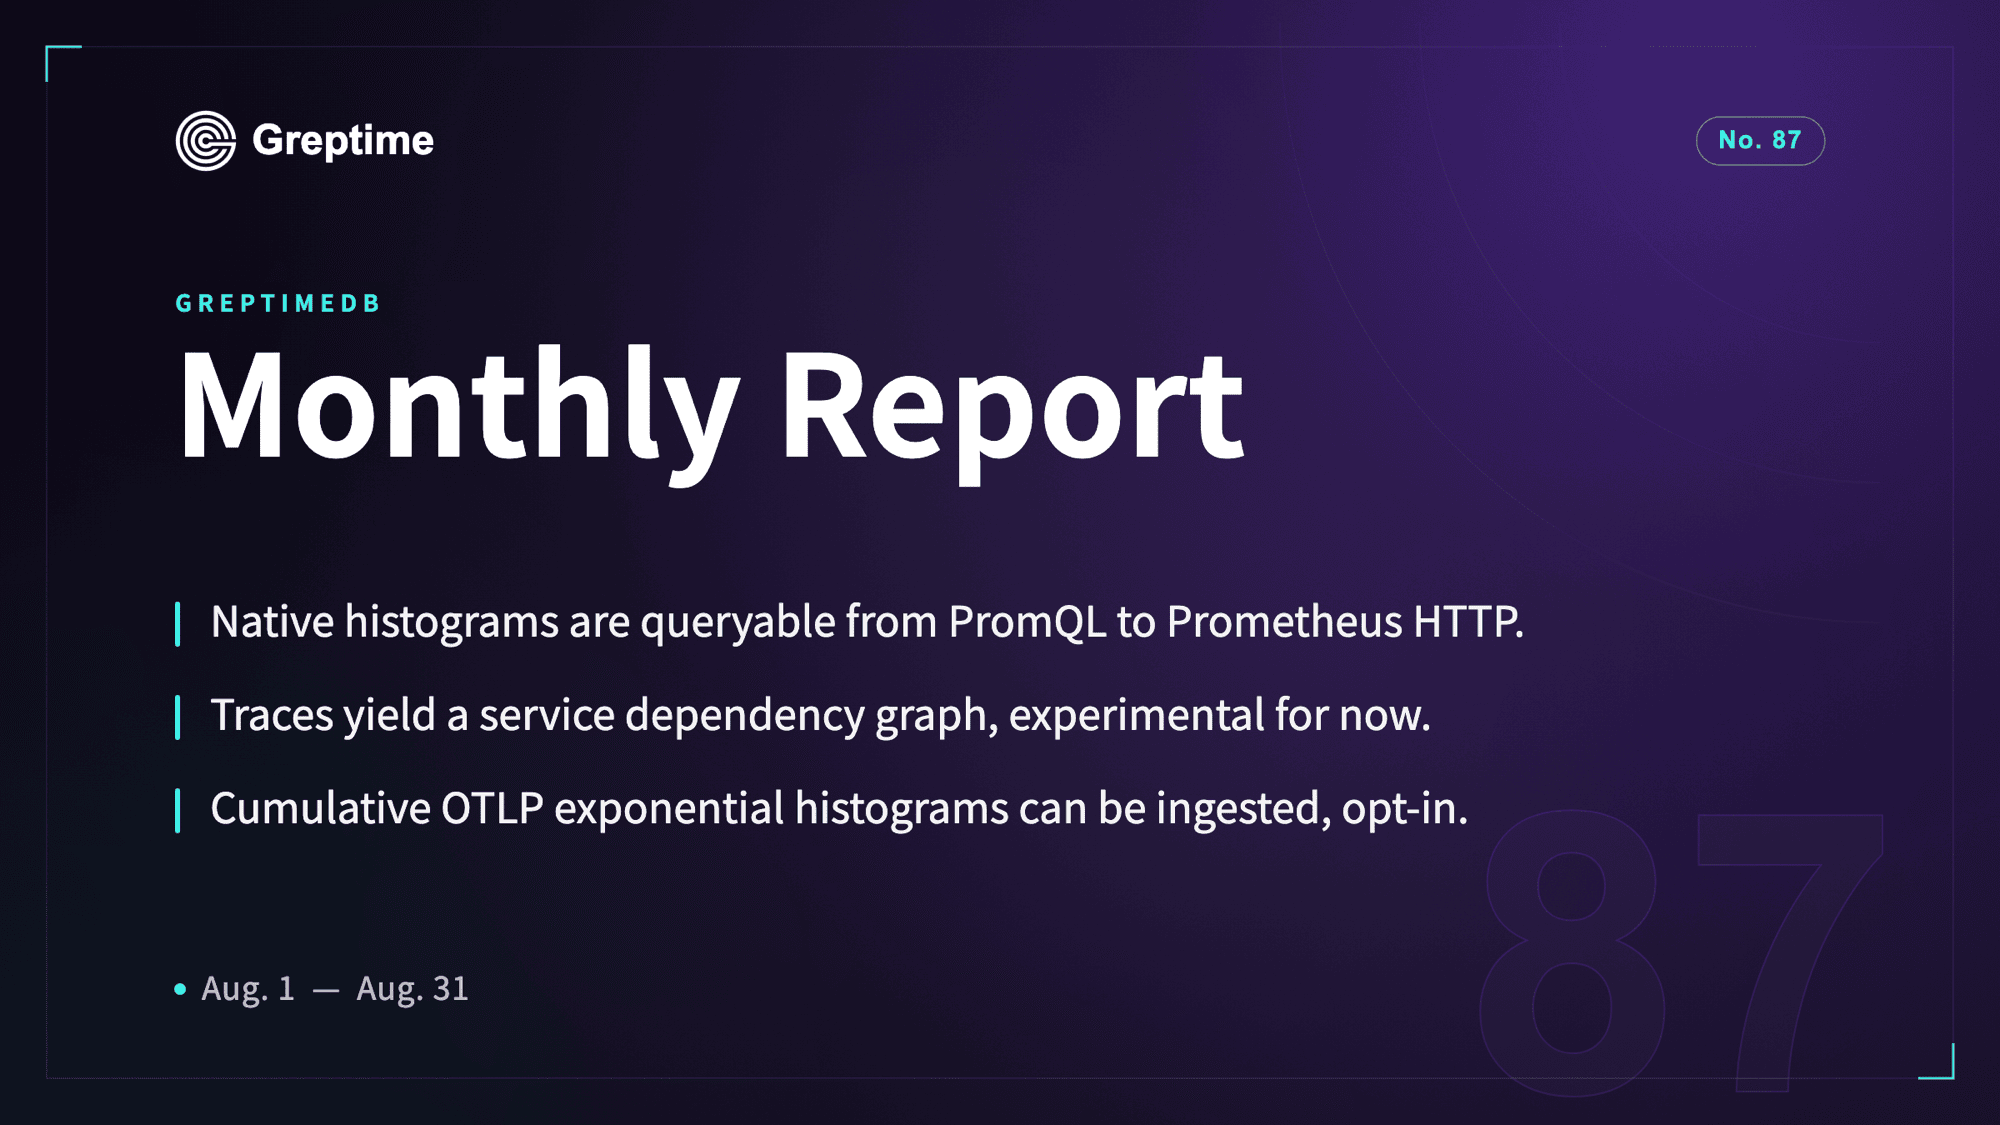
What landed this month:
- Prometheus native histograms are queryable end to end, from PromQL aggregations to Prometheus HTTP responses.
- OTLP traces now yield a service dependency graph you can query with SQL, derived at read time and still experimental.
- Cumulative
OTLPexponential histograms can be ingested with an opt-in option.
GreptimeDB shipped v1.2.0-beta.2 on August 21, the second beta of the v1.2 line: one-way skip_wal changes with ALTER TABLE, JSON2 extension and layout preparation, procedure and admin event observability, and Flow runtime observability. Two breaking changes are worth checking before upgrading. Soft-drop and table recovery are enterprise-only again (db#8747) — beta1 exposed them in OSS because the enterprise gate was missing. An OSS beta2 metasrv rejects gc.experimental_soft_drop.enable = true at startup and cannot recover or purge tables soft-dropped in beta1, so recover what you need first. Persisted native histogram fields also changed signedness (db#8824), with no migration, downgrade, or mixed-version path.
Contributors
Over the past month, 20 contributors merged a total of 166 PRs. Among them, 8 community contributors contributed 10 PRs. Welcome to our new contributors: @xhwhis, @tian1220A, @dhruvxvaishnav, @wy471x, @fzlzjerry, @grezzko!
Thanks to the community contributors who shipped this month:
- @xhwhis db#8722 db#8721
- @lyang24 db#8767 db#8733
- @onepizzateam db#8392
- @dhruvxvaishnav db#8935
- @tian1220A db#8960
- @grezzko db#8659
- @fzlzjerry db#8859
- @wy471x db#8923
Highlights
db#8850 feat(servers): expose native histograms over Prometheus HTTP
Prometheus native histograms are now usable end to end: write them through remote write v2 or OTLP, aggregate them with PromQL, and read them back over the Prometheus HTTP API, including /metadata, label discovery and query annotations. Compared with classic le buckets, you get high-resolution latency distributions without one series per bucket, and the cutover can be gradual: db#8874 evaluates histogram_quantile and histogram_fraction over classic, native and mixed inputs in a single scan.
This closed the six-PR series July's report flagged as in progress: sample-kind semantics (db#8758), ingest validation (db#8775), ranges that mix float and histogram samples (db#8784), vector operators (db#8798), and histogram-aware sum, avg, count, group and count_values (db#8848). If you already store native histograms, two things changed: the persisted fields' signedness (db#8824), and the config location, now under prom_store (db#8744).
db#8614 feat: read-time entity relationships graph over telemetry
Once OTLP traces are in GreptimeDB, the service dependency graph does not have to be built separately. Query greptime_private.semantic_entities and greptime_private.semantic_relationships with SQL to see which service calls which, with RED metrics on every edge. Derivation runs at read time and as the caller: each source table is authorized separately, cancellation and deadlines follow the caller, and the window comes from the observed_at filter in the query, defaulting to the last hour (db#8794). Dependencies that telemetry cannot show can be inserted by hand into greptime_private.semantic_relationships_declared.
It is still experimental: the tables sit in greptime_private, they are not documented, and the output schema may change. Services that only emit metrics need otlp.experimental_enable_resource_info, off by default. The rest of the month expanded what the graph recognizes: more derived edge types and built-in naming conventions for Prometheus, Kubernetes and gen_ai attributes (db#8836, db#8854, db#8880, db#8797, db#8904, db#8936).
db#8900 feat(otlp): support cumulative exponential histograms
If your OTel pipeline emits exponential histograms, you no longer have to convert them to fixed buckets before writing. Turn on otlp.experimental_enable_exponential_histogram, off by default, and cumulative ExponentialHistogram metrics are stored as ordinary native histograms: the same storage format, and no protocol-specific query path.
Cumulative temporality only. Scales -4..=8 map directly and finer resolutions are downscaled to 8; delta temporality, min/max, exemplars and OTel Arrow are not covered yet. Points that cannot be ingested are now reported rather than silently accepted, and a request mixing valid and invalid points returns partial success.
db#8768 feat: add admin function to discard unflushed data
As a last-resort recovery step, you can now discard a region's unflushed in-memory data without losing what is already on disk. ADMIN discard_unflushed_data(...) takes a region ID, or a table name to cover every region of that table, and leaves all persisted SST files in place.
On the engine side (db#8600), the WAL replay frontier is advanced and persisted before the memtables are swapped, so repeated calls are safe and a stale in-flight flush cannot republish discarded rows.
db#8734 feat(event): add event context to procedure events
greptime_private.events now records where a DDL came from. Each submitted procedure event carries a structured EventContext as JSONB that tells SQL, gRPC, Prometheus and OTLP apart, along with automatic schema-evolution paths (auto_create, auto_alter). Whether a table was altered by a person or by ingest is now a SQL query.
With the actor behind each event and admin function executions recorded as well (db#8849, db#8835, db#8856, db#8834), the events table is usable as an audit trail.
Also this month
Authorization: Bearer <token>now works on the/v1/HTTP interfaces. The server treats the token as opaque and leaves validation to theUserProvider, so JWT and OIDC policy stays outside the database (db#8719).information_schema.flow_statisticsandSHOW FLOW STATUSshow how a Flow is actually running; in distributed Flow,start_timeanduptime_secondsare stillNULL(db#8392).- Smaller additions:
uddsketch_rank(db#8929) and mergeablestddev_popstate functions (db#8972),greptime standalone start --daemonon Unix (db#8960), and riscv64 cross-builds with release artifacts (db#8820). - Engine-side work continued: two-phase metric series scans are now on by default for eligible sparse metric regions and fall back to the legacy scan elsewhere, with
experimental_series_scan_v2to turn them off (db#8826, db#8703, db#8788, db#8926); JSON2 gained per-column DDL settings, v2 layout primitives and v2 query support, though v2 is still not the default layout (db#8745, db#8833, db#8895, db#8901, db#8940, db#8964).
Ecosystem Updates
Grafana Plugin
2 releases this month (v3.0.1, v3.0.3).
- Queries run through a Go backend against
/v1/sql, so panel SQL, time macros included, can be used directly in Grafana alert rules. - A Use OTel toggle auto-fills GreptimeDB-style logs and traces columns.
- v3.0.3 fixes authentication.
Existing SQL panels, Query Builder configurations and dashboards keep working. The release post covers the change in full.
Dashboard
4 releases this month (v0.13.14, v0.13.13, v0.13.12, v0.13.11).
- Dashboards can be exported as a full snapshot.
- A command palette makes navigation and actions keyboard-driven.
- Virtual-list tables support column resizing, the compact view uses each column's natural width, and there is a new width option.
- Query results can go full screen.
- Perses is updated to 0.54, and the guided tour is removed.
- Connections no longer break after changing hosts.
Kubernetes Operator
1 release this month (v0.6.1).
- Audit logs are configurable through the CRDs, including frontend groups.
- Service ports can be customized.
- The
ingressCRD field is removed, which is a breaking change.
MCP Server
1 release this month (v0.5.2).
mcpdependency is pinned to>=1.8.0,<2to preventModuleNotFoundErroron fresh installs.
Good First Issues
These two issues are a reasonable size for a first contribution to GreptimeDB. Comment on one to pick it up.
Issue#8951 Metric engine ignores ttl set on a logical table, so the OTLP metrics write hint has no effect
The metric engine accepts a TTL on a logical table and then ignores it, so an OTLP write hint like x-greptime-hints: ttl=180d silently does nothing. Either propagate the TTL to the physical table, or reject it at CREATE TABLE and ALTER TABLE time with a clear error.
Keywords: Table Engine, Write Protocols, SQL
Difficulty: Medium
Issue#8620 Support configuring region engine options through environment variables
region_engine options can only be set in TOML today. The equivalent environment variable, GREPTIMEDB_STANDALONE__REGION_ENGINE__MITO__GLOBAL_WRITE_BUFFER_REJECT_SIZE, fails at startup instead of being applied. Make the region engine list follow the same layered configuration mapping as the rest of the config.
Keywords: Configuration, Standalone, Datanode
Difficulty: Medium
Get Involved
- Docs: https://docs.greptime.com
- GitHub: https://github.com/GreptimeTeam/greptimedb
- X: https://x.com/Greptime
Open an issue for bugs and feature requests, or drop into the community channel.


