
On this page

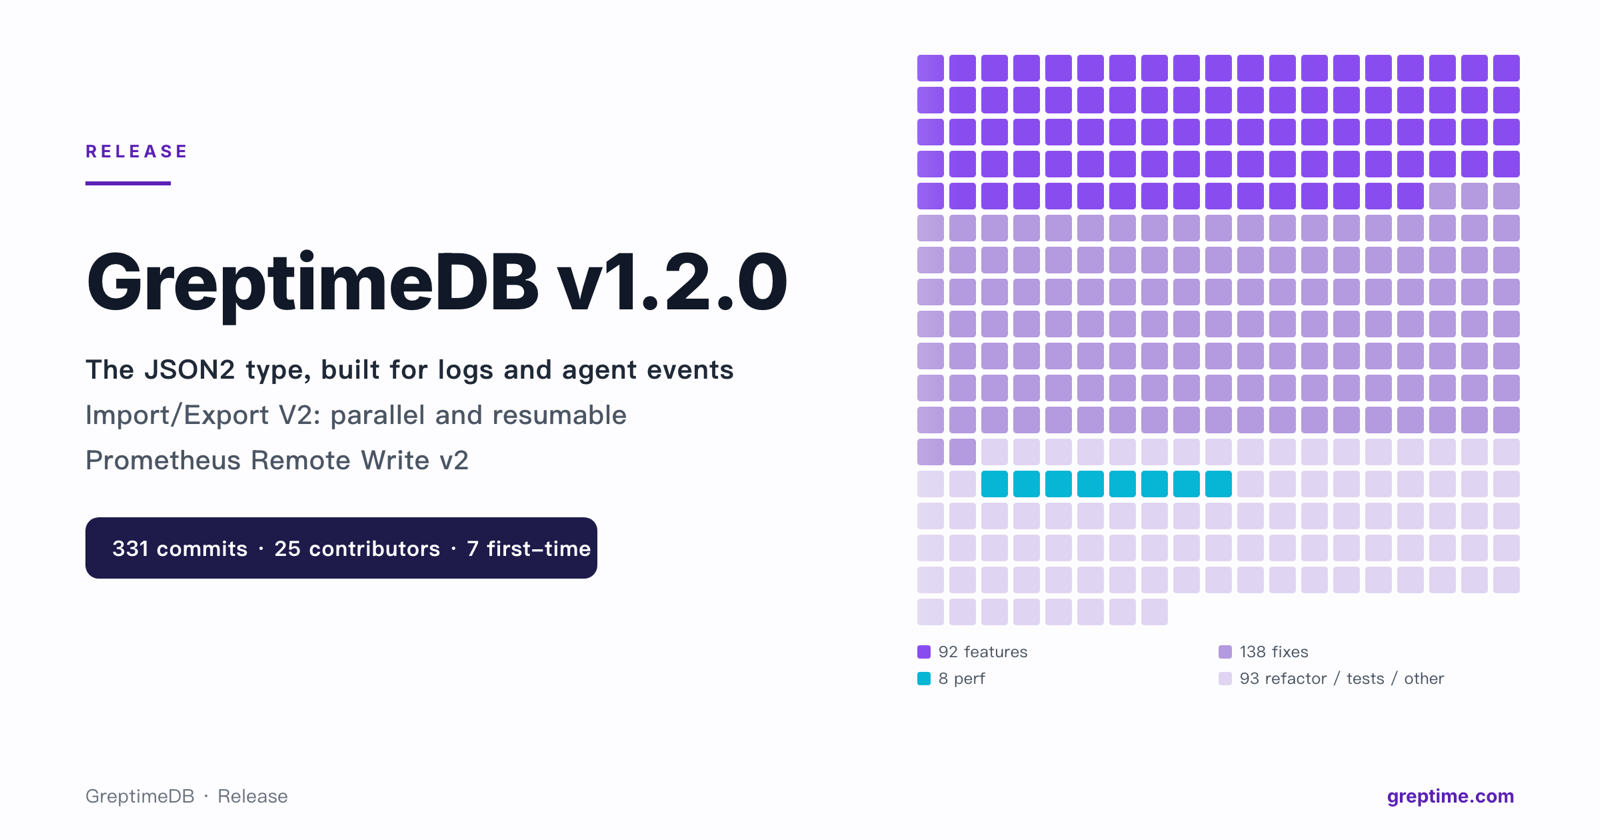
After two beta releases, we released GreptimeDB v1.2.0 on September 8, 2026. It merges 331 commits from 25 contributors since v1.1.0, 7 of whom contributed code to GreptimeDB for the first time. The main changes:
- The JSON2 type gains SQL query support for nested paths, list indexing, and Pipeline conversion
- Import/Export V2 with parallel import and export, progress display, and resumable tasks
- Prometheus Remote Write v2 support for regular metric samples
- Flow runtime status queries, and the built-in Dashboard updated to v0.13.13
Highlights
The JSON2 Type: Structured Storage and SQL Queries
GreptimeDB's original JSON type encodes the whole object as a JSONB binary value. It preserves the full structure and works well for data that is read whole and infrequently, or whose schema is hard to predict. Logs, traces, event streams, and the large volume of events produced by AI applications, agents in particular, are different: their JSON objects are mostly similar in shape, and a query usually touches only a few paths. Because JSONB hides the fields inside a binary value, the query engine has to read the entire value to extract a small part of it, spending storage bandwidth and compute on data it does not need. JSON2 is designed for this kind of data: to the user it is still one complete JSON object; to the storage and query engines it is structured data that can be pruned by path.
v1.2.0 fills out the JSON2 type: SQL path access, function support, list indexing, and handling of empty values and null. Pipelines now recognize JSON2 columns in the target table and convert input data accordingly.
For example, after writing HTTP request information into a log table, you can read the status code and request path directly:
sql
CREATE TABLE application_logs (
    ts TIMESTAMP TIME INDEX,
    attrs JSON2
) WITH (
    'append_mode' = 'true'
);
INSERT INTO application_logs VALUES
    (1, '{"http":{"status":200,"path":"/api/orders"}}');
SELECT
    attrs.http.status::BIGINT AS status,
    json_get(attrs, 'http.path')::STRING AS path
FROM application_logs;
Nested fields are accessed with dot paths, like regular columns. When the path needs to be passed as a parameter, use json_get.
New tables with JSON2 columns require append_mode. v1.2.0 also changes the physical storage layout of JSON2, so if you created JSON2 tables on v1.2.0-beta.1 or v1.2.0-beta.2, read the compatibility notes at the end of this post before upgrading.
We will cover the JSON2 storage format, write path, and query pruning in detail in a separate post.
Import/Export V2: Parallel Migration, Progress Display, and Resumable Tasks
On export, --chunk-parallelism processes data chunks in parallel; on import, --task-parallelism controls task concurrency. If a task is interrupted, keep the export snapshot and the import state file and rerun the same command: completed chunks or tasks are skipped, and the remaining data is processed.
--progress controls progress output. In an interactive terminal it shows a progress bar by default; in other environments it writes log lines.
See the Import/Export V2 documentation for full usage.
Splunk HEC: A New Log Ingestion Path
Collectors compatible with the Splunk HTTP Event Collector (HEC) can now send data directly to GreptimeDB:
- Structured events go to
/v1/splunk/services/collector/event - Raw logs go to
/v1/splunk/services/collector/raw
/events/logs also accepts the x-greptime-pipeline-name header to specify the Pipeline that processes the logs.
Flow: Runtime Status via SQL
After creating a Flow, you can query its runtime statistics with SHOW FLOW STATUS and information_schema.flow_statistics:
sql
SHOW FLOW STATUS LIKE 'my%';
SELECT * FROM information_schema.flow_statistics;
For distributed Flows, start_time and uptime_seconds still return NULL. Keep this in mind if your monitoring depends on these two fields.
Dashboard: Easier to View and Share Query Results
We updated the built-in Dashboard from v0.12.2, shipped with v1.1.0, to v0.13.13. Main changes:
- Dashboard snapshots can be saved
- Result tables support column resizing, cell expansion, and full-screen view
- Trace tables can be selected, and version and build information is shown
- A new command palette, and reconnecting after switching the connection address
See the Dashboard section of the release notes for the full list.
Performance
- We now keep series keys dictionary-encoded, avoiding string expansion overhead. In the PR author's local test of over 200 queries, end-to-end query performance improved by about 24%; actual gains depend on the workload (test record). We also corrected the regex filter semantics for dictionary-encoded columns.
- RangeSelect prunes unused input columns earlier.
- Prometheus remote read result conversion allocates and copies fewer labels.
- The compaction picker now runs asynchronously and no longer blocks the Region worker.
- We optimized the OTLP trace write path.
- We trimmed the Parquet metadata cache to reduce memory usage.
Other Improvements
Ingestion
Prometheus Remote Write v2 for regular samples. Prometheus must be explicitly configured with protobuf_message: io.prometheus.write.v2.Request. This version does not yet store metadata, exemplars, or the created timestamp of regular samples; Pipeline parameters in v2 requests are ignored, and samples are written directly.
Experimental native histogram writes. Disabled by default, and the PromQL query path is not yet fully supported. To test it, enable it in the GreptimeDB HTTP configuration:
toml
[http]
experimental_enable_prometheus_native_histogram = true
If you wrote native histograms with an earlier beta, plan a migration or rewrite before upgrading. See the compatibility notes at the end of this post.
Operations
- Table-level
auto_flush_interval, set at table creation or changed withALTER TABLE SET. - A configurable write buffer limit per Region.
- Manual compaction can target a specified time range.
Protocols and Authentication
The PostgreSQL protocol supports SCRAM authentication.
Notable Fixes
- PromQL query correctness: regular NaN samples are preserved,
ormatching handles missing labels and empty operands correctly, and the tail of a range aligned to the query is kept. - Flow: we fixed runtime statistics aggregation and name references.
- Permission checks: we added database ACL checks, table-level permission checks for query and write protocols, and permission checks for restricted HTTP endpoints.
Compatibility Notes
Review the following seven breaking changes and limitations before upgrading. If you are upgrading from a v1.2 beta, pay particular attention to soft-drop, native histograms, and the JSON2 type.
Local SQL file access is restricted to allowed directories. In standalone deployments, local
COPYand external tables can only access the permitted copy root; in distributed deployments, local paths in these SQL statements are disabled. Existing workflows need to move files, configure a dedicated directory, or switch to object storage. See the migration guide for local SQL file access.holt_wintershas been removed. Update affected PromQL queries and alerting rules to usedouble_exponential_smoothing.The
sparse_primary_key_encodingoption has been removed. Data Regions of the Metric Engine use sparse primary key encoding by default. Old configuration files still load, but this option is ignored and can be deleted when you update the configuration.Pipeline integer conversion checks value ranges. When converting an integer to a narrower type, the system validates the range of the target type, and out-of-range values are handled by the configured
on_failurepolicy. Pipelines that relied on the old wraparound behavior need to adjust their input or failure handling configuration.Soft-drop and recovery are Enterprise Edition features. These operations were available in the OSS build in beta1; from beta2 onward, an OSS metasrv rejects
gc.experimental_soft_drop.enable = true. Before upgrading from beta1, recover any soft-dropped tables you still need. Tables already soft-dropped in beta1 cannot be recovered or purged by the OSS build, and their expired tombstones are not cleaned up; continuing that lifecycle requires the Enterprise Edition.The data format for native histograms from earlier betas has changed. Some persisted fields changed from unsigned to signed integers, and field names were adjusted. Native histograms written with the old schema may be unreadable. There is no migration, downgrade, or mixed-version compatibility layer, so plan a data migration or rewrite before upgrading. This limitation applies only to the experimental native histograms and does not affect regular v1.1 metric tables.
Known limitation for JSON2 tables created on a v1.2 beta. v1.2.0 changed the physical storage layout of JSON2. Non-append tables created on a beta, which use the older
greptime.jsontype, may fail during flush or compaction after upgrading. This is not fixed in v1.2.0.Postpone upgrading the affected tables, or migrate them:
- Logically export the data in a compatible older-version environment, then import it into a newly created v1.2.0 table. Do not copy the old table directory or metadata.
- Keep backups before migrating, and validate the migration with representative data.
- Before switching over, check data integrity and run an actual flush and compaction on the new table.
Setting
append_modealone does not guarantee a fix. In addition, older versions cannot read SSTs written in the new layout, so evaluate your rollback plan before upgrading.
See the v1.2.0 breaking changes for the exact scope and full details.
Get v1.2.0
Installation packages and the full changelog are on the GitHub Release. For upgrade steps, see the upgrade guide. If you run into problems, please report them on GitHub Issues.
By the Numbers
The 331 commits, excluding automated dependency bumps, by type:
- 92 feature enhancements: the JSON2 type, Import/Export V2, Flow status queries, Splunk HEC ingestion, and more
- 138 bug fixes: PromQL query correctness, JSON2 reads and writes, permission checks, storage stability, and more
- 19 refactors: the JSON2 write path, splitting the compaction scheduling module, named permission actions for endpoints, and more
- 8 performance optimizations: dictionary-encoded series keys, the Parquet metadata cache, OTLP trace writes, an asynchronous compaction picker, and more
- 24 test improvements: import/export, version compatibility, query regression, and more
- 3 documentation updates: development guides and architecture constraints for the project and its modules, plus a new RFC for entity relationships and graph queries
- 47 engineering and other improvements: query regression CI, jsonbench, remote WAL fuzz test stability, and more
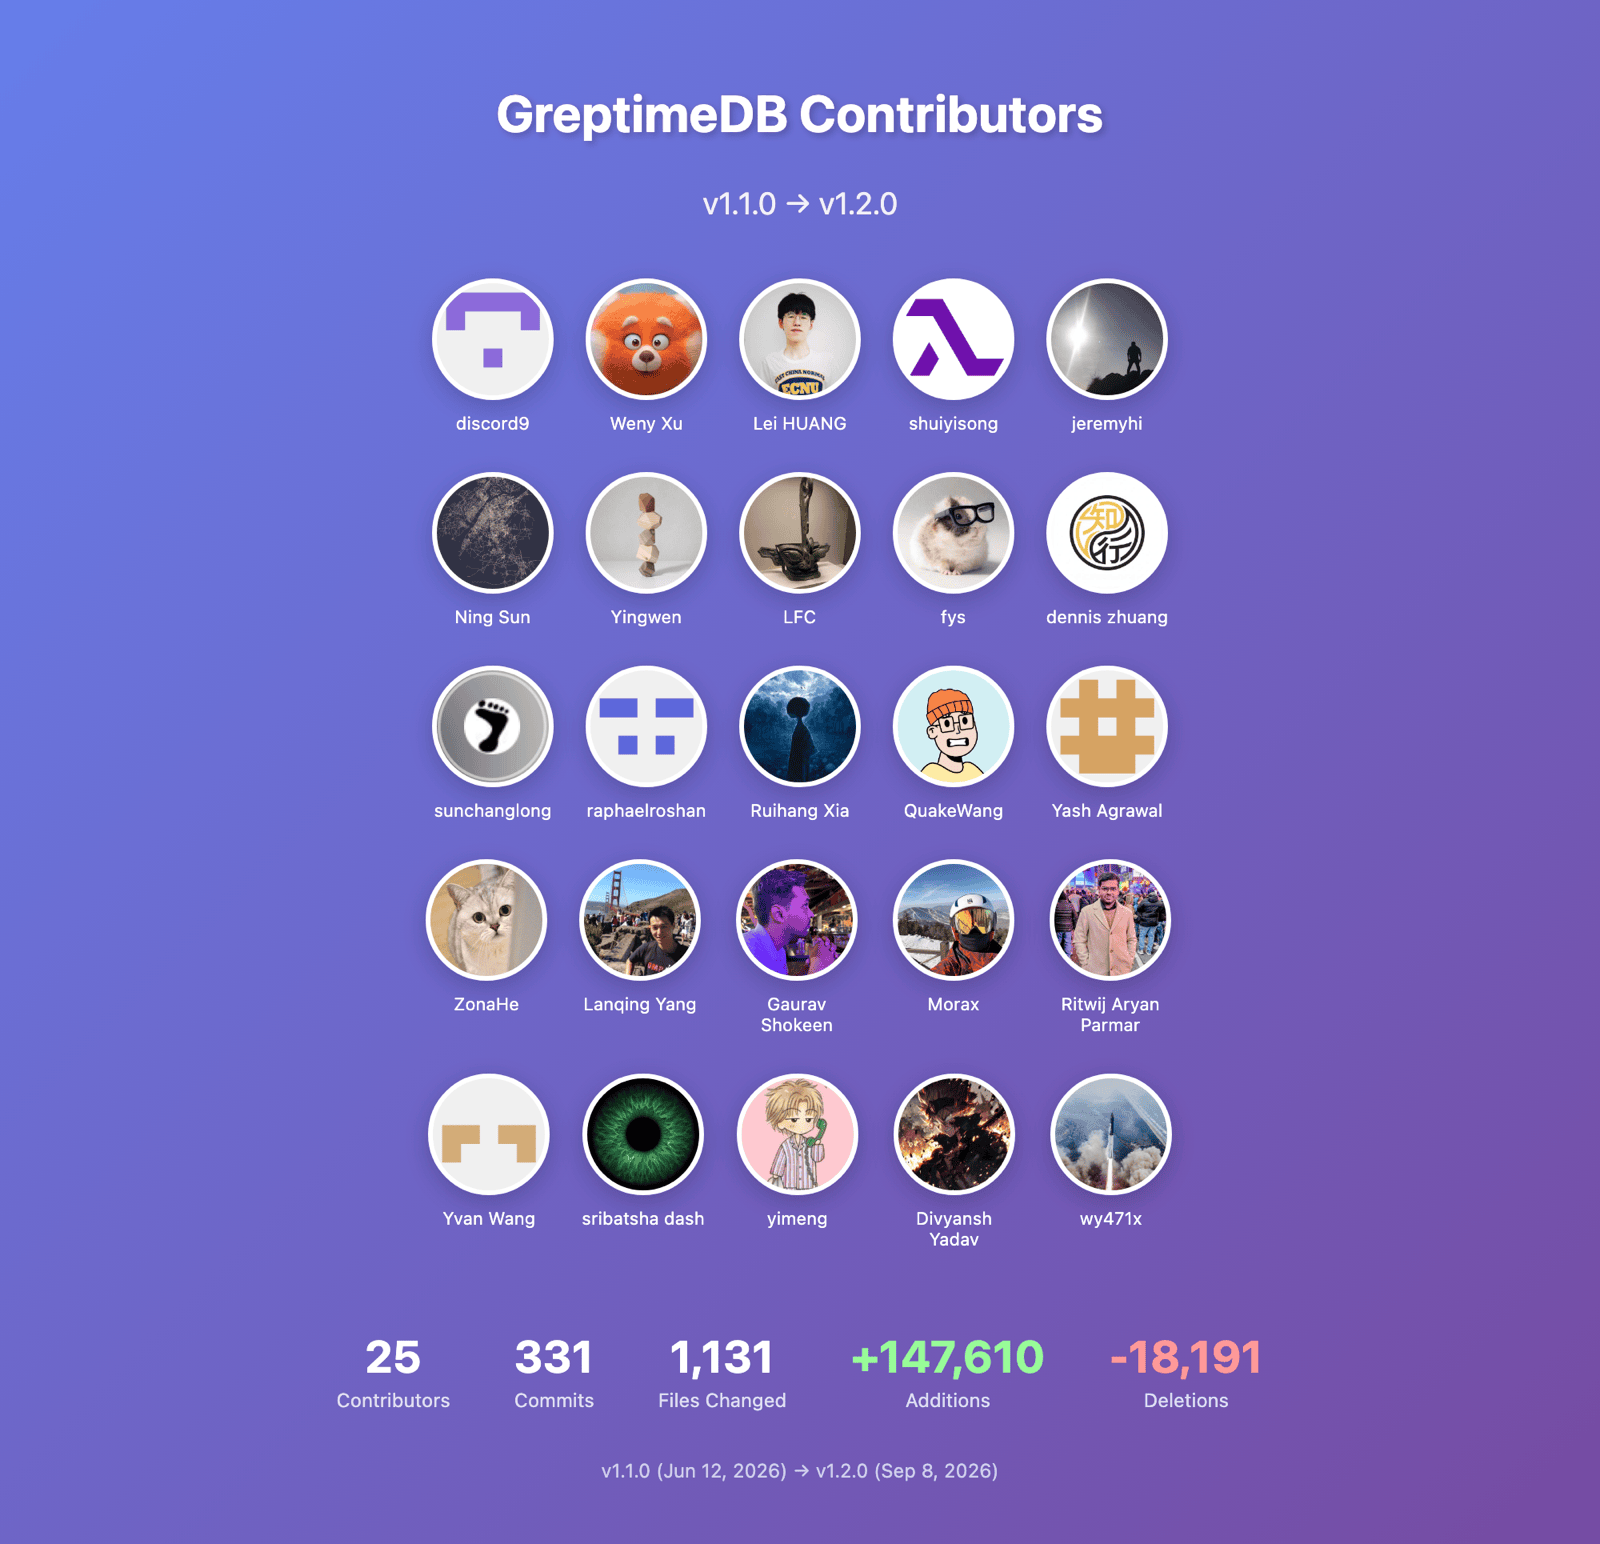
Thanks to the 25 contributors to this release, and welcome to the first-time contributors: @agrawalx, @raphaelroshan, @srivtx, @yimeng, @grezzko, @fzlzjerry, and @wy471x.


