
On this page

We released GreptimeDB v1.3.0 on October 28, 2026. It includes 466 pull requests from 28 contributors, 14 of whom contributed for the first time. The main changes:
- Native histogram ingestion is enabled by default, and PromQL can query their quantiles and the fraction of observations in a value range.
- A new opt-in Trace V2 model (experimental) stores attributes in JSON2. An experimental semantic entity graph lets you query relationships between services, hosts, and containers from metrics and traces.
- Distributed writes retry automatically by default, and TWCS can tune compaction separately for active and inactive time windows.
- The built-in Dashboard is updated to v0.14.2 and adds Signals Explore, a single view for browsing metrics, logs, and traces.
Highlights
Native Histograms On by Default
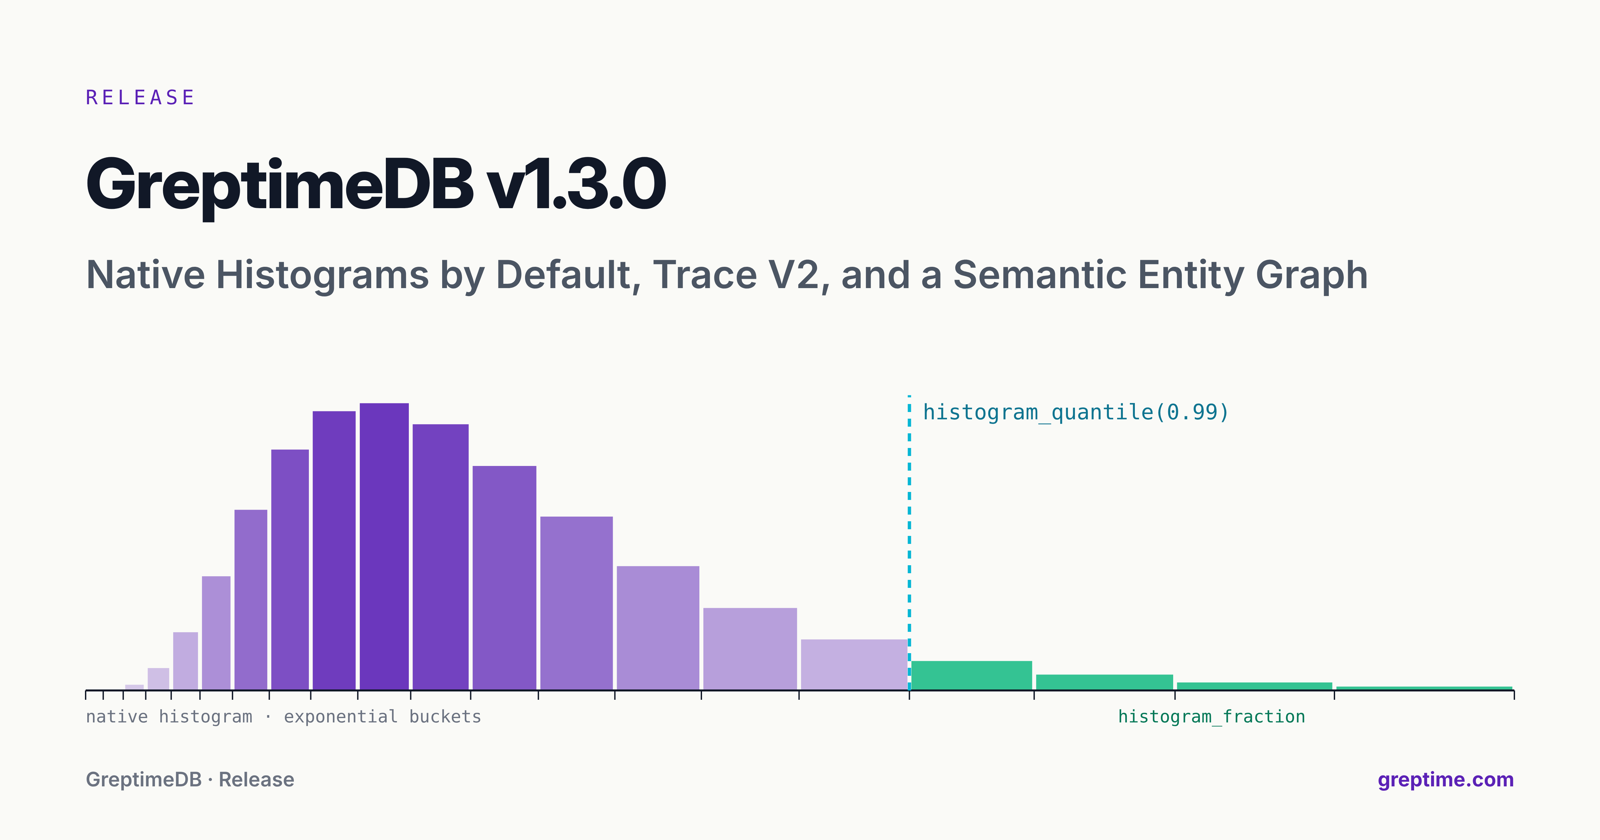
In v1.2.0, native histogram ingestion was experimental and PromQL support for it was incomplete. v1.3.0 accepts Prometheus Remote Write v2 native histograms and cumulative OTLP/HTTP exponential histograms by default. After ingestion, you can aggregate them with PromQL and query quantiles and the fraction of observations in a value range with histogram_quantile and histogram_fraction.
The experimental native histogram switches no longer have any effect: setting them to false does not turn the feature off. Native histograms over Prometheus Remote Write v1, native histogram Remote Read, and OTel Arrow exponential histograms are still unsupported. OTLP exponential histograms must be cumulative; delta is not supported.
Trace V2: Attributes in JSON2
Trace V2 stores span, scope, and resource attributes in three JSON2 columns, so new attributes do not add table columns. The schema has 19 columns, keeps span events and links, and supports Jaeger queries and the semantic entity graph. Trace V2 is opt-in, and trace support as a whole is still experimental.
To use it, set the following headers on OTLP trace ingestion requests and write to a new table, separate from your Trace V1 tables:
text
x-greptime-pipeline-name: greptime_trace_v2
x-greptime-trace-table-name: traces_v2
You can then read typed attributes directly:
sql
SELECT
    trace_id,
    span_attributes."http.status_code"::BIGINT AS http_status,
    resource_attributes."service.name"::STRING AS service_name
FROM traces_v2;
If an attribute name contains dots, wrap the whole name in double quotes, for example "http.status_code". Existing Trace V1 tables are not migrated automatically. In this release, events and links are still stored as JSON arrays. See the trace ingestion and query docs for configuration.
Semantic Entity Graph (Experimental)
The semantic entity graph has built-in OpenTelemetry, Prometheus, and Kubernetes semantic conventions. At query time, it derives entities such as services, hosts, containers, and Kubernetes objects, along with their relationships, from metrics and traces that follow these conventions. You can also add entity information through table-level semantic declarations. The following system tables are queryable with SQL (see semantic graph for columns and query patterns):
greptime_private.semantic_entities: entitiesgreptime_private.semantic_relationships: relationships between entitiesinformation_schema.table_semantics: the semantics each table provides
For example, to list entities seen in the last 15 minutes:
sql
SELECT DISTINCT entity_type, entity_id
FROM greptime_private.semantic_entities
WHERE observed_at >= now() - INTERVAL '15' MINUTE
ORDER BY entity_type, entity_id;
Table-level semantic options can be changed with ALTER TABLE ... SET/UNSET. GreptimeDB MCP Server v0.6.0 and later provides two tools, query_semantic_graph and search_table_semantics, that let AI agents query entity relationships and find tables by concept. The semantic entity graph is experimental, and future releases may change its table schemas and derivation rules.
PromQL Semantics and Compatibility
v1.3.0 fixes the @ modifier, subqueries with unaligned timestamps, group_left / group_right matching on aggregated results, and some false positives in label_replace. Ambiguous many-to-many matches and duplicate result series now return an error. NaN ratio comparisons are also fixed and no longer fire false alerts.
We ran promql-compat against Prometheus v3.15.0, comparing labels and values:
| Test suite | v1.2.1 | v1.3.0 |
|---|---|---|
| Prometheus test corpus (852 cases) | 6.7% | 88.5% |
| PromQL compliance tester (539 cases) | 88.7% | 94.8% |
| Fuzz queries (1,999 queries, seed 1) | 79.0% | 93.4% |
The table does not compare __name__. Prometheus drops the metric name after some operations, while GreptimeDB keeps __name__ in the result (for example, sum(x > 0)); values and other labels match. This has little effect on dashboards or threshold-based alerts, but check it if you rely on __name__ for legends or grouping. With __name__ included, v1.3.0 passes 53.5%, 54.2%, and 63.8% of the three suites.
These rates exclude 1,391 corpus cases and 1 fuzz query that involve native histograms, experimental features, start timestamps, delayed metric name removal, and nondeterministic results. See PromQL compatibility results for the full scope, and known differences in v1.3.0 for the remaining differences.
Dashboard: Signals Explore
The built-in Dashboard is updated to v0.14.2. Signals Explore puts metrics, logs, and traces in one exploration view, with label filters and navigation between logs and traces. Native histograms and gauge histograms are not charted yet.
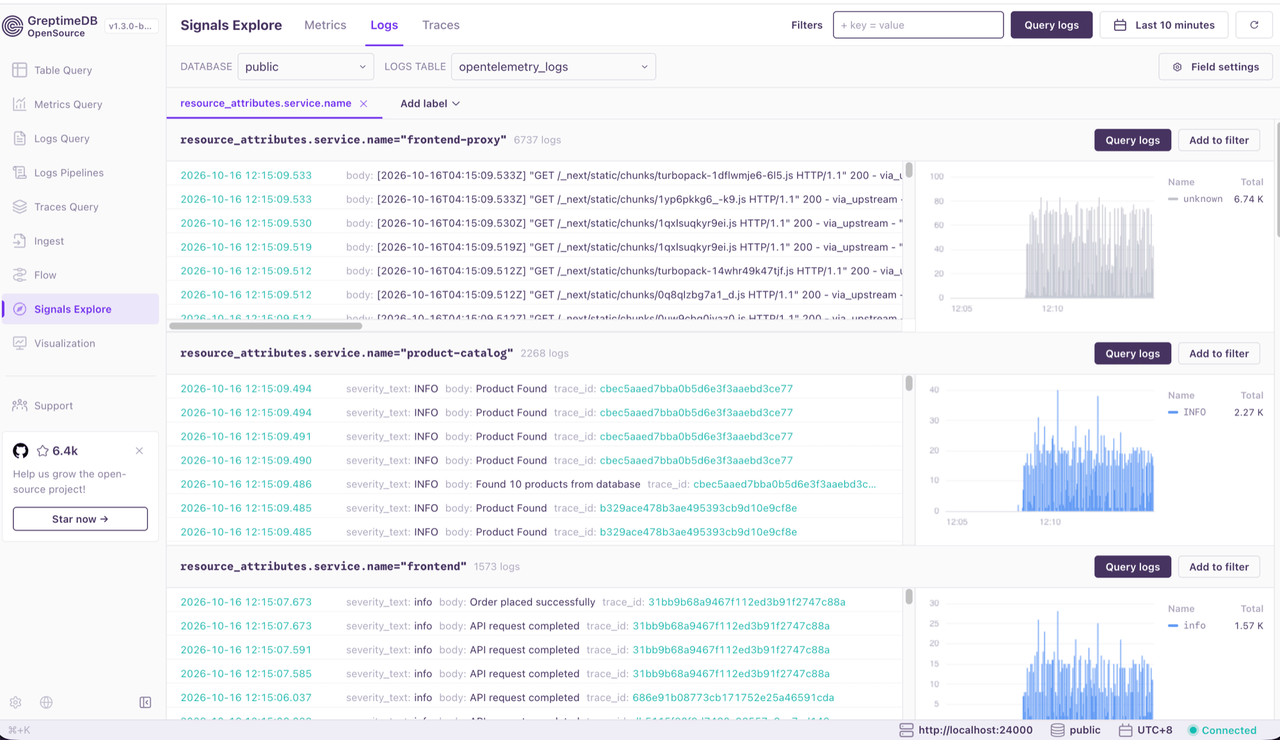
The time zone setting now applies to both result display and SQL requests. When set to Browser, the Dashboard uses the browser's IANA time zone. This release also fixes log scrolling, loading states, and trace ID queries, and lets you show or hide null fields per JSON result column.
Performance
We compared query performance of v1.3.0 and v1.2.1 on the same hardware and data. Median latency, with a warm cache:
| Workload | Data | v1.3.0 median latency vs. v1.2.1 |
|---|---|---|
| PromQL range queries | 30 days, 1,720 series, 158.5M samples, 30-minute step | 9.9%–41.8% lower for 4 of 5 queries |
| Agent observability SQL | 100M records | 6.3%–32.8% lower for all 16 queries |
| Trace queries | ~100.1M spans | 6.0%–94.0% lower for 6 of 8 queries |
The PromQL and agent SQL tests ran on AWS c7i.2xlarge (8 vCPUs, 16 GiB memory), and the trace tests on m7i.2xlarge (8 vCPUs, 32 GiB memory). These are single-run diagnostic results. Trace latencies include client-side processing, and the largest reduction in the table does not represent overall trace performance. See benchmark results for details.
This release also removes repeated scans in PromQL sliding-window evaluation and per-window allocations in simple range functions, and optimizes dictionary-encoded primary key sorting and the storage scan path.
Other Improvements
OTLP Delta Metrics
OTLP delta sums and explicit histograms can keep the delta value of each collection interval. For float series with the otlp_aggregation_temporality="delta" label, rate() and increase() follow delta semantics. Delta exponential histograms are still unsupported.
Automatic Retries for Distributed Writes
When the Frontend hits a transient distributed write error, it retries up to 3 additional times by default and refreshes routes after Region migration or partition changes. If a response explicitly reports a partial failure, only the failed entries are retried; entries already acknowledged are not resent.
toml
[write_retry]
max_retries = 3
initial_backoff = "1500ms"
max_backoff = "10s"
backoff_multiplier = 2.0
Set max_retries = 0 to disable retries. These settings apply only to the distributed Frontend. If an entire RPC fails, the write outcome can still be unknown, so automatic retries do not provide exactly-once ingestion.
TWCS: Separate Settings for Active and Inactive Windows
TWCS rewrites less data under continuous ingestion. You can now set the file count threshold and L1 merge threshold separately for active and inactive time windows. compaction.twcs.trigger_file_num remains an alias for the active window setting; inactive windows have their own thresholds. See TWCS parameters.
The Mito Engine's default auto flush interval drops from 30 minutes to 10 minutes. Explicit global and table-level settings are unaffected.
Protocol Authentication
The HTTP, MySQL, and PostgreSQL protocols support Bearer token authentication. The authentication provider must implement token validation and resolve the user identity. Providers can also select the MySQL authentication method per user.
Notable Fixes
- SQL and PromQL result correctness: fixed missing rows, ordering,
IGNORE NULLS, folded histogram operations, and ordering on logical metric tables. - Full-text index: the bloom index no longer misses matches for text with underscores or mixed Han and ASCII text. Eligible case-sensitive
LIKEqueries can also use the index for pruning. - Storage and recovery: bulk merges keep the newer write; on a graceful Region close, writes that skipped the WAL are flushed; when the manifest save result is unknown, flush and compaction keep SSTs that may already be referenced instead of deleting them.
Upgrade Notes
You can upgrade directly from v1.2 to v1.3. Back up your data and configuration first, and validate representative queries, writes, and alerting rules on the target version. Check the following eight changes before upgrading.
Upgrade order for distributed clusters. Enable Metasrv maintenance mode before the rolling upgrade starts, keep it on throughout, and turn it off only after all components are upgraded and healthy. This keeps Batch GC from running while old and new versions are mixed. Upgrade all Datanodes first, then Frontends; roll back Frontends first, then Datanodes. A new Frontend talking to an old Datanode may replay writes that already succeeded, producing duplicate rows in append-only tables.
Scan memory limit.
region_engine.mito.scan_memory_limitnow defaults to 25% of the memory baseline: the cgroup memory limit if one is set, otherwise host memory.scan_memory_modedefaults tobasic, which counts Parquet row group decoding memory;extendedalso counts streaming batches. Because the accounting has changed, review any explicit limits you set earlier. The oldscan_memory_on_exhaustedvalueswaitandwait(<duration>)now fail immediately; change them tofailand check your application's error handling. Before upgrading, load-test representative queries at expected concurrency and reviewquery.memory_pool_size. Settingscan_memory_limit = "unlimited"disables only the scan memory limit.Host access from VRL Pipelines. Access to host resources such as environment variables, files, the network, and the local time zone is restricted by default, and existing Pipelines are checked again when reloaded. Remove restricted calls before upgrading. If you need them and trust every Pipeline author, set
pipeline.allow_vrl_host_access = trueon each Frontend or standalone node and restart. UsePOST /v1/pipelines/_dryrunto validate Pipelines under the target configuration.OTLP labels and alerting rules. When
service.namespaceis non-empty, the metricjoblabel becomes<namespace>/<service.name>. Existing data is not relabeled, so queries spanning the upgrade may need to match both values. Delta metrics use the reserved labelotlp_aggregation_temporality="delta"; tables with a fixed schema need a nullable tag column for it.PromQL and SQL clients. PromQL subqueries without a step now use a fixed 1-minute step; write
[range:step]explicitly if you need a different interval.median,approx_median, andapprox_percentile_conton integer input now return floating-point results, so check column types in views and Flow sink tables. Timestamp text over the MySQL protocol is truncated to microseconds; storage precision is unchanged. Cast to a string or integer explicitly if you need nanoseconds.Index and configuration migration. Legacy full-text bloom indexes are skipped. Rebuild them through compaction or
ADMIN BUILD_INDEXto restore pruning; table data stays readable. Remove the obsolete native histogram switches. Moveprom_validation_modeunder[prom_store]with its current value; in the old location it is ignored and falls back to the default,strict.JSON2 and aggregation state. JSON2 type hints no longer accept
nullableordefault; missing fields return NULL. JSON2 still does not support bulk insert.uddsketch_stateanduddsketch_mergeproduce a new binary format: v1.3 reads the old state, but v1.2.1 cannot read the new one. If you may roll back, keep the state data from before the upgrade.Flow mirror writes. The pending budget is 1 million rows, counted separately for copies sent to different Flownodes. Over budget, a regular table write may succeed while its Flow mirror batch is dropped; instant-TTL writes are rejected before reaching the Datanode. Monitor
greptime_table_operator_mirror_pending_rowsandgreptime_operator_dist_mirror_dropped_rows, and split oversized batches.
See the v1.3 upgrade guide for maintenance mode steps and other compatibility notes, and the full upgrade notes in the release.
Get v1.3.0
Installation packages and the full changelog are on the GitHub Release. If you run into problems, please report them on GitHub Issues.
By the Numbers
The 466 pull requests by type:
- 9 breaking changes: moving the native histogram settings and
prom_validation_modeunder[prom_store], restricting VRL host access by default, counting SST decoding against the scan memory limit, and more - 142 feature enhancements: native histogram ingestion and queries, Trace V2 (experimental), automatic retries for distributed writes, and more
- 169 bug fixes: SQL and PromQL query correctness, full-text index matching, storage and recovery, and more
- 23 refactors: moving the query regression tool to Rust, splitting the PromQL planner module, JSON2 Parquet projection and schema alignment, and more
- 48 performance optimizations: PromQL sliding-window evaluation, dictionary-encoded primary key sorting, storage scans and index reads, and more
- 12 test improvements: end-to-end tests for writes that skip the WAL, Flow asynchronous mirror write tests, PromQL
label_replaceregressions, and more - 11 documentation updates: README and cross-signal SQL examples, a Rust code style guide, an RFC for faster metric import and export, and more
- 51 engineering and dependency improvements: automatic backport PRs, version comparison and diagnostics in benchmarks, Rust toolchain and build dependency updates, and more
- 1 revert
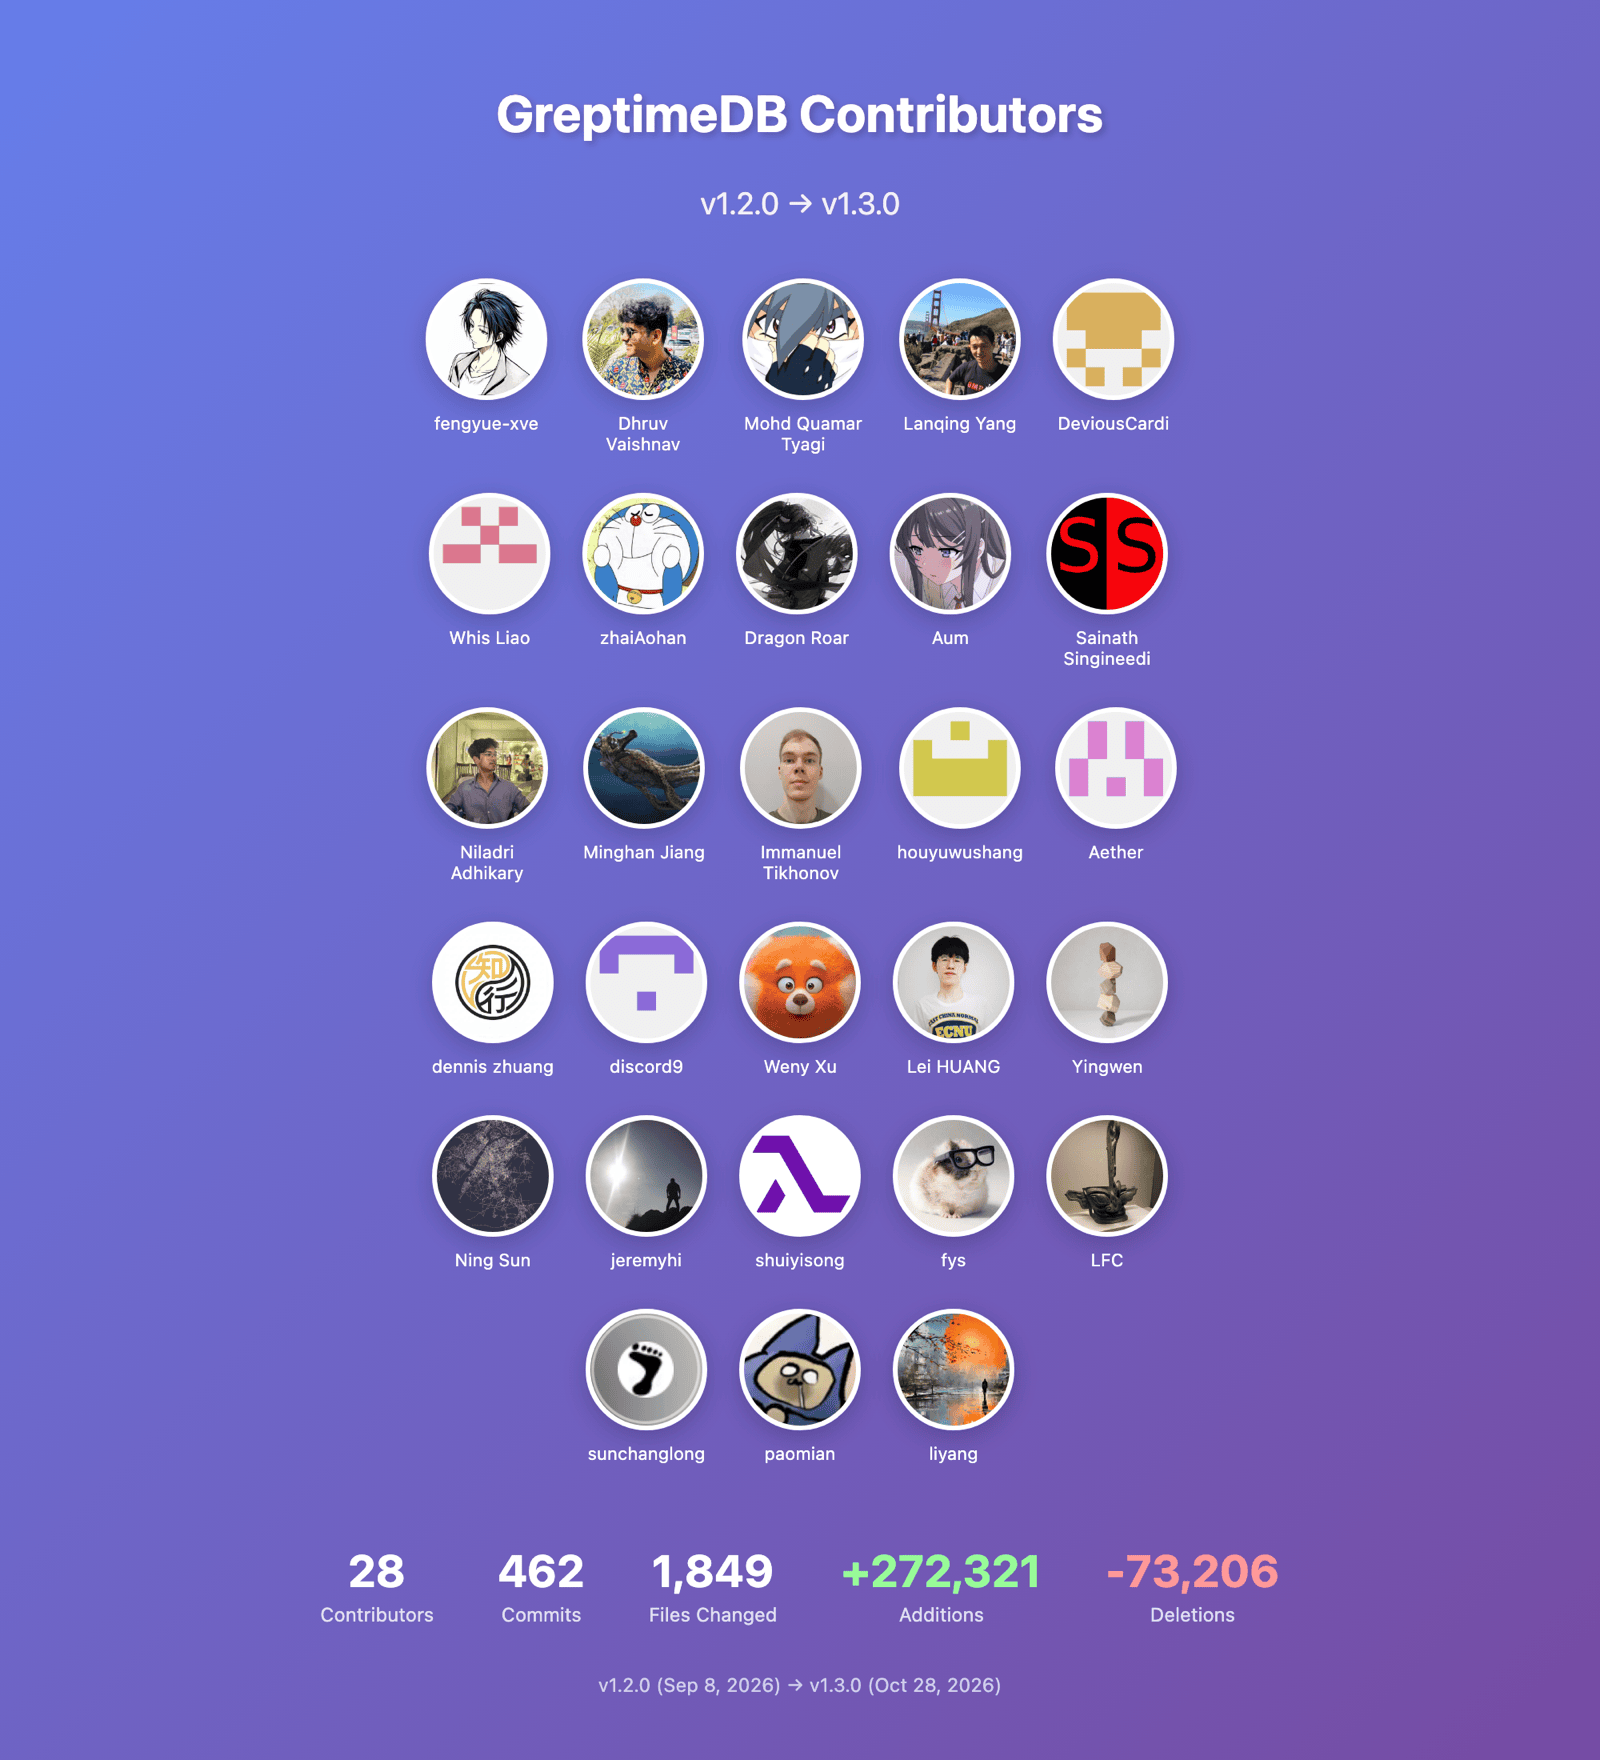
Thanks to all 28 contributors to this release. See the full contributor list in the release notes.


