
On this page

GreptimeDB stores and queries observability data, including logs, over long retention periods. For a detailed comparison with Grafana Loki, see the GreptimeDB log-scenario performance report. For this migration running at production scale, see OceanBase Cloud's journey from Loki to GreptimeDB, which now holds 300 TB of logs across 80+ clusters.
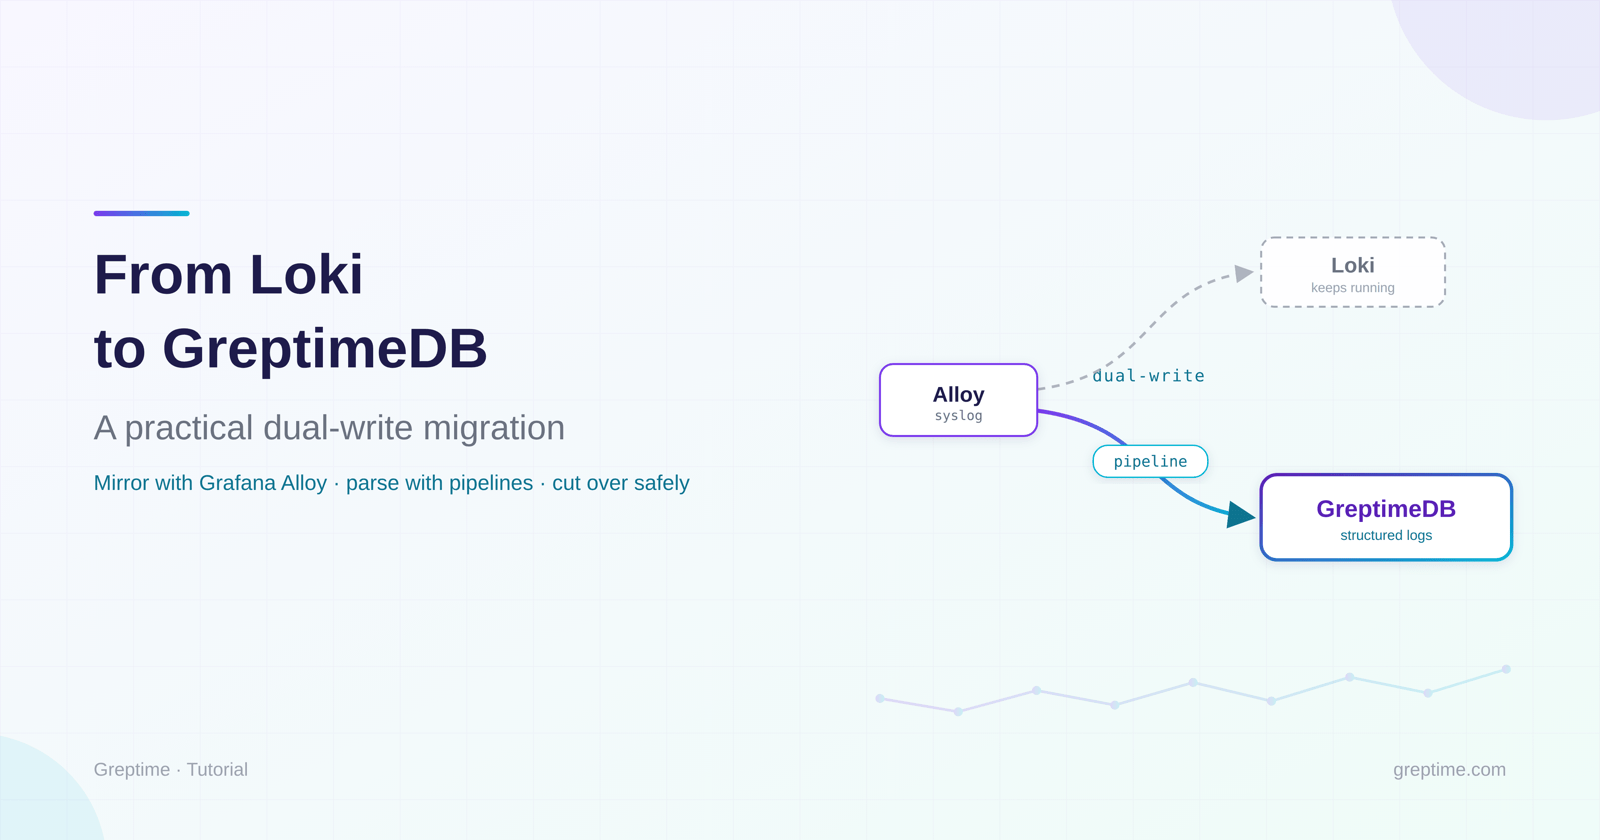
It also provides a Loki-compatible push endpoint, so an existing Loki writer can send new logs to GreptimeDB with only a small configuration change. In this tutorial, we will:
- Run a Docker Compose scenario that sends simulated syslog messages to Loki.
- Configure Grafana Alloy to write each log to both Loki and GreptimeDB.
- Add a GreptimeDB pipeline that parses each message into structured fields.
- Query the structured logs in the built-in GreptimeDB Dashboard.
This walkthrough covers dual-writing and cutting over new log ingestion. It does not copy data already stored in Loki. To migrate historical logs, replay them from the original sources, archives, or exported records. See the official migration guide for a complete migration plan.
Prerequisites
You need Docker and Docker Compose. Make sure ports 514, 3000, 3100, 4000, 12345, 51893, and 51898 are available on the host.
1. Start the Loki scenario
We'll start from the Grafana Alloy syslog scenario:
bash
git clone https://github.com/grafana/alloy-scenarios.git
cd alloy-scenarios/syslog
docker compose up -d
When all services are running, open Grafana Explore at http://localhost:3000/explore, select the Loki data source, and run this LogQL query:
text
{component="loki.source.syslog"}The simulator sends a new message every three to eight seconds, so logs should appear within a few seconds.
To stop the scenario, run:
bash
docker compose down2. Mirror logs to GreptimeDB
First, add a GreptimeDB standalone service to docker-compose.yml:
yaml
greptimedb:
  image: greptime/greptimedb:${GREPTIMEDB_VERSION:-v1.1.2}
  ports:
    - "4000:4000"
  command:
    - standalone
    - start
    - --http-addr
    - 0.0.0.0:4000
The scenario uses GreptimeDB v1.1.2 by default. Set GREPTIMEDB_VERSION to override it. Port 4000 exposes the HTTP API and the built-in Dashboard.
Next, update config.alloy so the syslog source forwards each entry to two loki.write receivers:
text
livedebugging {
  enabled = true
}

loki.source.syslog "local" {
  listener {
    address = "0.0.0.0:51893"
    labels  = { component = "loki.source.syslog", protocol = "tcp" }
  }

  listener {
    address  = "0.0.0.0:51898"
    protocol = "udp"
    labels   = { component = "loki.source.syslog", protocol = "udp" }
  }

  forward_to = [
    loki.write.local.receiver,
    loki.write.greptimedb.receiver,
  ]
}

loki.write "local" {
  endpoint {
    url = "http://loki:3100/loki/api/v1/push"
  }
}

loki.write "greptimedb" {
  endpoint {
    url = "http://greptimedb:4000/v1/loki/api/v1/push"
    headers = {
      "X-Greptime-DB-Name"        = "public",
      "X-Greptime-Log-Table-Name" = "loki_syslog_raw",
      "X-Greptime-Pipeline-Name"  = "greptime_identity",
    }
  }
}
The existing local receiver continues writing to Loki, while the new greptimedb receiver sends the same entries to GreptimeDB's Loki push endpoint.
The headers select the public database, the loki_syslog_raw table, and the built-in greptime_identity pipeline. For a Loki push request, GreptimeDB gives the pipeline an input object containing the original timestamp as greptime_timestamp, the raw line as loki_line, and each stream label as loki_label_<name>. The identity pipeline infers a schema from those fields and writes them without parsing the raw line.
Start the updated stack:
bash
docker compose up -dOpen http://localhost:4000/dashboard, select Logs Query, then choose the public database and loki_syslog_raw table. The logs now exist in both Loki and GreptimeDB, but the message body is still stored as an unstructured loki_line value. In the next step, we will make fields such as the log level directly searchable.
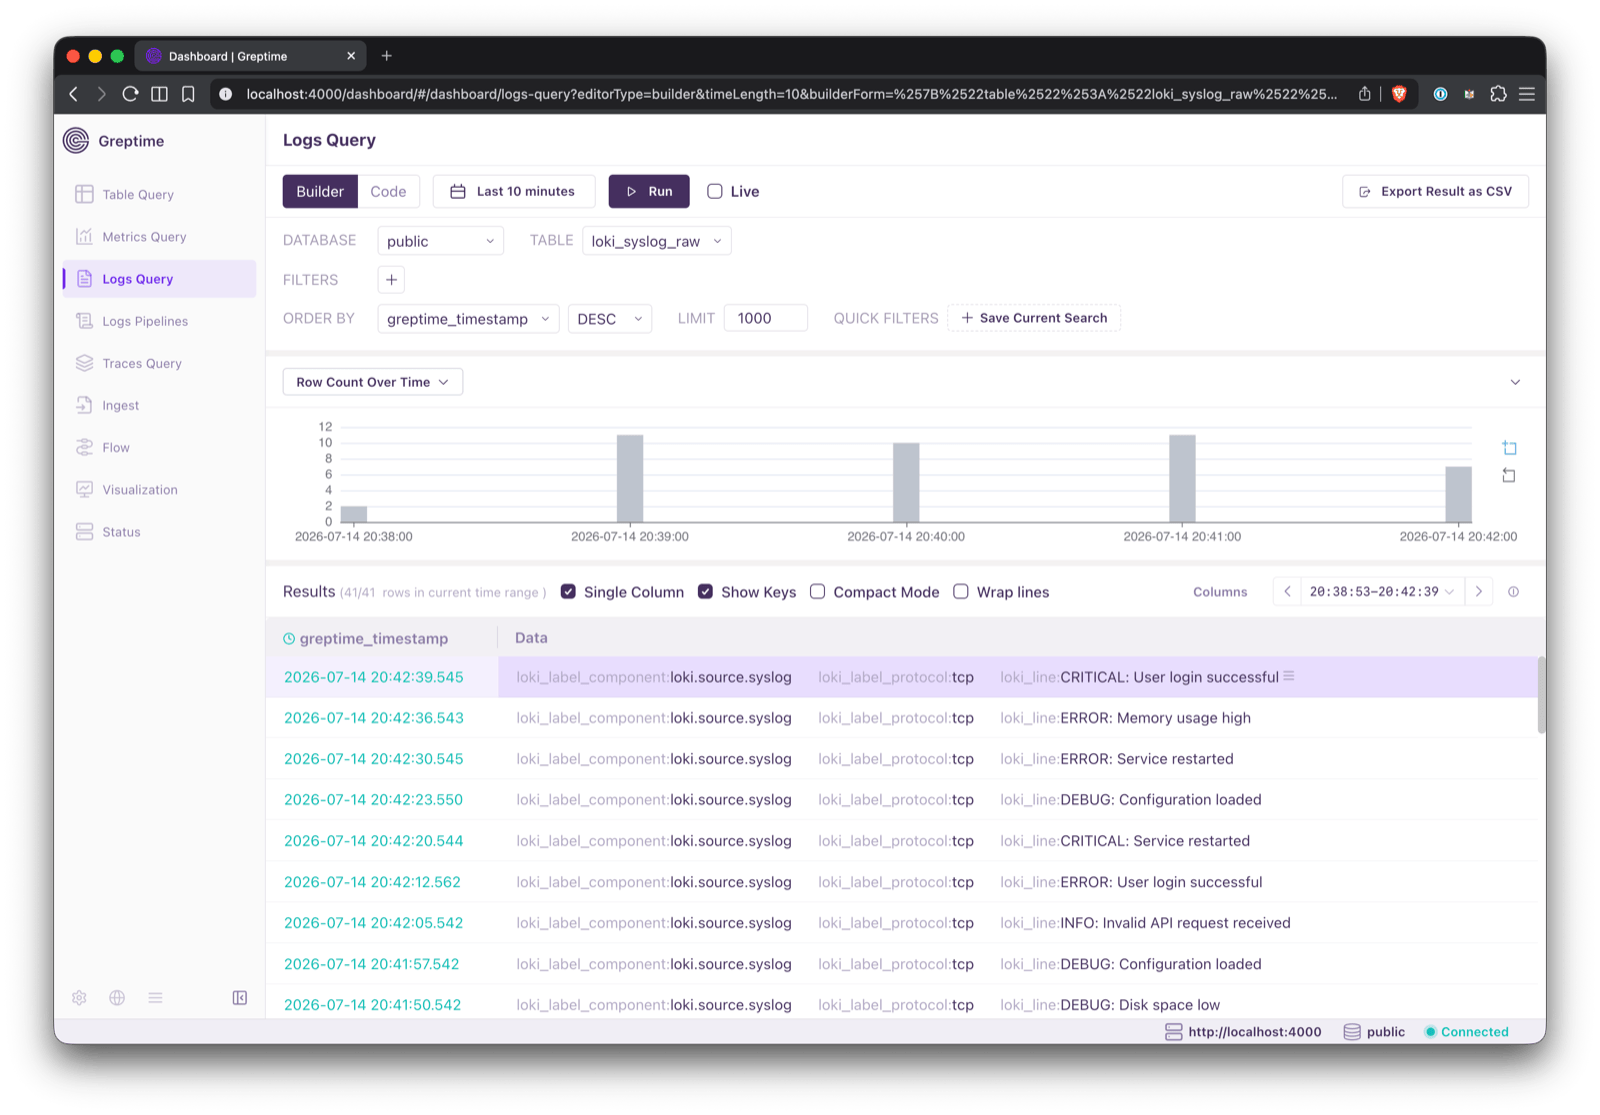
Logs Query showing the loki_syslog_raw table
3. Parse the syslog message with a pipeline
The simulator emits messages in this form:
text
CRITICAL: Configuration loadedCreate syslog_pipeline.yaml with the following pipeline definition:
yaml
version: 2
processors:
  - regex:
      fields:
        - loki_line, log
      patterns:
        - '^\s*(?<level>[A-Z]+):\s*(?<message>.*)$'
      ignore_missing: true

transform:
  - field: greptime_timestamp
    type: time
    index: timestamp
  - field: log_level
    type: string
    index: inverted
    tag: true
  - field: log_message
    type: string
    index: fulltext
  - fields:
      - loki_label_component
      - loki_label_protocol
    type: string
    index: inverted
    tag: true
This pipeline does four things:
version: 2applies the explicit transforms and then persists the remaining fields in the pipeline context. The originalloki_linetherefore remains available.- The
regexprocessor readsloki_lineand useslogas the output prefix. Its named capture groups becomelog_levelandlog_message. greptime_timestamppreserves the timestamp from the original Loki entry as the table's required time index.- The pipeline adds inverted indexes to fields used for equality filters and a full-text index to
log_messagefor text search.
The important columns are:
| Column | Source | Storage and index role |
|---|---|---|
greptime_timestamp | Loki entry timestamp | Time index |
log_level | level regex capture | String tag with an inverted index |
log_message | message regex capture | String field with a full-text index |
loki_label_component | Alloy stream label | String tag with an inverted index |
loki_label_protocol | Alloy stream label | String tag with an inverted index |
4. Upload the pipeline before Alloy starts
Add a one-shot greptimedb-pipeline service that uploads the YAML file, and make Alloy wait for that service to finish successfully. The complete docker-compose.yml is:
yaml
services:
  rsyslog:
    image: rsyslog/syslog_appliance_alpine:latest@sha256:c0dd7cad9ff3234967ff59879590175b7590e8a5f5621ec49a85aff546b44a3b
    container_name: rsyslog
    ports:
      - "514:514/udp"
      - "514:514/tcp"
    volumes:
      - ./rsyslog.conf:/etc/rsyslog.conf
    depends_on:
      - alloy

  syslog-simulator:
    image: python:${PYTHON_VERSION:-3.11-slim}
    container_name: syslog-simulator
    volumes:
      - ./syslog_simulator.py:/syslog_simulator.py
    environment:
      - SYSLOG_HOST=rsyslog
      - SYSLOG_PORT=514
    depends_on:
      - rsyslog
    command: ["python3", "/syslog_simulator.py"]

  alloy:
    image: grafana/alloy:${GRAFANA_ALLOY_VERSION:-v1.17.1}
    ports:
      - "12345:12345"
      - "51893:51893"
      - "51898:51898"
    volumes:
      - ./config.alloy:/etc/alloy/config.alloy
      - ./logs:/tmp/app-logs/
    command: run --server.http.listen-addr=0.0.0.0:12345 --stability.level=experimental --storage.path=/var/lib/alloy/data /etc/alloy/config.alloy
    depends_on:
      loki:
        condition: service_started
      greptimedb-pipeline:
        condition: service_completed_successfully

  loki:
    image: grafana/loki:${GRAFANA_LOKI_VERSION:-3.7.3}
    ports:
      - "3100:3100"
    volumes:
      - ./loki-config.yaml:/etc/loki/local-config.yaml
    command: -config.file=/etc/loki/local-config.yaml

  greptimedb:
    image: greptime/greptimedb:${GREPTIMEDB_VERSION:-v1.1.2}
    ports:
      - "4000:4000"
    command:
      - standalone
      - start
      - --http-addr
      - 0.0.0.0:4000

  greptimedb-pipeline:
    image: curlimages/curl:${CURL_VERSION:-8.21.0}
    volumes:
      - ./syslog_pipeline.yaml:/syslog_pipeline.yaml
    depends_on:
      - greptimedb
    command:
      - --fail
      - --silent
      - --show-error
      - --retry
      - "60"
      - --retry-delay
      - "1"
      - --retry-all-errors
      - -X
      - POST
      - http://greptimedb:4000/v1/pipelines/syslog_logs
      - -F
      - file=@/syslog_pipeline.yaml

  grafana:
    image: grafana/grafana:${GRAFANA_VERSION:-13.1.0}
    environment:
      - GF_AUTH_ANONYMOUS_ORG_ROLE=Admin
      - GF_AUTH_ANONYMOUS_ENABLED=true
      - GF_AUTH_BASIC_ENABLED=false
    ports:
      - "3000:3000/tcp"
    entrypoint:
      - sh
      - -euc
      - |
        mkdir -p /etc/grafana/provisioning/datasources
        cat <<EOF > /etc/grafana/provisioning/datasources/ds.yaml
        apiVersion: 1
        datasources:
        - name: Loki
          type: loki
          access: proxy
          orgId: 1
          url: http://loki:3100
          basicAuth: false
          isDefault: false
          version: 1
          editable: false
        EOF
        /run.sh
The helper service retries the upload while GreptimeDB starts. After you switch Alloy to use the custom pipeline (below), Alloy will start only after the upload exits successfully, so the first log entry can use it.
Finally, change both the table and pipeline headers in config.alloy:
text
"X-Greptime-Log-Table-Name" = "loki_syslog_logs",
"X-Greptime-Pipeline-Name"  = "syslog_logs",
The custom pipeline writes to a new table so GreptimeDB can apply its tag and index definitions when creating the schema. The raw validation data remains in loki_syslog_raw.
Start the stack again:
bash
docker compose up -dOpen http://localhost:4000/dashboard, go to Logs Query, and select public.loki_syslog_logs. You should now see log_level and log_message alongside the original Loki fields.
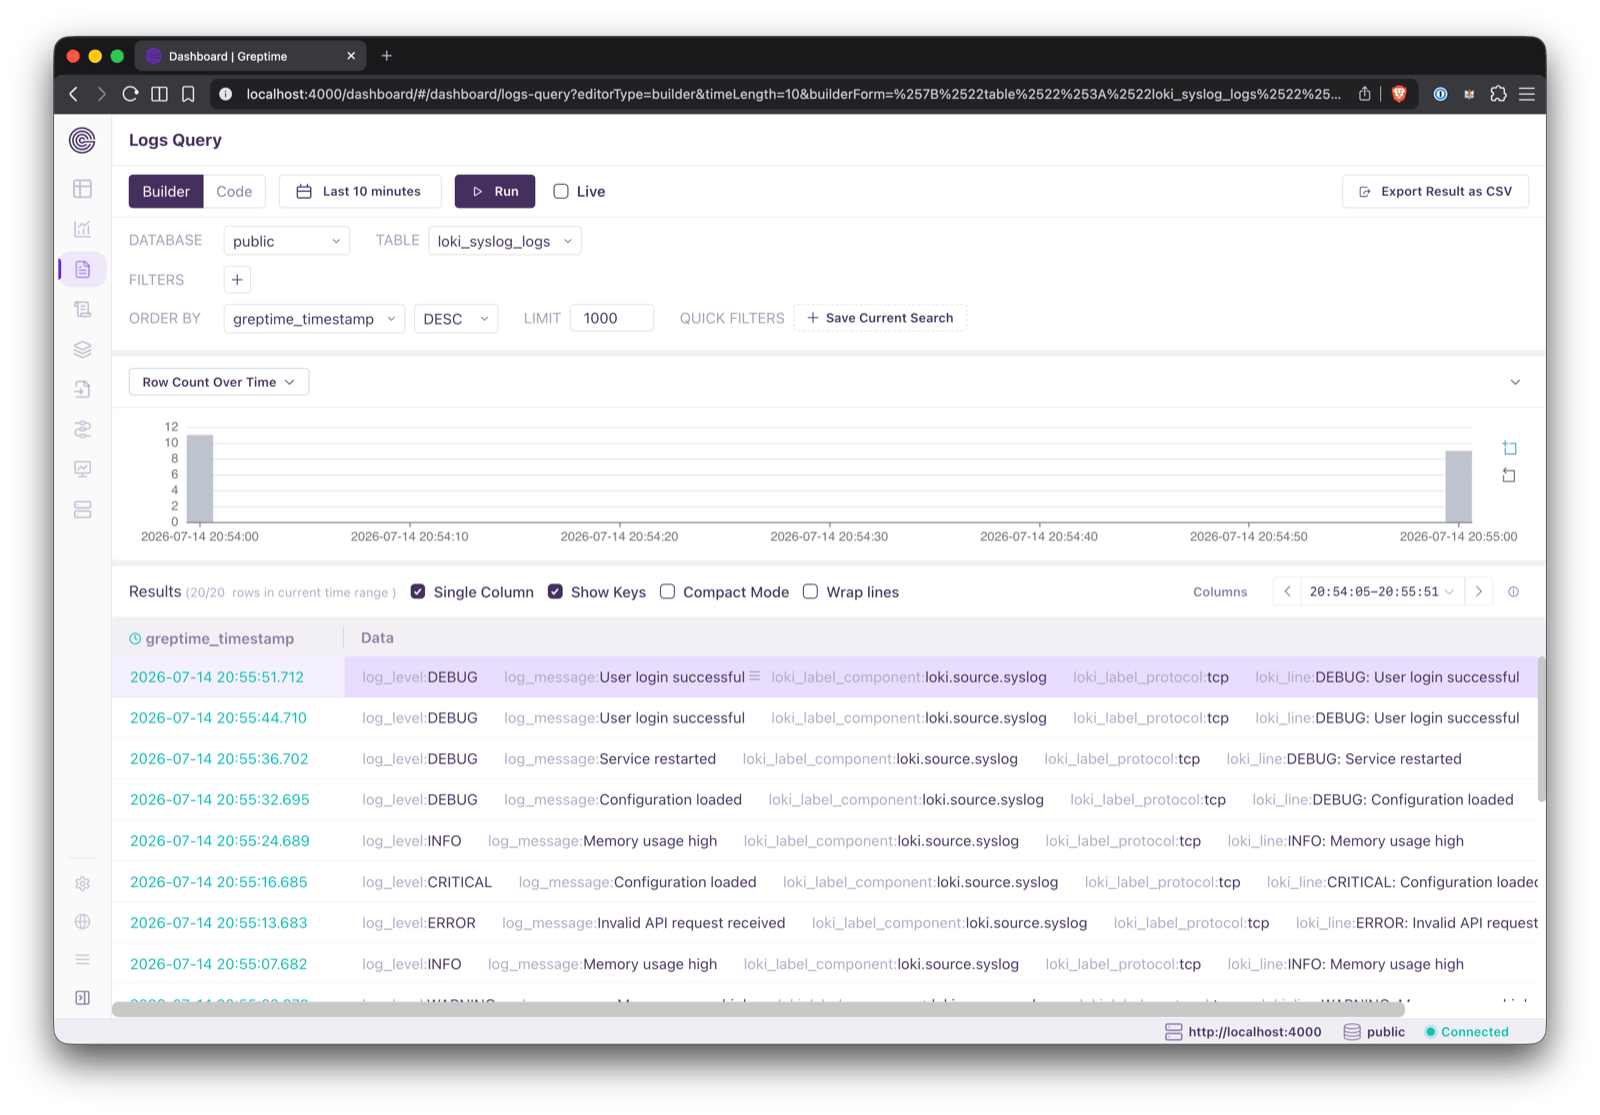
Logs Query showing structured columns in loki_syslog_logs
Use the query builder to filter log_level to CRITICAL, or run this SQL in code mode:
sql
SELECT greptime_timestamp, log_level, log_message
FROM loki_syslog_logs
WHERE log_level = 'CRITICAL'
ORDER BY greptime_timestamp DESC
LIMIT 100;
The equality filter uses the inverted index on log_level, and searches within the message body use the full-text index on log_message.
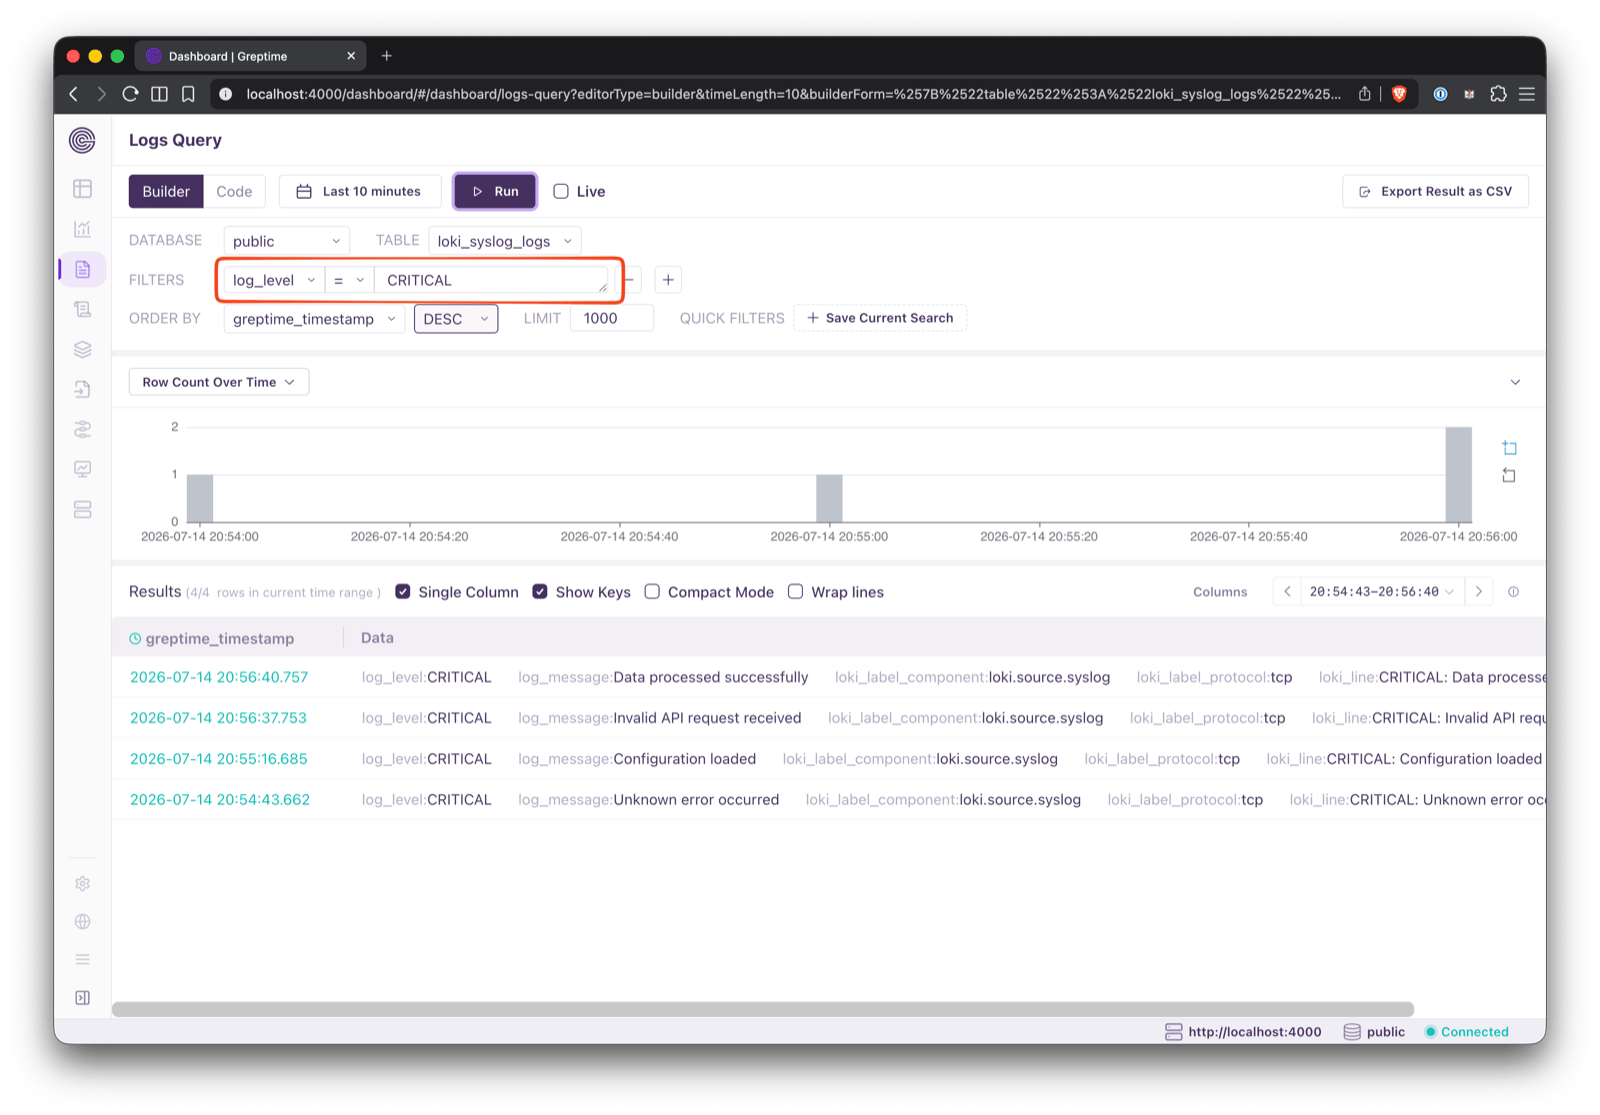
Filtering log_level = CRITICAL with the query builder
Conclusion
This migration keeps the Loki path running while you validate GreptimeDB with the same live traffic. A small custom pipeline then turns each raw syslog line into indexed, queryable columns without discarding the original message or its Loki labels.
Before removing the Loki sink in production, compare records over the same time windows, confirm retention requirements, and move any dashboards and alerts that still depend on LogQL. If historical data must remain searchable, replay it separately before the final cutover.
For more information, see the documentation for migrating from Loki, pipeline configuration, and the GreptimeDB Dashboard.


