On this page
Key Findings
Superior Log Ingestion Throughput: GreptimeDB achieves 121k rows/s in log ingestion, which is about 1.5× faster than Loki. With low-cost OSS storage, GreptimeDB maintains high performance at 102k rows/s without significant degradation.
Blazing-Fast Queries: Leveraging full-text indexing and query caching, GreptimeDB executes keyword searches and aggregations 40–80× faster than Loki. For frequently repeated queries, performance gains exceed 500×.
Higher Compression Efficiency: GreptimeDB’s columnar storage and compression algorithms reduce storage footprint by 50% vs. Loki.
Test Environment
Data Source
We selected monitoring logs from a production etcd cluster over the past three months as our data source to simulate real-world log analysis scenarios as closely as possible. Each log entry contains fields including timestamp, log_level, pod_name, pod_labels, pod_ip and message. The raw log data has the following structure:
sql
{"pod_name":"etcd-1","container_name":"etcd","pod_ip":"10.0.169.66","pod_labels":"{\"app.kubernetes.io/component\":\"etcd\",\"app.kubernetes.io/instance\":\"etcd\",\"app.kubernetes.io/managed-by\":\"Helm\",\"app.kubernetes.io/name\":\"etcd\",\"apps.kubernetes.io/pod-index\":\"1\",\"controller-revision-hash\":\"etcd-7dc48bf797\",\"helm.sh/chart\":\"etcd-9.0.0\",\"statefulset.kubernetes.io/pod-name\":\"etcd-1\"}","message":"{\"level\":\"debug\",\"ts\":\"2025-06-17T14:41:34.06945Z\",\"caller\":\"etcdserver/server.go:2231\",\"msg\":\"applyEntryNormal\",\"raftReq\":\"header:<ID:15307056038004875511 > alarm:<> \"}","timestamp":"2025-06-17T14:41:34.069544309"}The fields are structured as follows:
| Field | Description |
|---|---|
pod_name | Name of the associated Pod (etcd-1), representing the second replica (index 1) of a StatefulSet |
container_name | Source container name for the log (etcd) |
pod_ip | Internal IP address of the Pod: 10.0.169.66 |
pod_labels | Labels associated with this Pod |
timestamp | Log timestamp: 2025-06-17T14:41:34.069544309Z (UTC) |
message | Core log content containing nested etcd log structure: level (severity), ts (internal timestamp), caller (source code location), msg (log content), and raftReq (Raft protocol request details) |
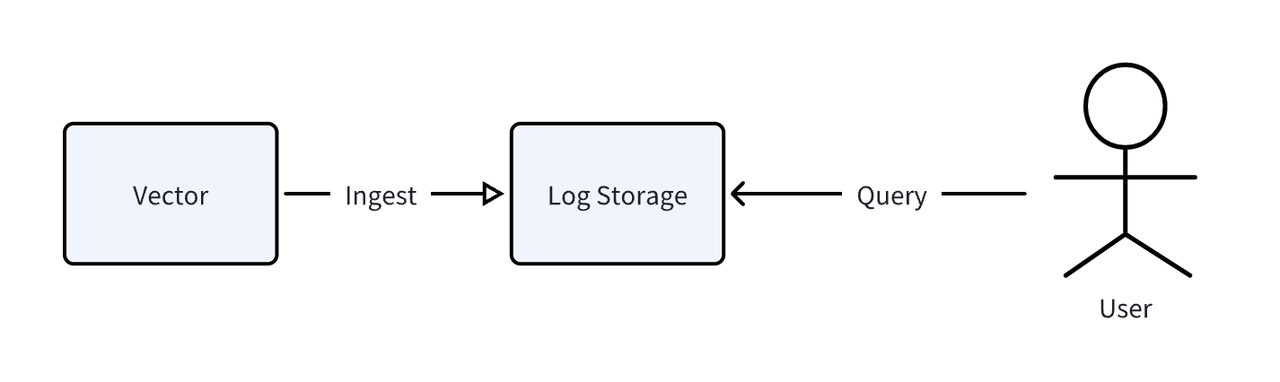
We used Vector, an open-source observability data pipeline, to parse and ingest the aforementioned data. The overall test workflow is shown in the diagram below:
Hardware & Software
Hardware Platform
| Server Model | OS |
|---|---|
| Alibaba Cloud ECS c9i.3xlarge (12 vCPU, 24 GiB RAM) | Ubuntu 24.04 LTS |
Database resources were constrained to 8 vCPU cores and 16GB memory, with unallocated resources assigned to Vector and monitoring components.
Software Components
| Database | Version |
|---|---|
| GreptimeDB | 0.15.3 |
| Loki | 3.5.2 |
Performance Benchmarks
Ingestion Throughput
| Database | TPS |
|---|---|
| GreptimeDB | 121k rows/s |
| GreptimeDB on OSS | 102k rows/s |
| Loki | 78k rows/s |
Benchmarking write performance yielded the following conclusions:
GreptimeDB demonstrates exceptional ingestion throughput: Achieving 121k rows/s in tests, GreptimeDB delivers outstanding performance. When using cost-efficient OSS object storage as the backend, it maintains high efficiency at 102k rows/s.
Loki exhibits lower ingestion capacity: At 78k rows/s, Loki's ingestion throughput is 35.5% lower than GreptimeDB's native performance.
Collectively, GreptimeDB shows superior ingestion scalability, retaining excellent ingestion capabilities even with object storage infrastructure.
Query Latency
In this query performance assessment, we selected four common query types covering quintessential log analysis scenarios:
Keyword Search: Locates specific information by keyword within logs, combining time-range filtering and pagination for rapid data pinpointing.
Per-Minute Aggregation: Counts keyword occurrences per minute with Pod-level grouping, enabling trend analysis over time periods.
Top Error/Warn Pod Queries: Identifies Pods generating the most warning/error logs to flag potentially problematic nodes.
Distinct Value Queries: Retrieves unique values for specified fields (e.g., service names or hostnames).
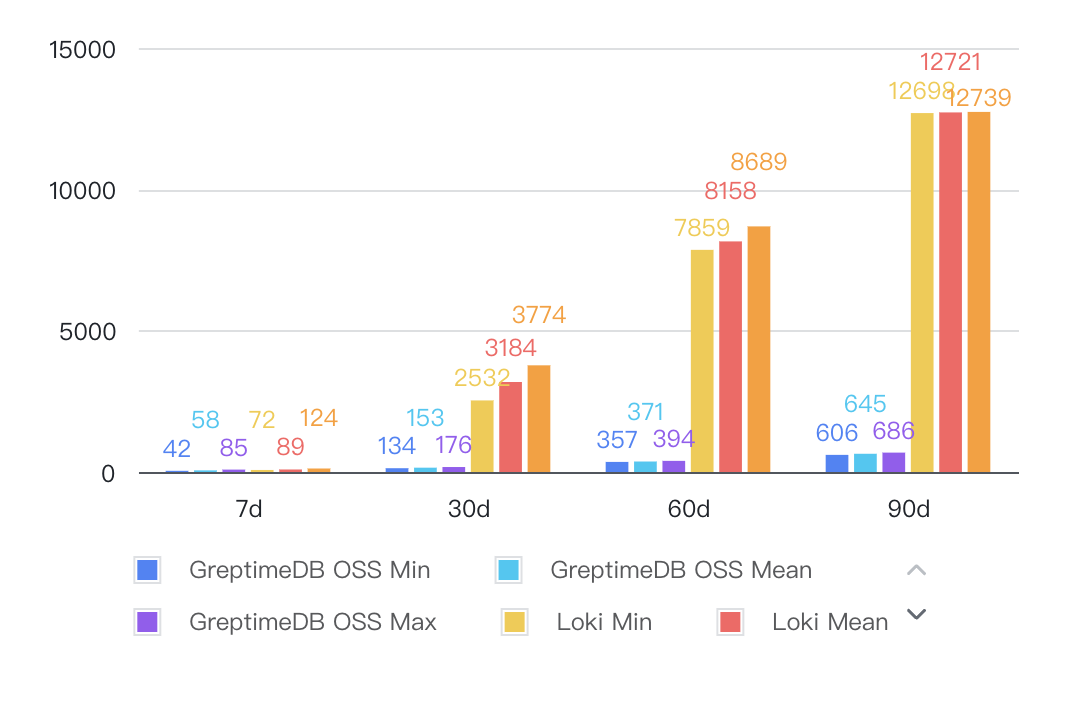
Keyword Search
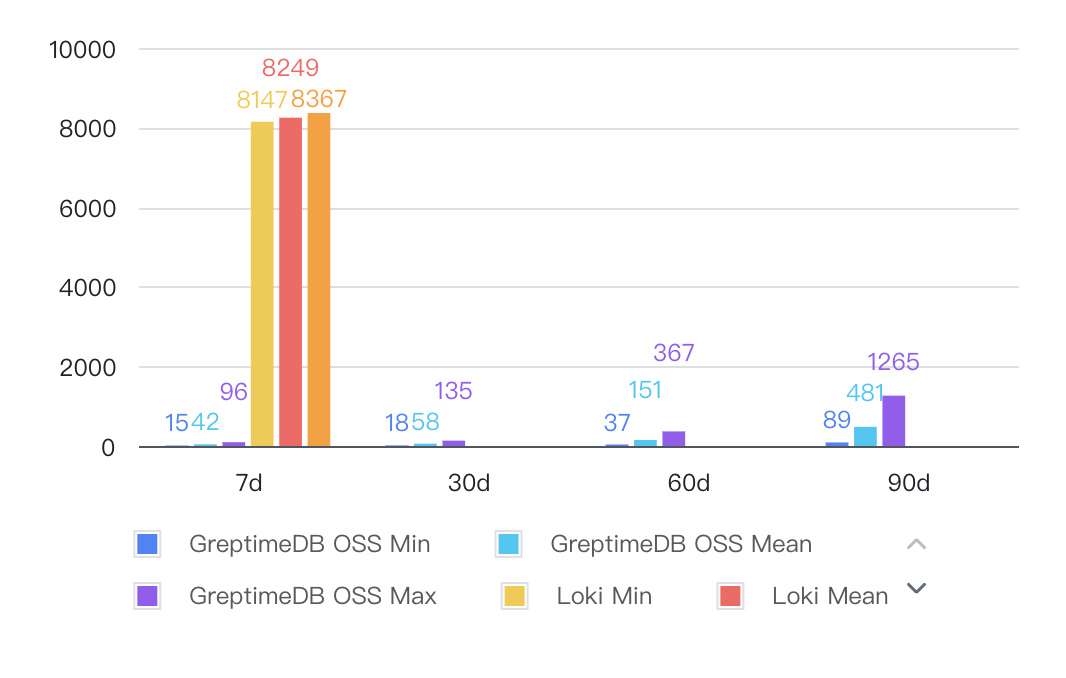
The X-axis of the chart represents the query time range, and the Y-axis shows query latency in milliseconds (lower is better).
Queries for 30d, 60d, and 90d time ranges timed out in Loki and are excluded from the chart.
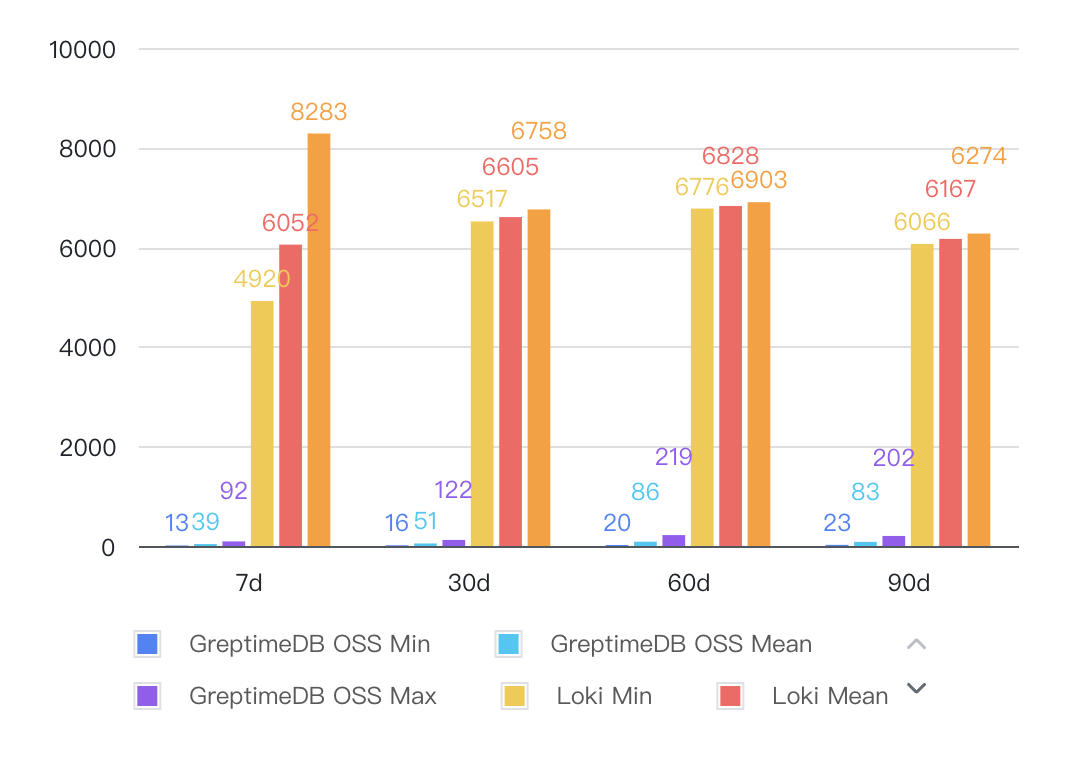
Per-Minute Aggregation
Top Error/Warn Pod Queries
Distinct Value Queries
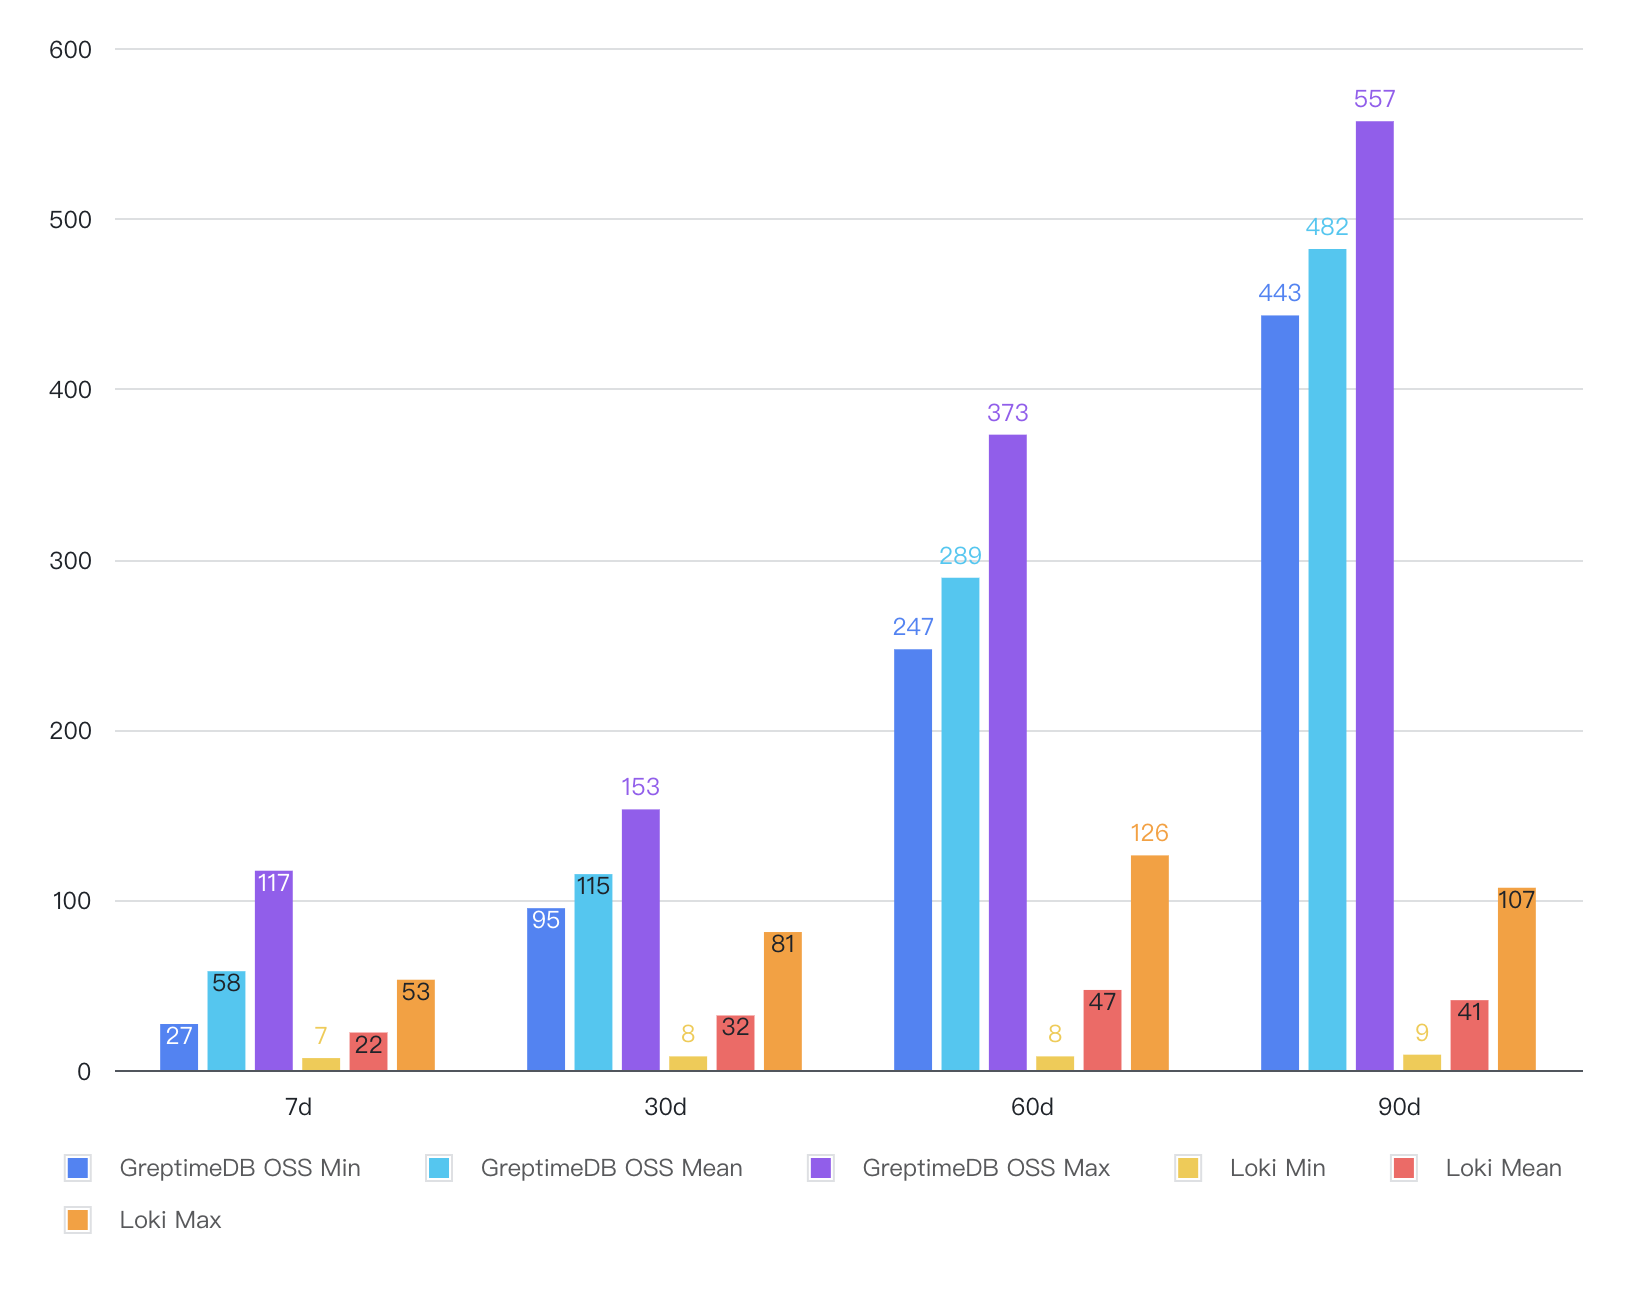
Analysis of comparative query performance data reveals:
Full-text indexing drives significant advantages: In key scenarios like keyword searches and per-minute aggregations, GreptimeDB achieves 40-80x faster query speeds versus Loki.
Caching amplifies hotspot performance: For frequently repeated queries, GreptimeDB's built-in result caching delivers >500x speed improvements, drastically reducing response times.
Distinct query optimization path: While Loki performs better in distinct-value queries, GreptimeDB can optimize these via Flow's precomputation capabilities.
Resource Usage & Compression Ratios
| Database | CPU Avg | Memory Avg | Memory Max |
|---|---|---|---|
| GreptimeDB | 35% | 1.9GB | 2.21GB |
| GreptimeDB on OSS | 30% | 1.75GB | 2.24GB |
| Loki | 33.75% | 1.4GB | 2.12GB |
CPU Utilization: GreptimeDB averages 30%-35% CPU usage, comparable to Loki's 33.75%, indicating similar compute efficiency.
Memory Consumption: GreptimeDB's average memory usage (1.75GB-1.9GB) is moderately higher than Loki's (about 1.4GB). Peak memory usage for both stabilizes around 2.1GB, showing minimal divergence.
GreptimeDB delivers superior write throughput while maintaining resource consumption parity with Loki.
Compression Ratios
The raw NDJSON data file measures approximately 83GB. After full data ingestion, we measured the persisted data directories of each database to calculate the following compression ratios:
| Database | Data Size(GB) | Compression Ratio |
|---|---|---|
| GreptimeDB | 3.03 | 3% |
| GreptimeDB on OSS | 2.81 | 3% |
| Loki | 6.59 | 8% |
GreptimeDB demonstrates high compression efficiency in storing log data, occupying only about 3% of the original data volume, with compressed data size approximately 3.03 GB. In comparison, Loki's compression ratio is around 8%, resulting in a data size of 6.59 GB—significantly higher storage usage than GreptimeDB.
In scenarios sensitive to storage efficiency and cost, GreptimeDB holds a distinct advantage.
Appendix
Query Examples
Range Match
SQL
sql
SELECT
  *
FROM
  ${TABLE_NAME}
WHERE
  message @@ '${KEYWORD}'
  AND timestamp >= '${START_TIME}'
  AND timestamp <= '${END_TIME}'
ORDER BY
  timestamp DESC
OFFSET ${OFFSET}
LIMIT ${LIMIT}
LogQL
bash
"http://${DB_HOST}:${DB_PORT}/loki/api/v1/query_range" \
    -d 'query={level="info"} |= `${QUERY}`' \
    -d "limit=${LIMIT}" \
    -d "direction=backward" \
    -d "start=${START_TIME}" \
    -d "end=${END_TIME}"
Minute bucket with match
SQL
sql
SELECT
  date_bin('1m'::interval, timestamp) AS minute_bucket,
  pod_name,
  pod_ip,
  COUNT(*) AS log_count
FROM ${TABLE_NAME}
WHERE
  message @@ '${KEYWORD}'
  AND timestamp >= '${START_TIME}'
  AND timestamp <= '${END_TIME}'
GROUP BY minute_bucket, pod_name, pod_ip
ORDER BY minute_bucket ASC, pod_ip ASC;
LogQL
bash
"http://${DB_HOST}:${DB_PORT}/loki/api/v1/query_range" \
    -d 'count_over_time({level="info"} |= `${QUERY}` [1m])' \
    -d "direction=backward" \
    -d "start=${START_TIME}" \
    -d "end=${END_TIME}"
Top error warn pods
SQL
sql
SELECT pod_name, pod_ip, COUNT(*) AS cnt
FROM ${TABLE_NAME}
WHERE
(level = 'warn' OR level = 'error')
AND timestamp >= '${START_TIME}'
AND timestamp <= '${END_TIME}'
GROUP BY pod_name, pod_ip
ORDER BY cnt DESC, pod_ip DESC
LIMIT ${LIMIT};
LogQL
bash
"http://${DB_HOST}:${DB_PORT}/loki/api/v1/query" \
    -d 'query=topk(${LIMIT}, sum by(pod_ip, pod_name) (count_over_time({level=~"warn|error"}[${RATE_INTERVAL}])))' \
    -d "start=${START_TIME}" \
    -d "end=${END_TIME}"
Distinct
SQL
sql
SELECT
  DISTINCT(${QUERY})
FROM
  ${TABLE_NAME}
WHERE
  timestamp >= '${START_TIME}'
  AND timestamp <= '${END_TIME}'
ORDER BY ${QUERY}
LIMIT ${LIMIT};
LogQL
bash
"http://${DB_HOST}:${DB_PORT}/loki/api/v1/label/${QUERY}/values" \
    -d "start=${START_TIME}" \
    -d "end=${END_TIME}"
Configuration Details
GreptimeDB
Vector Configuration
c++
[sources.logfile]
type = "file"
include = ["/data/etcd_logs/output.json"]

[transforms.parse_log]
type = "remap"
inputs = ["logfile"]
source = '''
  . = parse_json!(.message)

  .parsed_message, err = parse_json(.message)
  if is_object(.parsed_message) {
    .level = .parsed_message.level
  }
  del(.parsed_message)
  if exists(.timestamp) {
    .timestamp = parse_timestamp!(.timestamp, "%Y-%m-%dT%H:%M:%S.%f")
  }

  .pod_name = .pod_name
  .container_name = .container_name
  .pod_ip = .pod_ip
  .message_id = .message_id

  .pod_labels, err = parse_json(.pod_labels)
  if is_object(.pod_labels) {
    ."app.kubernetes.io/component" = .pod_labels."app.kubernetes.io/component"
    ."app.kubernetes.io/instance" = .pod_labels."app.kubernetes.io/instance"
    ."app.kubernetes.io/managed-by" = .pod_labels."app.kubernetes.io/managed-by"
    ."app.kubernetes.io/name" = .pod_labels."app.kubernetes.io/name"
    ."apps.kubernetes.io/pod-index" = .pod_labels."apps.kubernetes.io/pod-index"
    ."controller-revision-hash" = .pod_labels."controller-revision-hash"
    ."helm.sh/chart" = .pod_labels."helm.sh/chart"
    ."statefulset.kubernetes.io/pod-name" = .pod_labels."statefulset.kubernetes.io/pod-name"
  }
  del(.pod_labels)
'''

[sinks.greptime_logs]
type = "greptimedb_logs"
inputs = ["parse_log"]
compression = "gzip"
dbname = "public"
endpoint = "http://greptimedb:4000"
pipeline_name = "greptime_identity"
extra_params = { "custom_time_index" = "timestamp;datestr;%Y-%m-%dT%H:%M:%S%.9f%#z" }
table = "demo_logs"
batch.max_events = 1000

[sources.vector_metrics]
type = "internal_metrics"

[sinks.prometheus_exporter]
type = "prometheus_exporter"
inputs = ["vector_metrics"]
address = "0.0.0.0:9598"
Table Creation Statement
sql
CREATE TABLE IF NOT EXISTS `demo_logs` (
  `message` STRING NULL FULLTEXT INDEX,
  `level` STRING NULL SKIPPING INDEX,
  `target` STRING NULL SKIPPING INDEX,
  `pod_name` STRING NULL SKIPPING INDEX,
  `container_name` STRING NULL SKIPPING INDEX,
  `pod_ip` STRING NULL SKIPPING INDEX,
  `app.kubernetes.io/component` STRING NULL SKIPPING INDEX,
  `app.kubernetes.io/instance` STRING NULL SKIPPING INDEX,
  `app.kubernetes.io/managed-by` STRING NULL SKIPPING INDEX,
  `app.kubernetes.io/name` STRING NULL SKIPPING INDEX,
  `apps.kubernetes.io/pod-index` STRING NULL SKIPPING INDEX,
  `controller-revision-hash` STRING NULL SKIPPING INDEX,
  `helm.sh/chart` STRING NULL SKIPPING INDEX,
  `message_id` STRING NULL SKIPPING INDEX,
  `timestamp` TIMESTAMP(9) NOT NULL,
  TIME INDEX (`timestamp`)
)
ENGINE=mito
WITH(
  skip_wal = 'true',
  append_mode = 'true'
);
Loki
Software Configuration
yaml
auth_enabled: false

server:
  http_listen_port: 3100
  grpc_listen_port: 9096

common:
  instance_addr: 0.0.0.0
  path_prefix: /tmp/loki
  storage:
    filesystem:
      chunks_directory: /tmp/loki/chunks
      rules_directory: /tmp/loki/rules
  replication_factor: 1
  ring:
    kvstore:
      store: inmemory

query_range:
  results_cache:
    cache:
      embedded_cache:
        enabled: true
        max_size_mb: 100

schema_config:
  configs:
    - from: 2020-10-24
      store: tsdb
      object_store: filesystem
      schema: v13
      index:
        prefix: index_
        period: 24h

ruler:
  alertmanager_url: http://localhost:9093

analytics:
  reporting_enabled: false

ingester:
  max_chunk_age: 4800h

limits_config:
  reject_old_samples: true
  retention_period: 365d
  max_query_lookback: 365d
  max_query_length: 0h

  ingestion_rate_mb: 10240
  ingestion_burst_size_mb: 10240
  max_streams_per_user: 10000000
  max_global_streams_per_user: 10000000

  per_stream_rate_limit: 10240M
  per_stream_rate_limit_burst: 10240M
  cardinality_limit: 20000000
Vector Configuration
c++
[sources.logfile]
type = "file"
include = ["/data/etcd_logs/output.json"]

[transforms.parse_log]
type = "remap"
inputs = ["logfile"]
source = '''
  . = parse_json!(.message)

  .parsed_message, err = parse_json(.message)
  if is_object(.parsed_message) {
    .level = .parsed_message.level
  }
  del(.parsed_message)
  if exists(.timestamp) {
    .timestamp = parse_timestamp!(.timestamp, "%Y-%m-%dT%H:%M:%S.%f")
  }

  .pod_name = .pod_name
  .container_name = .container_name
  .pod_ip = .pod_ip

  .pod_labels, err = parse_json(.pod_labels)
  if is_object(.pod_labels) {
    ."app.kubernetes.io/component" = .pod_labels."app.kubernetes.io/component"
    ."app.kubernetes.io/instance" = .pod_labels."app.kubernetes.io/instance"
    ."app.kubernetes.io/managed-by" = .pod_labels."app.kubernetes.io/managed-by"
    ."app.kubernetes.io/name" = .pod_labels."app.kubernetes.io/name"
    ."apps.kubernetes.io/pod-index" = .pod_labels."apps.kubernetes.io/pod-index"
    ."controller-revision-hash" = .pod_labels."controller-revision-hash"
    ."helm.sh/chart" = .pod_labels."helm.sh/chart"
    ."statefulset.kubernetes.io/pod-name" = .pod_labels."statefulset.kubernetes.io/pod-name"
  }
  del(.pod_labels)
'''

[sinks.loki]
type = "loki"
inputs = [ "parse_log" ]
compression = "gzip"
endpoint = "http://loki:3100"
out_of_order_action = "accept"
path = "/loki/api/v1/push"
batch.max_events = 1000
encoding.codec = "json"
healthcheck = false
remove_timestamp = false

[sinks.loki.labels]
source = "vector"
level = "{{level}}"
pod_name = "{{pod_name}}"
container_name = "{{container_name}}"
pod_ip = "{{pod_ip}}"

[sources.vector_metrics]
type = "internal_metrics"

[sinks.prometheus_exporter]
type = "prometheus_exporter"
inputs = ["vector_metrics"]
address = "0.0.0.0:9598"
Monitoring Data
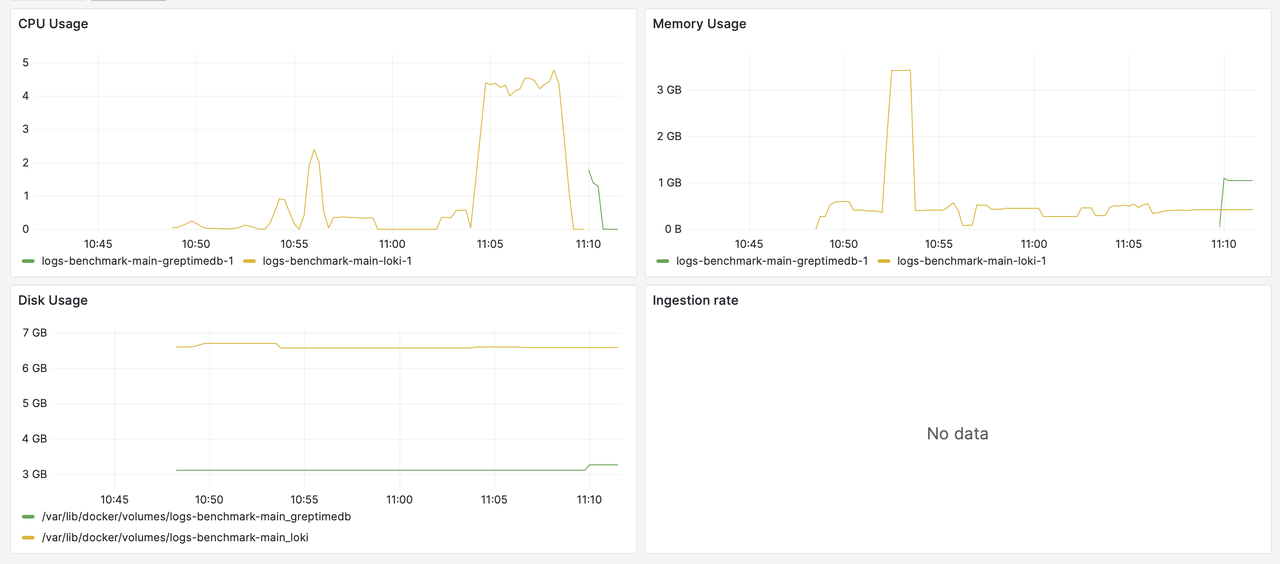
Loki Data Ingestion
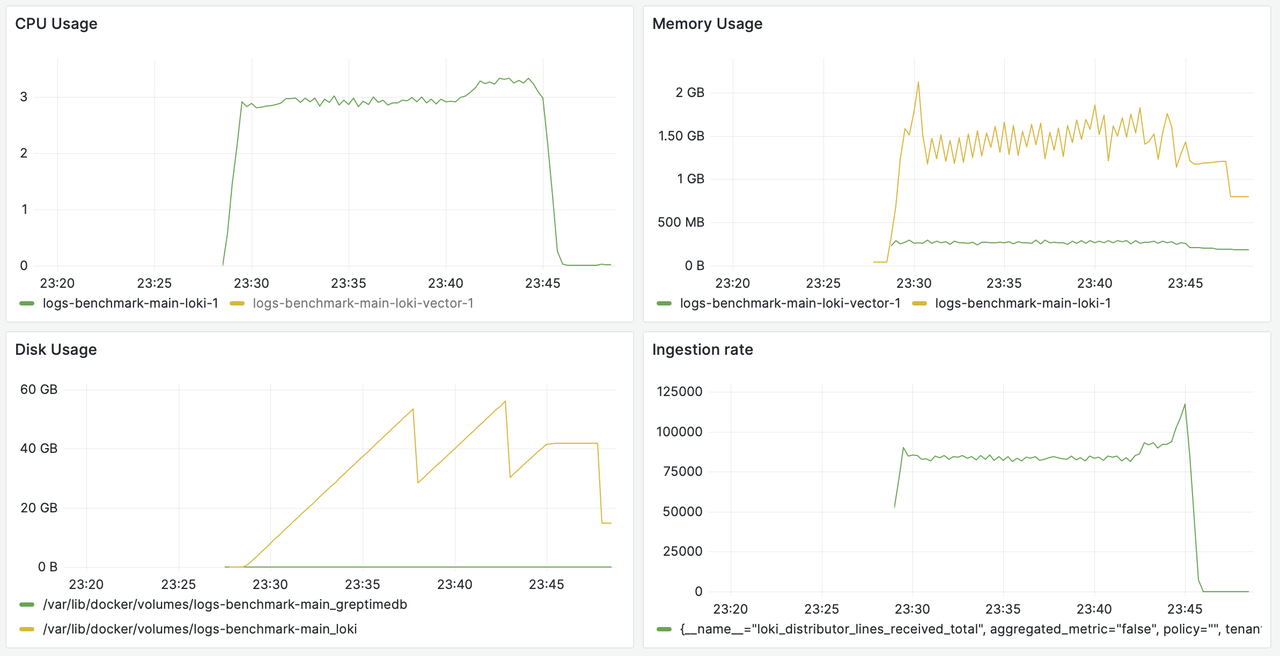
During Loki's data ingestion process, disk usage peaks at 60GiB (indicated by the yellow line for Disk Usage).
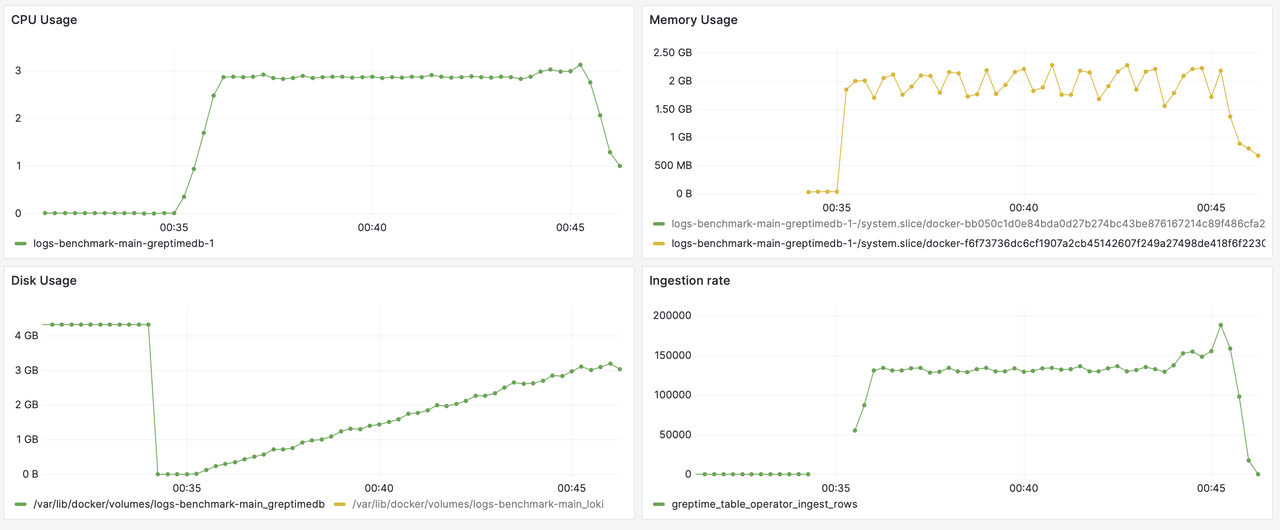
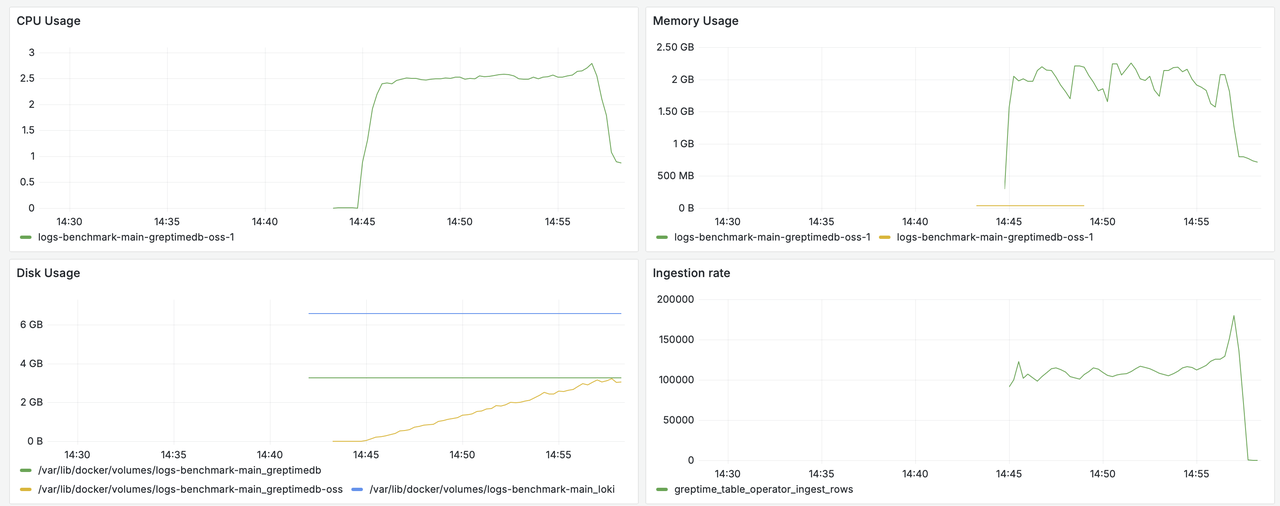
GreptimeDB Data Ingestion
GreptimeDB OSS Data Ingestion
Query
In the chart, the yellow line represents Loki's resource utilization, while the green line corresponds to GreptimeDB.


