
On this page

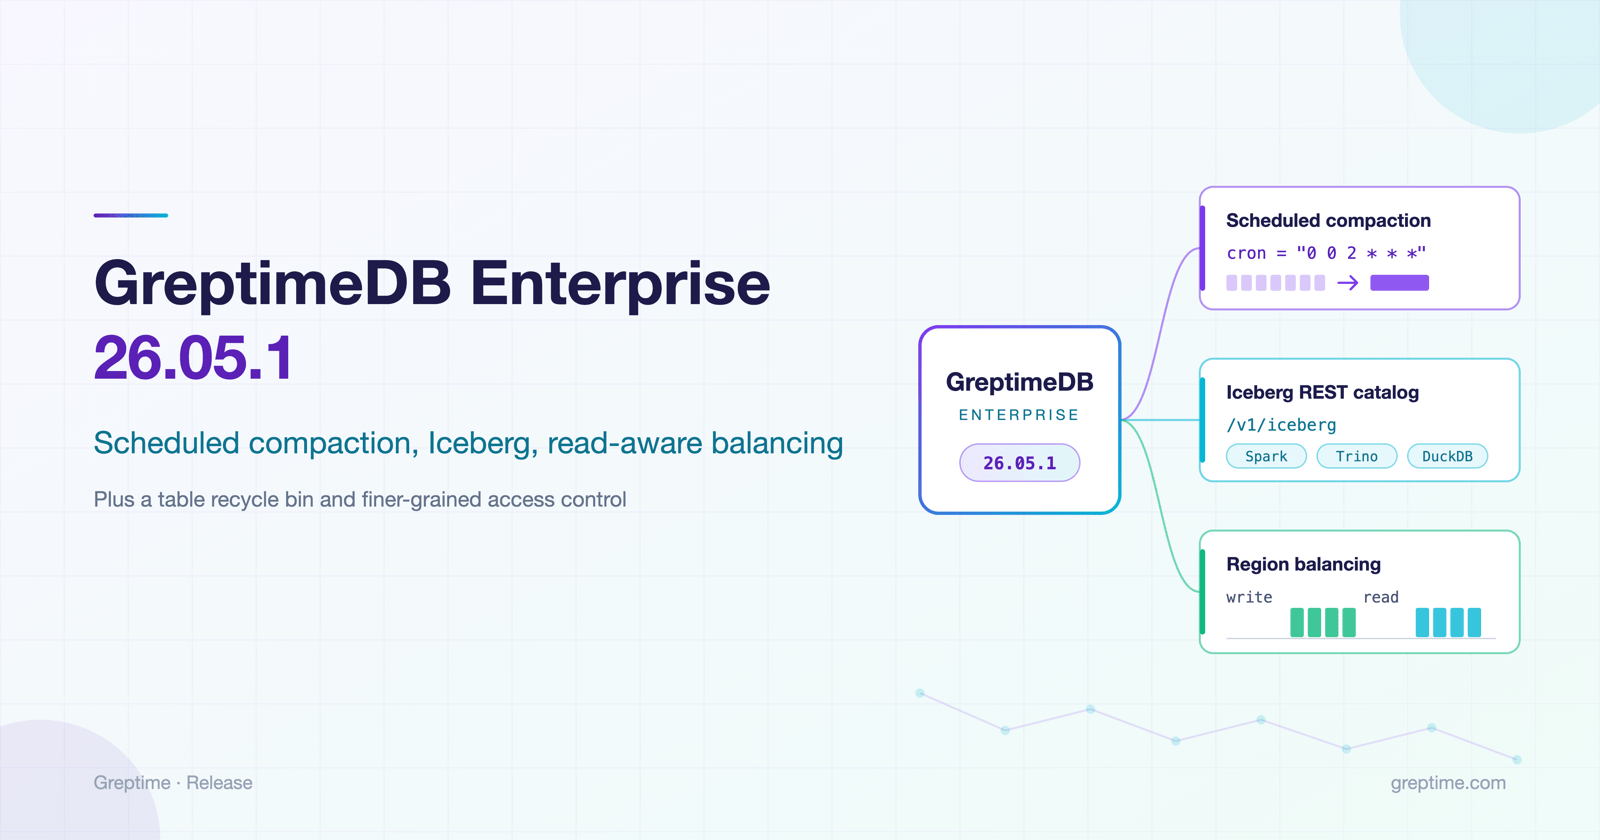
GreptimeDB Enterprise 26.05.1 is a minor update to the 26.05 line, but it packs in some of the operational capabilities our enterprise users ask for most: keeping storage healthy without manual compaction chores, letting the data platform read GreptimeDB tables through Apache Iceberg, and keeping a cluster evenly loaded when reads and writes stress different nodes. The release also rebases the engine to open-source GreptimeDB v1.2, and adds an opt-in recycle bin for dropped tables plus a tighter access-control model.
Here is what's in it from an operator's and user's point of view.
Compaction on a schedule
Compaction keeps query performance and storage footprint in check, but until now it ran when GreptimeDB decided it was needed — or when someone remembered to trigger it manually. That works for steady workloads, but it falls short at scale: heavy ingestion — especially the bulk ingestion path that is exclusive to the Enterprise Edition — produces many small SST files in bursts, and without timely compaction they bloat storage and slow every scan. Regular compaction rewrites them into a better data layout, which pays off twice: fewer, larger files to scan means faster queries, and a tighter layout means better compression and lower storage cost.
26.05.1 introduces the compaction cronjob: a metasrv-managed scheduler that resolves compaction targets across regions, submits and tracks the jobs, persists state in the KV store, and automatically cancels stale running jobs.
In practice this means you can, for example, compact every night at 02:00, off-peak:
toml
# metasrv configuration
[[plugins]]
compaction_cronjob = { enable = true, cron = "0 0 2 * * *" }
The default schedule is daily at midnight, with knobs for how many regions compact concurrently per job, the per-request compaction parallelism, and how many job reports to keep in history.
Scheduled compaction complements the time-range manual compaction that arrived with the v1.2 engine: run the cronjob for routine housekeeping, and compact a specific hot window on demand when you need it.
Apache Iceberg support (early preview)
Your time-series and observability data usually lives in GreptimeDB, while your data platform — Spark, Trino, DuckDB, pyiceberg, and everything else that speaks Iceberg — lives in another world. The traditional bridge is an ETL or dual-write pipeline that duplicates the data itself: extra storage, extra cost, and copies that drift out of sync. (We wrote about why this gap matters in Observability Data Lake is more than Data Lake itself.)
26.05.1 ships an early preview of Apache Iceberg data-lake support built on a simple idea: a metadata dual write. GreptimeDB already stores its SST data files as Parquet in object storage; whenever it writes an SST file (on flush or compaction), the integration also writes Iceberg metadata — manifests, manifest-lists, and table snapshots — that point at those same files, and the frontend serves an Iceberg REST catalog at /v1/iceberg. Only metadata is duplicated, so any Iceberg-compatible engine can read the tables straight from object storage:
- No duplicated data files. The dual write happens beside the data GreptimeDB already writes, so there is no extra data storage cost and no second data pipeline to keep in sync — only the Iceberg metadata, which is orders of magnitude smaller than the data it describes.
- Visible after flush. A new Iceberg snapshot is published on every flush and compaction; to expose just-written rows immediately, flush the table and the rows appear in a new snapshot shortly after.
- Lifecycle coverage. This release extends the export end to end: schema changes from
ALTER TABLEare reflected, repartition, truncate, and drop keep the exported state consistent, bulk ingestion and remote compaction publish metadata through the same pipeline, and Prometheus native histograms as well as metric-engine physical tables are now exportable.
Enabling it is a plugin entry on both the data-writing process (datanode or standalone) and the frontend, referencing the same warehouse_root:
toml
# datanode (or standalone) AND frontend — same warehouse_root on both
[[plugins]]
iceberg_manifest = { warehouse_root = "iceberg_warehouse" }
Then, from GreptimeDB's SQL console, write data as usual and flush to publish the rows you just wrote:
sql
CREATE TABLE demo (
    ts TIMESTAMP(6) TIME INDEX,
    host STRING,
    cpu  DOUBLE
);

INSERT INTO demo VALUES
    ('2026-09-16 00:00:00', 'h1', 12.5),
    ('2026-09-16 00:05:00', 'h1', 88.8),
    ('2026-09-16 00:05:00', 'h2', 55.0);

-- publish Iceberg metadata for the rows just written
admin flush_table('demo');
From the other side, the table is just an Iceberg table. Point your engine at the REST catalog and query away — with pyiceberg:
python
from pyiceberg.catalog.rest import RestCatalog

catalog = RestCatalog(
    name="greptime",
    uri="http://<frontend>:4000/v1/iceberg",
    prefix="greptime",
    # plus object-storage credentials so the engine can read the Parquet files
)

table = catalog.load_table(("public", "demo"))
print(table.scan().to_arrow().to_pandas().head())
or from Spark SQL, with spark.sql.catalog.greptime.uri set to the same endpoint:
sql
SELECT host, round(avg(cpu), 1) AS avg_cpu
FROM greptime.public.demo
WHERE ts >= '2026-09-16 00:00:00'
GROUP BY host;
Time-range filters, aggregates, joins, and window functions all work as with any other Iceberg table. One practical tip: declare the time index as TIMESTAMP(6) (as above) when you plan to query a table through Iceberg from Spark — it makes the on-disk Parquet precision match the Iceberg schema, so file-statistics pruning works correctly on > and range predicates. An existing table can be widened in place, losslessly, with ALTER TABLE demo MODIFY COLUMN ts TIMESTAMP_US. The same catalog serves Trino, DuckDB, and any other Iceberg-compatible client — full client setup is in the Iceberg Export documentation.
As an early preview, it has limits: the export is read-only (GreptimeDB remains the sole writer), it exposes only the latest snapshot (no time travel), and a few GreptimeDB types map lossily — the docs cover the full type mapping and limitations.
Region balancing that sees read load
The Region Balancer in Autopilot has kept write load even across datanodes. But a cluster that ingests evenly can still end up lopsided on the query side — dashboards, heavy Grafana panels, and analytical queries burn CPU on whichever datanodes happen to host the hot regions, and the write-oriented balancer never noticed.
26.05.1 makes balancing multi-dimensional: the balancer now tracks per-region query CPU-rate history alongside write throughput, applies separate stability rules to each dimension (read load must be persistently high across more statistics windows than write load before it triggers a move, filtering out short spikes), and maintains per-dimension balancing state. The result is more stable region placement under mixed read/write workloads, and fewer surprises during planned maintenance when nodes rejoin and regions shuffle.
On the configuration side, the read dimension gets its own stability threshold — note it is stricter than the write one by default, so a burst of dashboard queries alone won't shuffle your regions:
toml
[[plugins.autopilot]]
tick_interval = "45s"

[[plugins.cluster_stat]]
sampling_window = "45s"
max_history_windows = 5

[[plugins.region_balancer]]
acceptable_load_ratio = 0.12
min_load_threshold = "4MB"
region_migration_cooldown_period = "1h"
write_window_stability_threshold = 2
read_window_stability_threshold = 4
The tuning surface follows the same philosophy as before: thresholds for what counts as "high load" per dimension, cooldowns so the same region isn't bounced repeatedly, and caps on migrations per scheduling cycle. If you already run Region Balancer, the new read dimension arrives with the upgrade — no separate feature to enable. See the Region Balancer documentation for every knob.
An opt-in recycle bin for tables
DROP TABLE has always been immediate and unforgiving. 26.05.1 lets you configure soft drop: instead of destroying a table, DROP TABLE closes its regions and moves the metadata to tombstones. The table disappears from normal DDL and DML, but its data is retained and recoverable.
toml
[gc]
enable = true

[gc.experimental_soft_drop]
enable = true
retention = "7d"
Dropped tables land in a recycle bin you can query:
sql
SELECT original_object_name, dropped_at, retention_expires_at
FROM information_schema.recycle_bin;
Restore is one statement, and purging early (or letting retention expire) reclaims the storage:
sql
-- recover the table with its original data
UNDROP TABLE monitor;

-- or destroy it permanently before the retention deadline
ADMIN purge_table('monitor');
A table in the recycle bin still occupies space, so retention is the knob that trades safety for cost. See the soft-drop documentation for the name-conflict rules and purge semantics.
Finer-grained access control
The built-in user management we introduced in July gains several controls this release:
- Named permission actions. Enterprise capabilities — Iceberg reads, pipeline management, dashboard operations, and more — are now individually named actions that can be granted to custom roles. A "data-platform" role can get
iceberg.readwithout anything else; a Grafana service account can be limited to exactly what Grafana needs. - Regex-based database ACLs. Database access rules now accept regular expressions, so
~regex:tenant_[0-9]+grants access across every tenant-prefixed database without enumerating them one by one — and covers databases created after the rule was written. - Creator grants. The user who creates a database now automatically receives database-wide access to it, closing the "I made it but can't use it" gap.
- A query guard against destructive SQL. An optional frontend-level guard can ban
DROP TABLEandDROP DATABASE— plus, if you choose,TRUNCATE TABLE,DELETE, andALTER TABLE ... DROP COLUMN— for all users, admins included. It intercepts statements regardless of privileges, which makes it a last line of defense against fat-fingered operational SQL against production:
toml
[[plugins]]
query_guard = { enable = true, banned_ops = ["drop_table", "drop_database"] }
Built on the v1.2 engine
The engine base moves to open-source GreptimeDB v1.2, which we covered in the v1.2.0 release post — including its compatibility notes, which are worth reviewing as part of an upgrade plan. Highlights that matter most for enterprise deployments:
- The JSON2 type with SQL path access — structured, prunable storage for logs and agent events.
- Lifecycle event recording: structured procedure events for database/table/view DDL, Flow DDL, repartition, GC, and WAL prune, visible in the Enterprise Dashboard — a much clearer audit trail of what the cluster did and when.
- Performance: dictionary-encoded series keys (about 24% faster end-to-end in the authoring PR's tests), earlier input-column pruning in range selects, and an asynchronous compaction picker that no longer blocks the region worker.
Reliability and security
Among the fixes, a few stand out: bulk writes now validate data types for JSONB columns before writing; PromQL or no longer misbehaves with empty operands; the MySQL protocol fails closed on timestamps it cannot represent; Prometheus remote-write timeouts are retryable; and races between asynchronous index builds and schema changes are fixed. Legacy WAL options remain compatible when upgrading, so existing configurations keep working.
On the security side, the HTTP API can now be served on a separate, opt-in port, isolating the API surface from other server traffic, and local file paths in SQL (COPY and external tables) are now confined to a sandbox directory.
Getting 26.05.1
The full changelog is in the release notes. If you are already on the 26.05 line, this is a minor update; if you are coming from an older release, review the engine's v1.2 changes (and its compatibility notes) as part of your upgrade plan.
The Iceberg preview, scheduled compaction, multi-dimensional balancing, and soft drop are the features we expect to hear the most about — if you want to dig into any of them, the Iceberg, Region Balancer, and soft-drop docs are the best places to start. And as always, if you want to talk through your deployment, get in touch with us.


