Grafana Loki Alternative: Why GreptimeDB Scales Past the Labels-Only Ceiling
Introduction
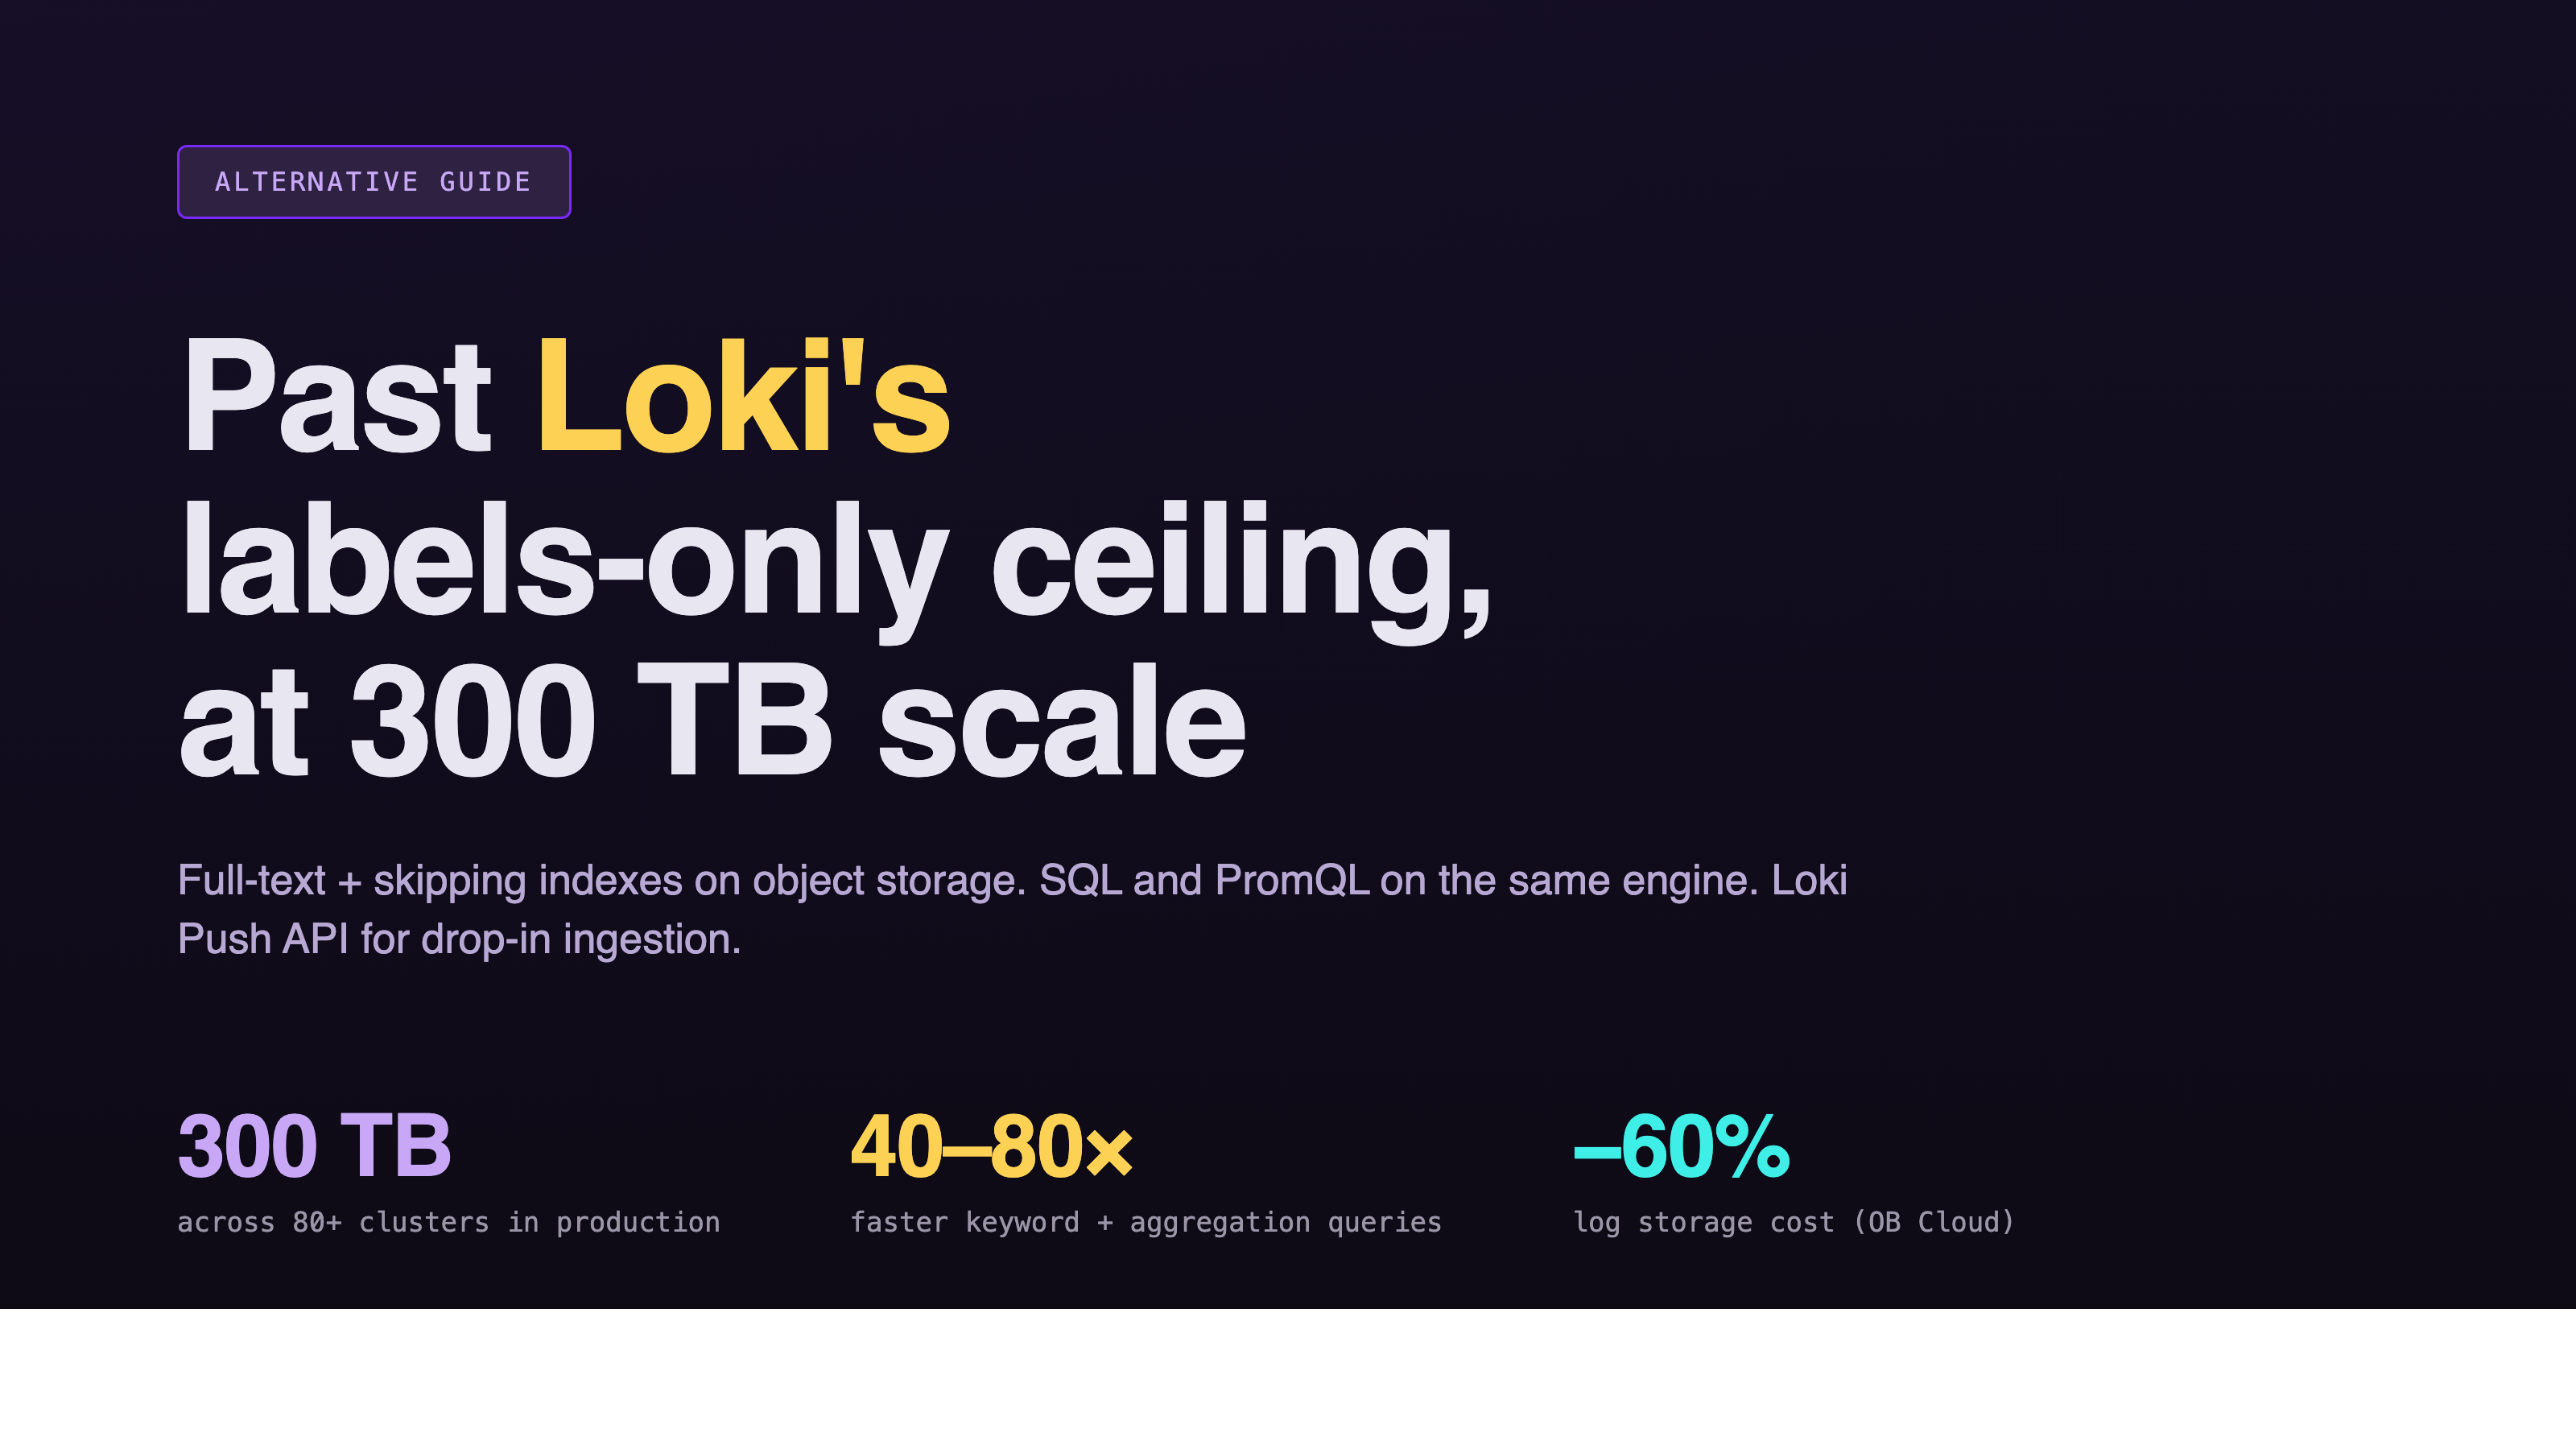
Grafana Loki is built on a clever bet: index labels, not log content. Storage stays cheap, ingestion stays fast, and the architecture is lighter than full-text systems like Elasticsearch. For modest log volumes and label-driven workflows, that trade-off works.
The bet stops working when log bodies have to be searched at scale. Without a full-text index, every keyword query falls back to brute-force scans across log chunks. Default time ranges shrink from hours to minutes to keep the UI responsive. Large queries time out. The bottleneck doesn't improve with more nodes; it tracks the volume of data that has to be scanned.
This article walks through where GreptimeDB is a direct Grafana Loki alternative for log workloads at scale, the architectural trade-offs, and a one-year production case from OceanBase Cloud running 300 TB across 80+ clusters.
The Loki Trade-Off: Cheap Index, Brute-Force Search at Scale
Loki indexes labels (the structured key-value metadata attached to each log stream) and stores the log content itself as compressed chunks on object storage. That's the design: small index, cheap storage, fast label-based filtering.
The trade-off shows up the moment a query has to look inside the log body. A search for an error message, a request ID, or a stack trace has no index to consult. Loki fans the query out across chunks within the time range, decompresses them, and scans linearly. At low volume this is invisible. At scale it becomes the dominant cost. Unlike storage, it gets worse as data grows, not better as components scale out.
Querying outside the label-shaped happy path is also less ergonomic. LogQL is well-designed for label filters and pipe operations, but pulling out a top-N by request body, joining log fields against another dimension, or running ad hoc analytics on extracted columns (the kind of work SQL handles natively) means either rewriting in LogQL idioms or exporting data elsewhere.
OB Cloud's Multi-Cloud Logging Problem
OceanBase Cloud (OB Cloud) is a managed database service running across seven public clouds: Alibaba Cloud, Huawei Cloud, Tencent Cloud, Baidu Cloud, AWS, Azure, and Google Cloud. The platform generates four log types (application logs, OBServer kernel logs, OBProxy logs, and SQL audit data) that all need to be stored, searchable, and retained for troubleshooting.
The defining workload property, in the OB Cloud team's own words: "95% of the time they are not queried. They have to be available the moment something goes wrong, but day-to-day they sit untouched."
That shaped the storage requirements: absorb sustained writes at low cost per byte, and answer keyword and structured queries quickly when an engineer needs them. Native cloud logging stacks (SLS, CloudWatch Logs, Azure Monitor, GCP Logging) were ruled out for query-language fragmentation, lock-in, and per-scan billing. Multi-cloud-neutral options narrowed to three: Elasticsearch (operationally heavy, expensive), ClickHouse (no production-ready full-text index at the time), and Loki. OB Cloud picked Loki as the first generation.
Why Loki Hit a Wall
Three limits surfaced in OB Cloud's production Loki deployment as volume grew:
Index limited to labels. Searching log body content required brute-force scans.
Large queries timed out. The viewer had to default the time range to a few minutes to keep responses tolerable.
The bottleneck got worse, not better, as workload grew.
— OceanBase Cloud engineering team
Each one maps directly to the labels-only design. Body search has no index to use. Big queries scan more data, so they get slower, not faster, as the cluster grows. The bottleneck is structural, not a matter of throwing more Querier replicas at it.
One Engine vs Loki + Mimir + Tempo
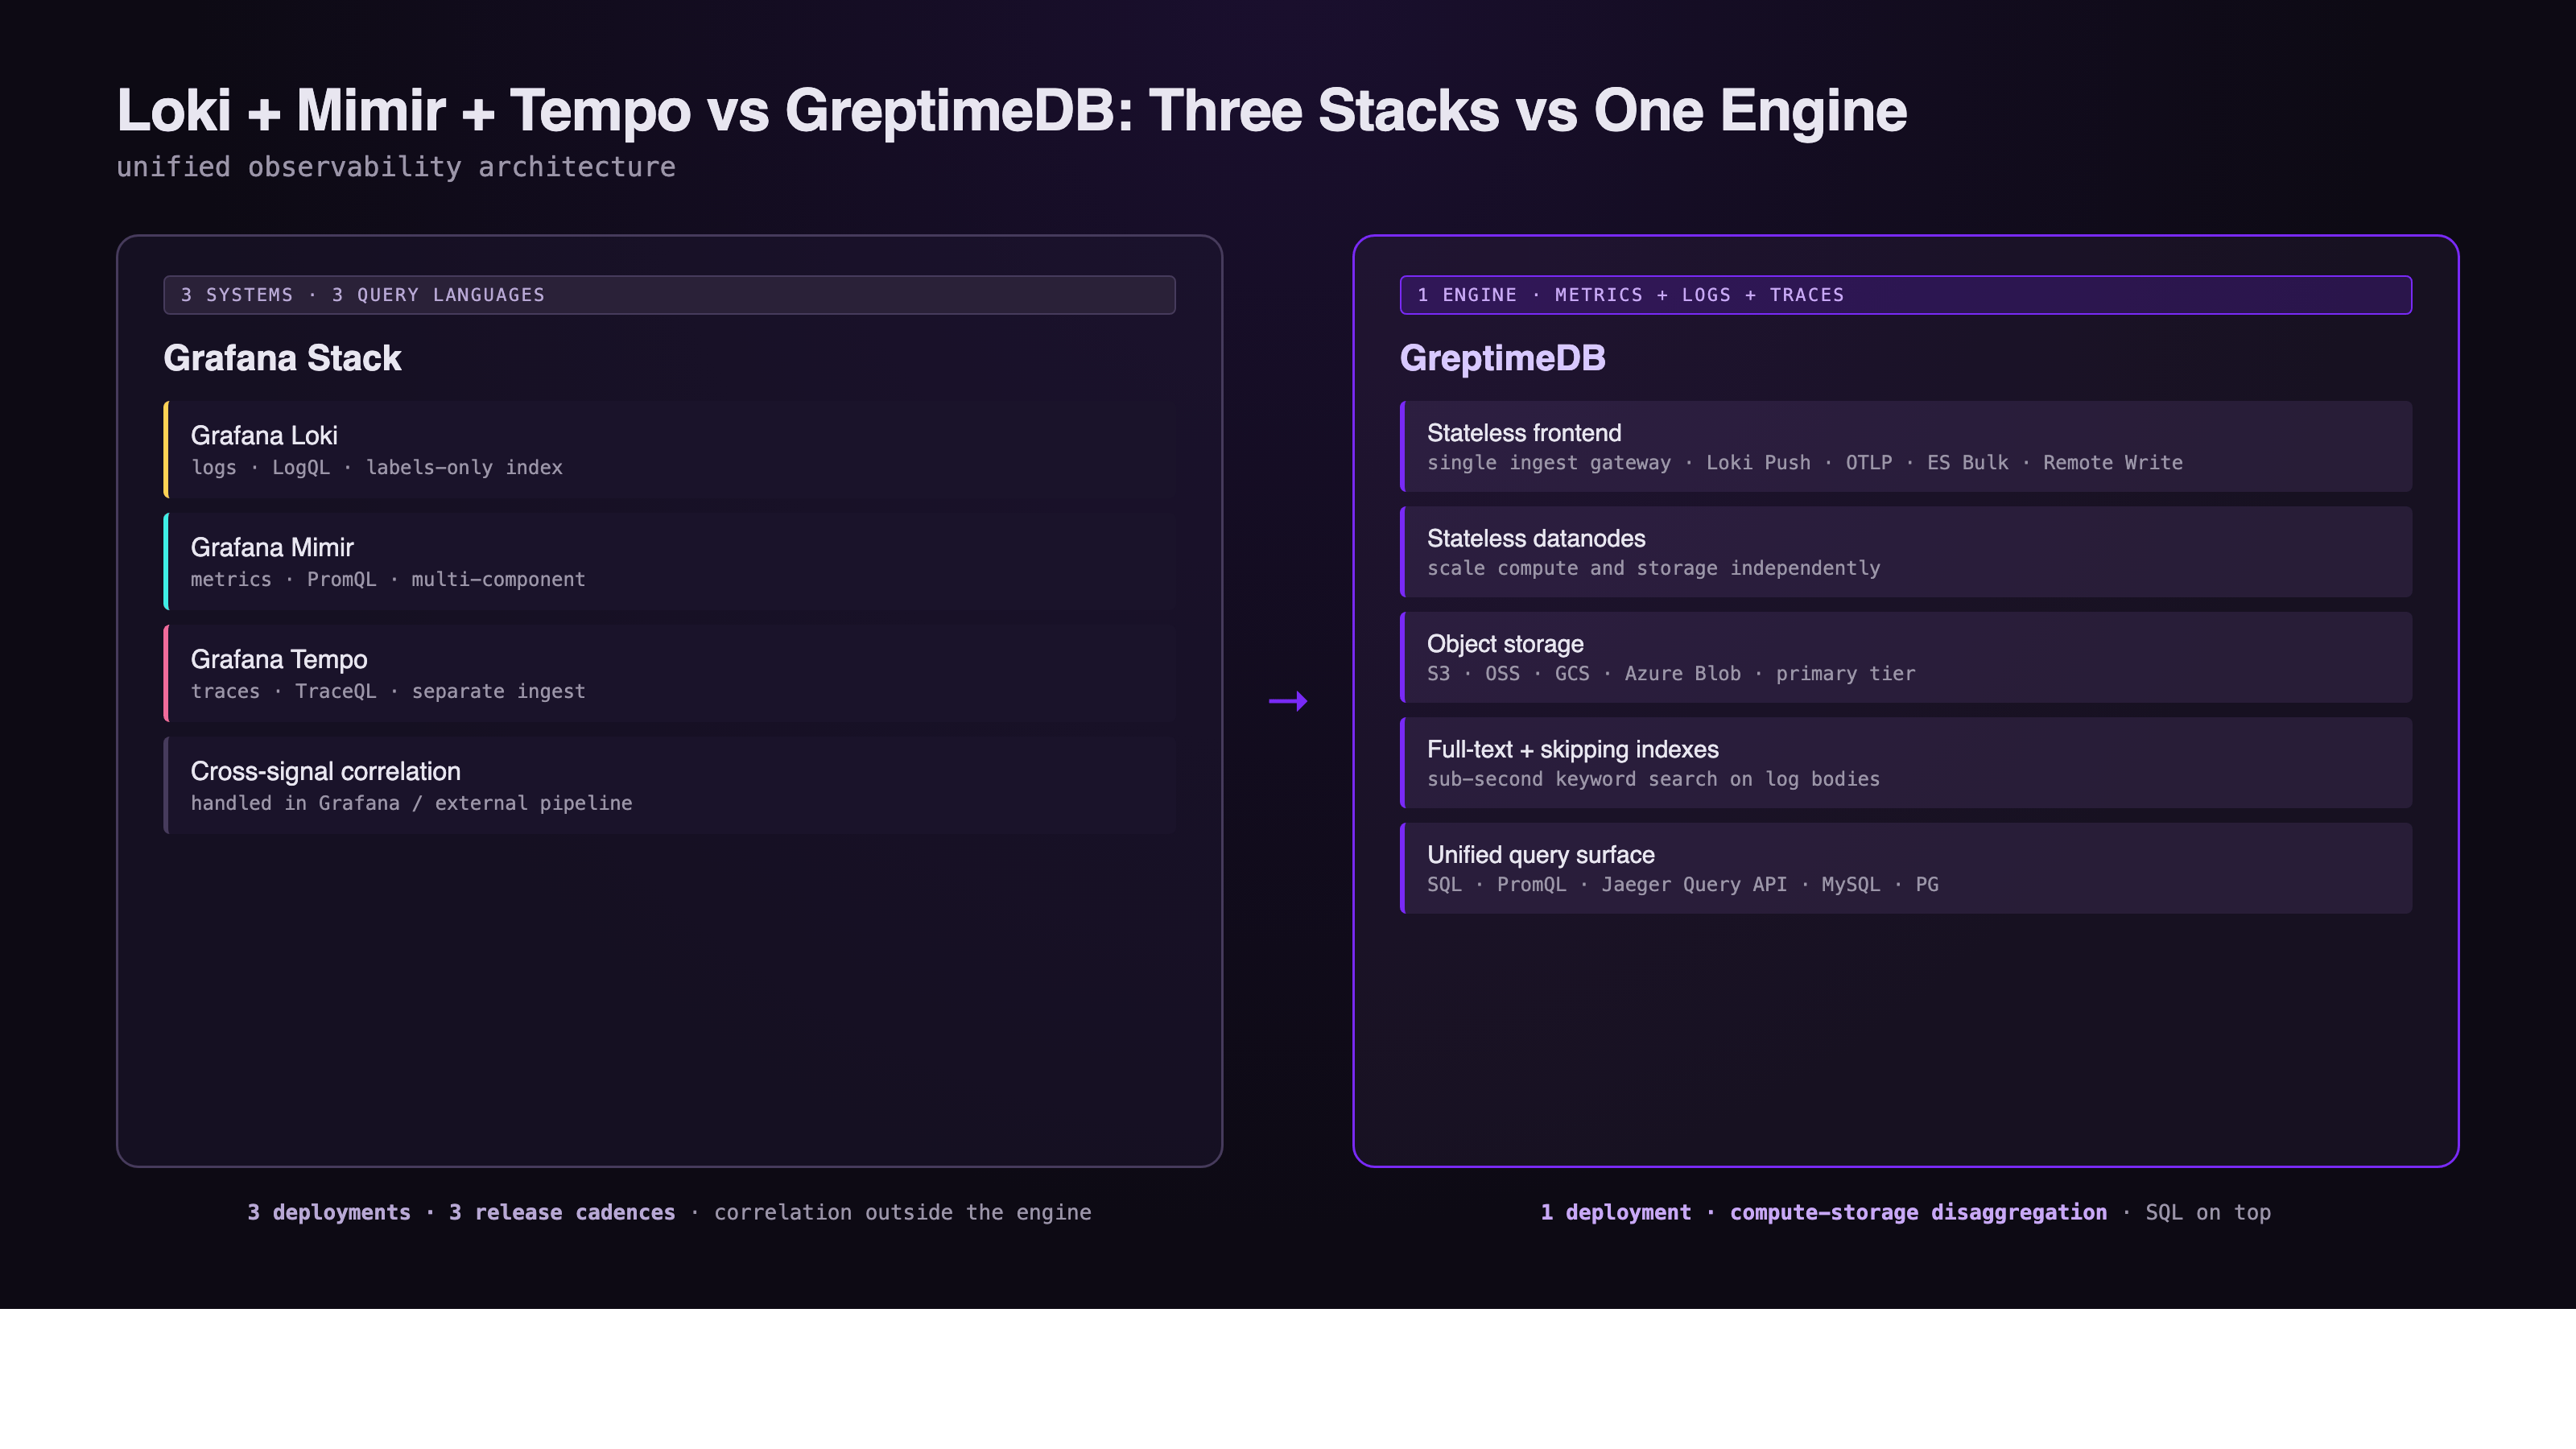
Loki itself is logs-only. A complete observability deployment usually pairs it with Grafana Mimir for metrics and Grafana Tempo for traces. That's three separate systems, three release cadences, three storage layers, and three query surfaces (LogQL, PromQL, TraceQL).
GreptimeDB consolidates ingestion, storage, and query for all three signals into one cloud-native engine:
- Stateless frontend for ingestion and query routing.
- Stateless datanodes holding region replicas, scaled independently.
- Object storage (S3, GCS, Azure Blob, OSS, MinIO) as the primary storage tier.
- SQL + PromQL as first-class query interfaces, with Loki Push API, Elasticsearch Bulk API, and OpenTelemetry OTLP for ingestion compatibility.
- Full-text + skipping indexes for sub-second keyword search.
The collectors stay the same. Promtail, Fluent Bit, Vector, and OpenTelemetry agents already know how to talk to GreptimeDB through their native protocols. The architectural difference is on the storage and query side. Instead of three logs-metrics-traces silos with three query languages, the same SQL surface answers questions across all three signals on the same data layer. The unified observability storage architecture covers the design in detail.
Full-Text Index + SQL: Sub-Second on Massive Logs
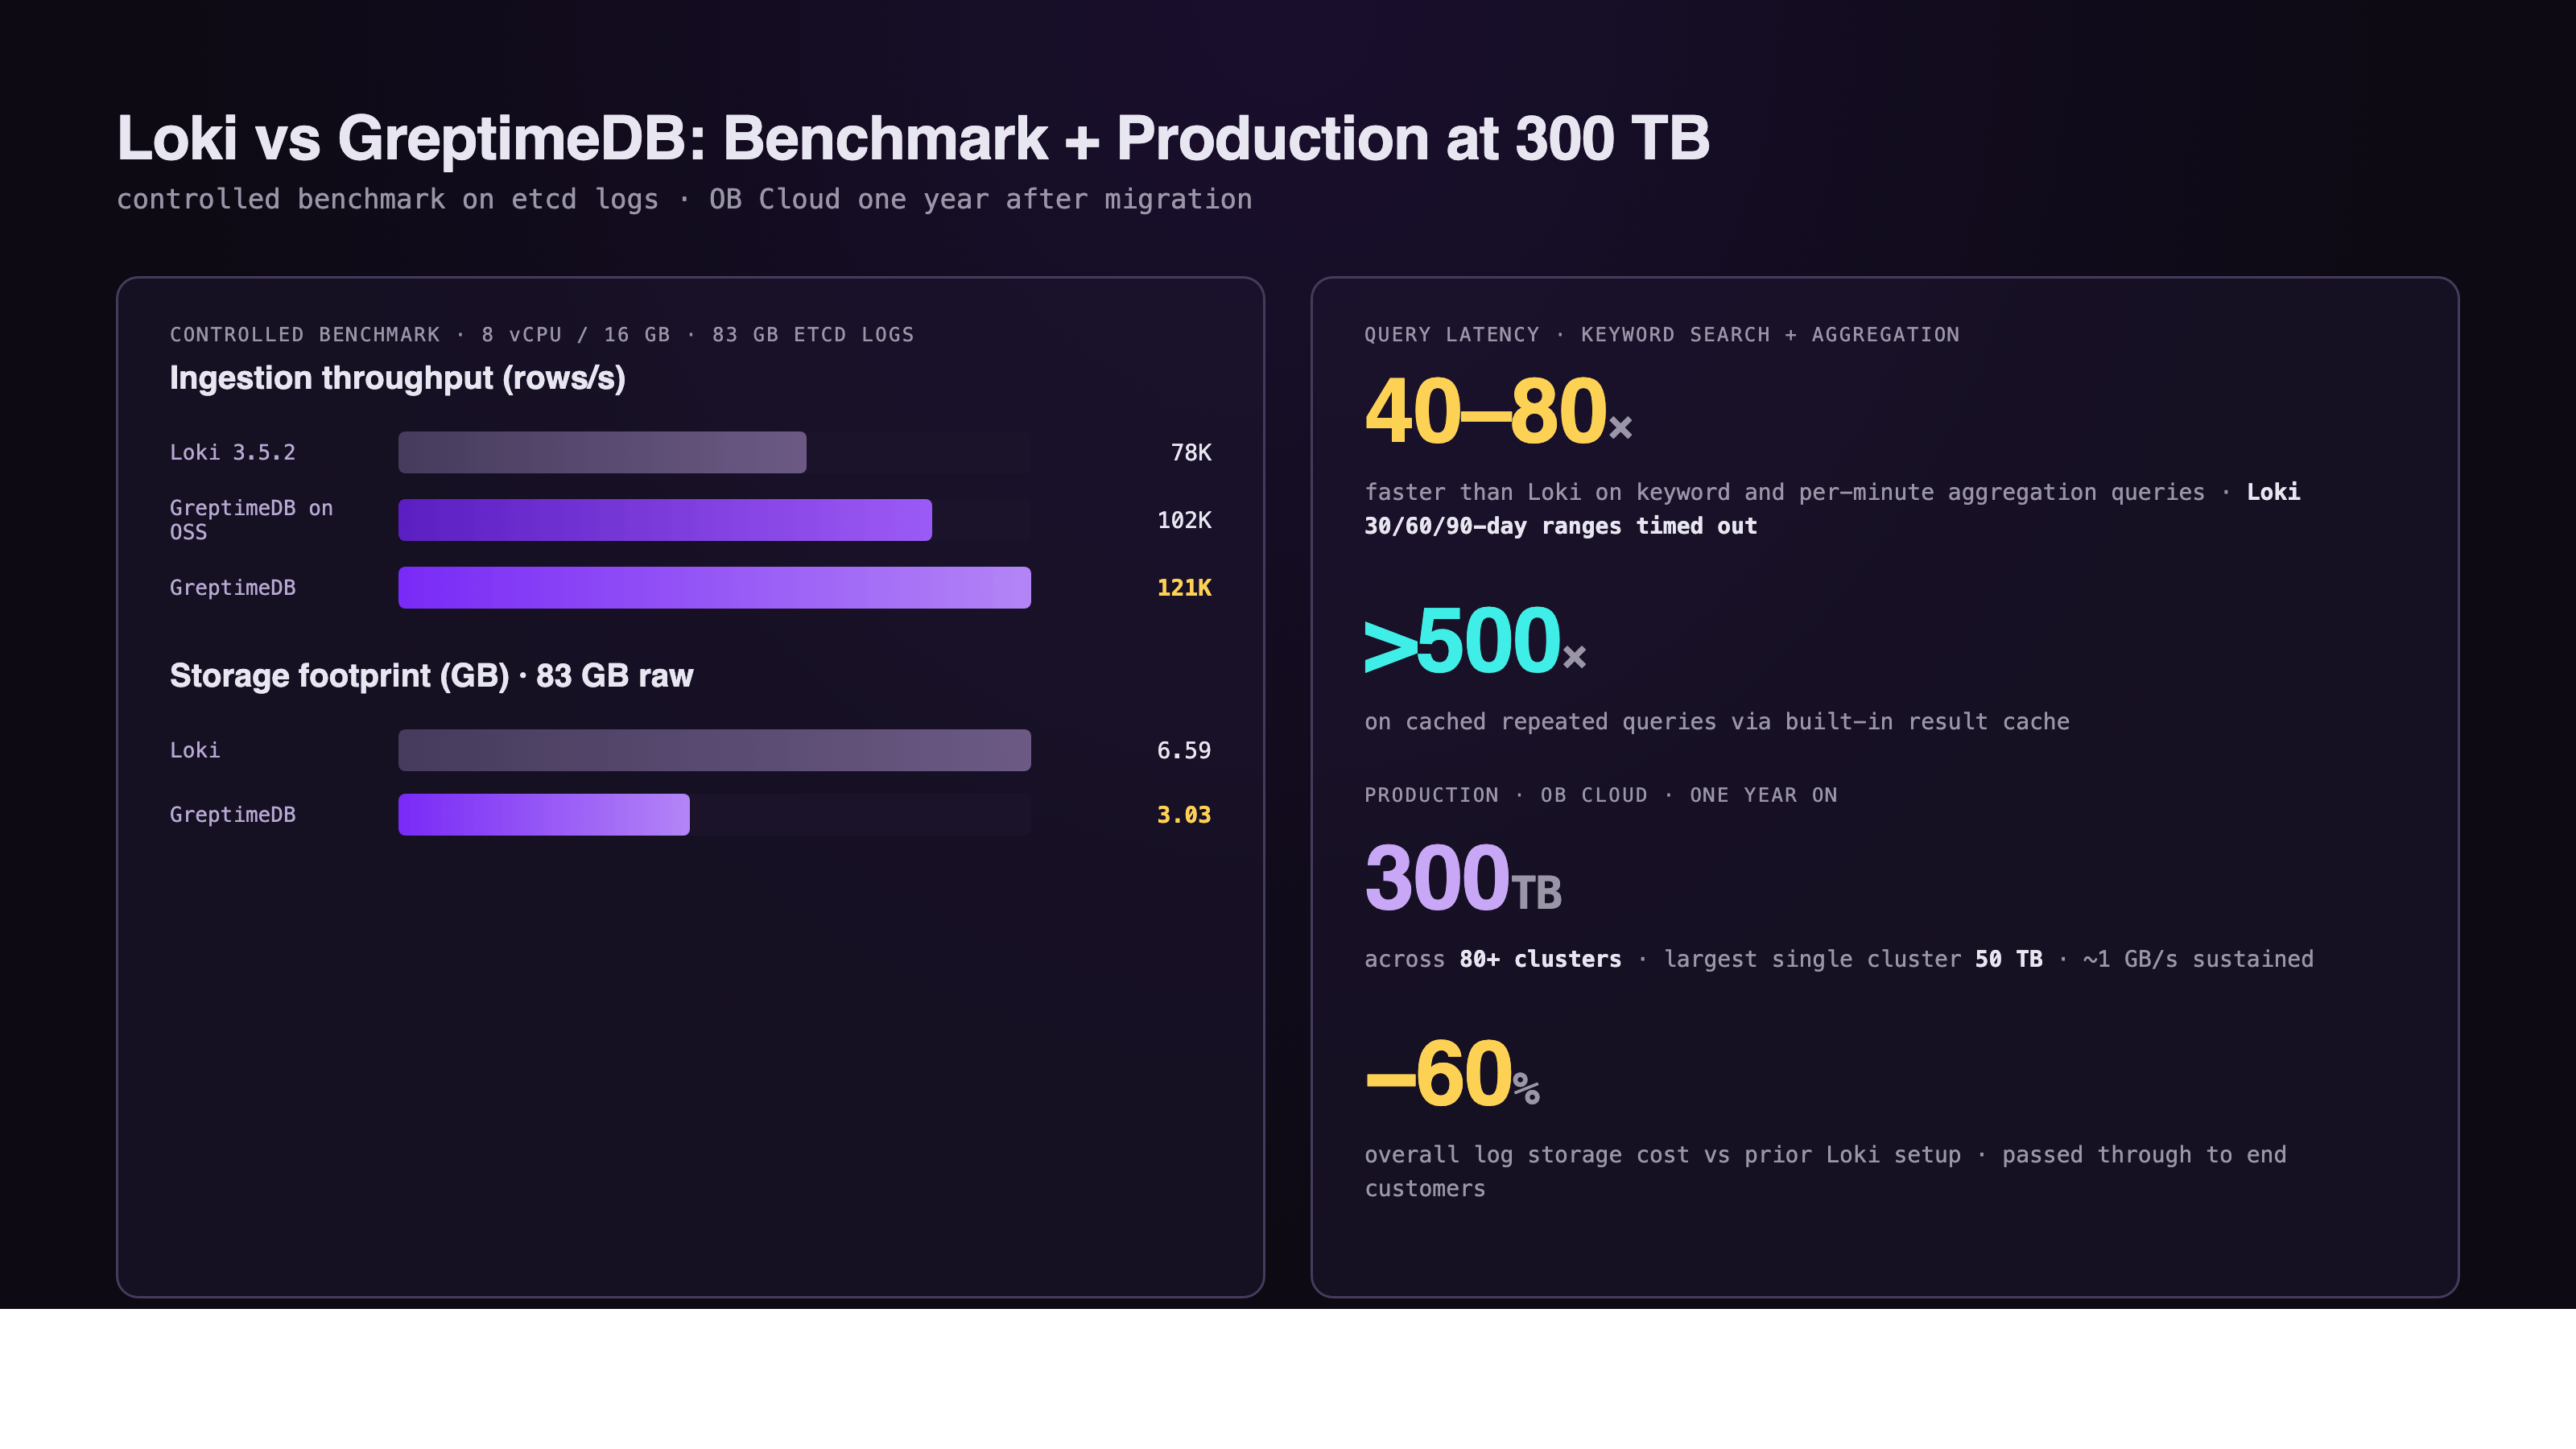
A controlled benchmark on etcd cluster logs (~83 GB of NDJSON, three months of production data, 8 vCPU / 16 GB constraints on each engine) compared GreptimeDB and Loki head to head. Results from the Beyond Loki performance report:
- Ingestion throughput: GreptimeDB at 121K rows/s, Loki at 78K rows/s, about 1.5× higher. With object storage (Alibaba Cloud OSS) as the backend, GreptimeDB still sustained 102K rows/s.
- Keyword search and per-minute aggregation: 40–80× faster than Loki on common log query patterns. Loki's 30-day, 60-day, and 90-day range queries timed out in the test and were excluded from the chart.
- Cached queries: For repeated query patterns, GreptimeDB's result cache delivered >500× speedup over Loki.
- Storage: GreptimeDB compressed the 83 GB raw dataset to 3.03 GB (3% compression ratio). Loki compressed the same data to 6.59 GB (8%). On object storage, the gap is roughly 50% storage reduction.
The benchmark mirrors what OB Cloud's engineers saw in production after the cutover: queries that previously timed out on Loki now return in sub-second to single-second latency, and the log viewer's default time range went from minutes to hours and days.
OB Cloud at 300 TB: One Year On
A year after migrating from Loki, OB Cloud's GreptimeDB deployment looks like this:
- 80+ GreptimeDB clusters in production, one per region per cloud.
- 300 TB of log and SQL audit data stored under a 7-day retention policy. Largest single cluster holds 50 TB.
- ~1 GB/s sustained average write throughput across the fleet.
- Overall log storage cost down by more than 60% compared with the previous Loki setup.
- SQL audit pricing for OB Cloud's end customers was lowered accordingly, passing through the >60% savings on SQL audit cost.
- Same write protocol, SQL query interface, and operational experience on every cloud. The layer above doesn't have to know which cloud the cluster is running on.
The win is partly architectural (full-text index, columnar compression, object storage) and partly operational (one engine instead of separate stacks per cloud, K8s-native deployment, SQL as the unified query surface). At this scale OB Cloud has since moved to GreptimeDB Enterprise for read replicas, intelligent tiered cache, and auto-scaling, but the foundational migration ran on the open-source engine.
Migration Path
The Loki comparison page documents an incremental cutover that fits inside one week of focused work:
- Redirect ingest endpoint (~30 minutes). Switch Promtail / Fluent Bit / Vector output to the GreptimeDB Loki Push API endpoint with no downtime.
- Grafana datasource (~1 hour). Replace the Grafana datasource. Existing Explore workflows and dashboards continue to work.
- Backfill history (1–3 days). Export Loki chunks from object storage and bulk-import while live ingestion continues in parallel.
- Decommission Loki (~2 weeks). After parity validation, gradually shut down Loki components and keep GreptimeDB as the primary log backend.
Existing agents (Promtail, Fluent Bit, Vector, OpenTelemetry) keep writing through unchanged because GreptimeDB accepts their native protocols.
When Loki Still Wins
This is an alternative-at-scale comparison, not a "Loki is bad" argument. Loki remains the better choice for:
- Small to mid-volume logging with label-driven workflows. If queries are dominated by label filters and the body-search workload is low, Loki's labels-only index is genuinely cheap and operationally simple.
- Pure Grafana ecosystem investment. Teams running Loki + Mimir + Tempo end-to-end on the Grafana stack, with deep LogQL expertise, face the smallest delta from staying.
- Lightweight, single-cluster deployments. The single-binary Loki footprint is hard to beat for non-production or smaller environments.
The case for GreptimeDB as a Loki alternative gets strongest at the point where Loki's labels-only design starts to bite: large body-search workloads, multi-cloud or multi-tenant isolation, log retention measured in months not days, or a roadmap where logs need to share a query surface with metrics and traces.
Conclusion
For teams hitting Loki's labels-only ceiling, GreptimeDB is a direct alternative: full-text and skipping indexes for sub-second keyword search, columnar compression on object storage for the cost story, and SQL plus PromQL on the same engine for the unified observability story. The migration runs through standard agents (Promtail, Fluent Bit, Vector) without rewriting collection.
See the full GreptimeDB vs. Grafana Loki comparison for the feature-by-feature breakdown, the Beyond Loki benchmark report for controlled performance numbers, or the OB Cloud case study for what running it at 300 TB looks like in production.
About Greptime
GreptimeDB is an open-source, cloud-native database purpose-built for real-time observability. Built in Rust and optimized for cloud-native environments, it provides unified storage and processing for metrics, logs, and traces — delivering sub-second insights from edge to cloud at any scale.
GreptimeDB OSS – The open-sourced database for small to medium-scale observability and IoT use cases, ideal for personal projects or dev/test environments.
GreptimeDB Enterprise – A robust observability database with enhanced security, high availability, and enterprise-grade support.
We're open to contributors — get started with issues labeled good first issue and connect with our community.
Stay in the loop
Join our community
Get the latest updates and discuss with other users.


