Prometheus Long-Term Storage in 2026: The Options Compared
Why Prometheus Needs Long-Term Storage
Prometheus is the de facto standard for cloud-native metrics, but its embedded TSDB was built for short retention. The default is 15 days. That's the right call for the scrape-and-alert workflow it was designed for. The problem starts when you need months or years of history, cross-cluster aggregation, or multi-tenant isolation. Local disk can hold a long history in some setups, but it doesn't solve horizontal scale, durability, or a cross-cluster view.
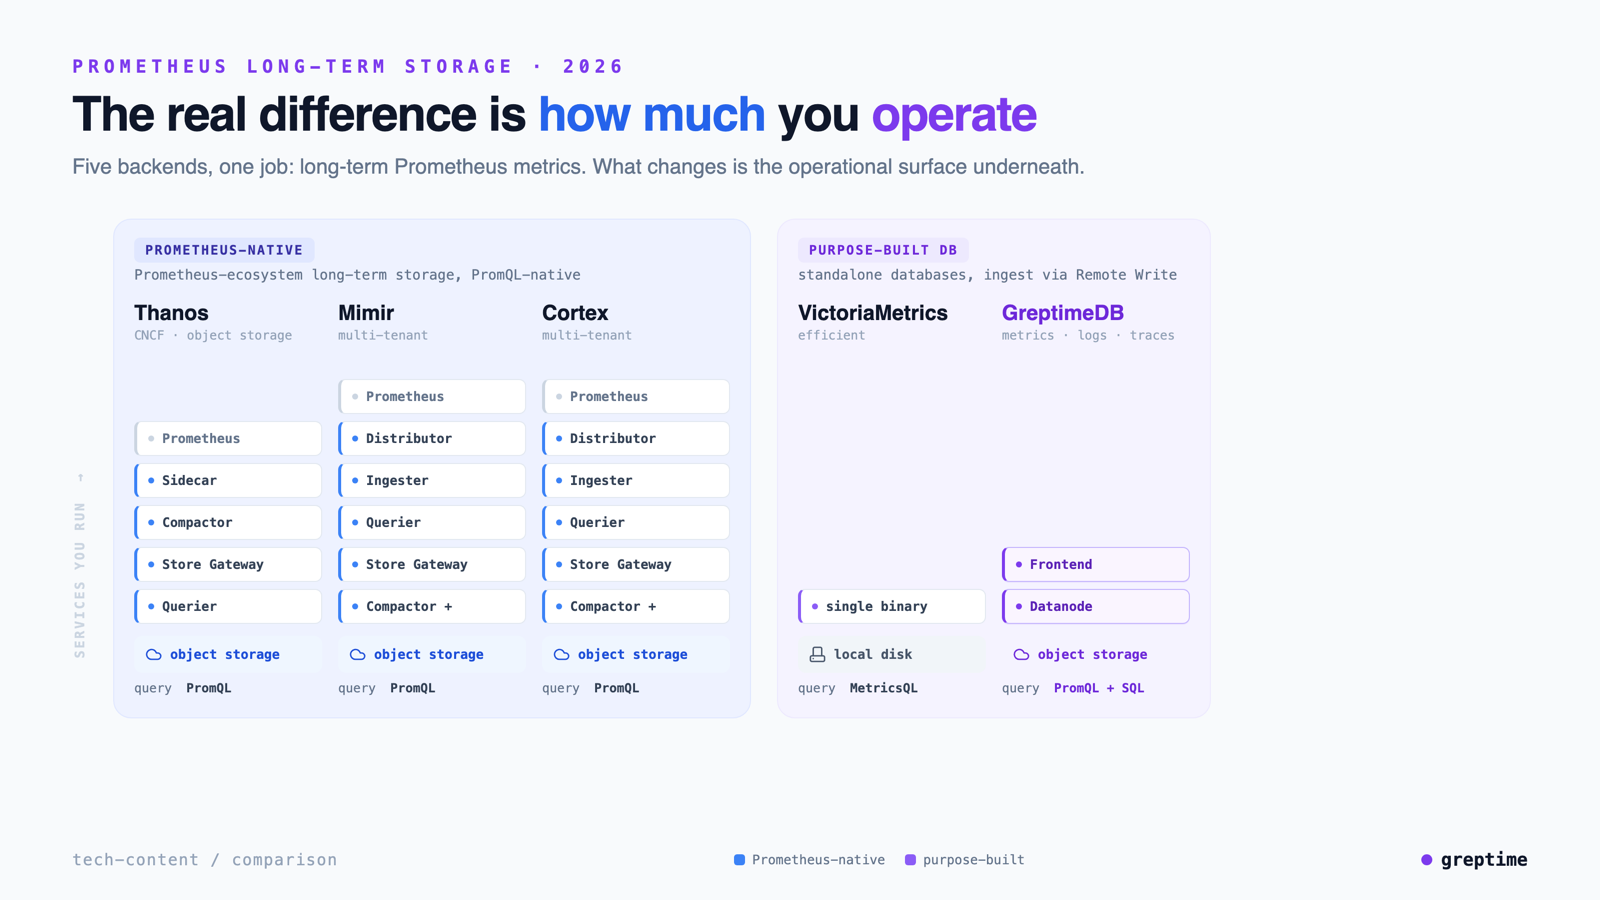
So teams reach for a long-term storage (LTS) backend. By 2026 the field has settled into a handful of genuine options, and they split into two architectural camps: Prometheus-native stacks (Thanos, Mimir, Cortex) that extend the Prometheus/CNCF ecosystem with an object-storage tier and native PromQL, and purpose-built databases (VictoriaMetrics, GreptimeDB) that ingest via Remote Write and serve it from their own engine. The line between them is real but not rigid: Thanos keeps Prometheus as the source of truth and reads its blocks via a sidecar, while Mimir and Cortex are themselves Remote Write backends that take over long-term storage — closer in shape to the purpose-built camp than to Thanos.
This article compares all five on the criteria that actually decide the choice. GreptimeDB is our own project, so treat its spot at the top of the list as a stake in the ground rather than a verdict. Every comparison below is factual, and the "how to choose" section names the cases where the other backends are the better call. This isn't a sponsored ranking.
What to Look For in a Long-Term Storage Backend
Before the options, the criteria that separate them:
- Horizontal scale. Can ingestion and query scale out independently, or is one node the ceiling?
- Object storage as primary. S3/GCS/Azure as the main tier is structurally cheaper than provisioned block storage. Some backends treat it as the hot path; others as a cold archive behind a cache.
- Downsampling and compaction. Long retention is only affordable if old data is compacted and downsampled.
- PromQL compatibility. Your dashboards, recording rules, and alerts are written in PromQL. How close is the backend to upstream semantics?
- Multi-tenancy. One cluster serving many isolated tenants, or one tenant per deployment?
- Operational surface. How many components, release cadences, and failure modes are you signing up to run?
- Beyond metrics. If logs and traces are coming next, does the backend help, or is it metrics-only?
1. GreptimeDB
GreptimeDB is an open-source, cloud-native observability database written in Rust. It speaks the Prometheus Remote Write and Remote Read protocols, runs PromQL on the standard HTTP API, and uses object storage as the primary tier rather than a cold archive. Existing scrapers, Grafana dashboards, and alert rules keep working after switching the Remote Write endpoint.
Architecturally it disaggregates compute and storage: the stateless frontend handles ingest and query routing, datanodes handle region storage and execution, and data lands directly as Parquet on S3, GCS, Azure Blob, OSS, or MinIO with a multi-tier cache for hot reads. The same engine stores metrics, logs, and traces, so the metrics-only ceiling that drives the Thanos/Mimir bolt-on doesn't get rebuilt later for other signals.
Pros
- One database replaces the multi-component LTS stack; the long-term tier is a single system, not five-to-eight services.
- Object storage as the primary tier. The product page cites up to 50× cost reduction versus typical multi-component observability stacks, driven by S3-class storage, columnar compression, and stateless compute scaling.
- High PromQL fidelity: the Rust/DataFusion implementation scores highest on the PromLabs compliance suite outside Prometheus itself, with PromQL compliance now almost 100%.
- Built for high cardinality: the v1.0 default flat SST format delivers 4× write throughput and up to 10× faster queries on millions of series versus the previous layout.
- SQL alongside PromQL on the same data, for the analytical queries (top-N, arbitrary group-by, joins against logs) PromQL was never meant to handle.
Cons
- PromQL is highly compatible but not identical to upstream: the
@modifier is unsupported, computation runs at millisecond precision, and a few multi-input functions differ. Validate edge-case queries before treating it as drop-in. - It's a younger project than Thanos or Mimir, with a smaller ecosystem of war stories and third-party tooling.
- It's a storage and query backend, not a rule engine — alerting and recording rules stay in your local Prometheus.
Best for: teams whose retention has outgrown the local TSDB and who want to collapse the LTS stack into one system — especially if logs and traces are also on the roadmap and consolidating onto one engine is attractive. DeepXplore migrated off Thanos for exactly this reason: the component set was consuming engineering time that should have gone to product.
2. Thanos
Thanos is the CNCF project that pioneered object-storage-backed Prometheus history. It keeps Prometheus as the source of truth and adds a tier of components: a Sidecar that uploads TSDB blocks to object storage, a Compactor that merges and downsamples them, a Store Gateway that serves historical reads, and a Querier that fans out across live Prometheus and the store tier for a global view.
Pros
- Mature, CNCF-incubating, widely deployed, with a deep operational knowledge base.
- Keeps Prometheus fully native: no query-semantics delta, since Prometheus answers the recent window.
- Global query view across many Prometheus instances and clusters.
Cons
- The component set (Sidecar, Compactor, Store Gateway, Querier, optionally Receiver and Ruler) is a distributed system to operate, each with its own scaling and failure modes.
- Block upload from the Sidecar is eventually consistent; very recent data can briefly straddle local and object storage.
- Store Gateway query latency over large historical ranges needs caching and tuning to stay acceptable.
Best for: teams committed to a Prometheus-native architecture that want durable object-storage history and a global view, and who are comfortable operating the component set.
3. Grafana Mimir
Grafana Mimir is a horizontally scalable, multi-tenant metrics backend forked from Cortex. Collectors Remote Write into a microservices architecture (Distributor, Ingester, Querier, Store Gateway, Compactor, and more), with object storage underneath and query sharding for performance at very large series counts.
Pros
- Designed for very high active-series counts and strong multi-tenant isolation.
- Query sharding parallelizes heavy PromQL across the cluster.
- First-class fit for teams standardized on the Grafana ecosystem.
Cons
- The largest component count of the options here; running it well is a dedicated operational investment.
- Resource footprint and tuning complexity scale with the deployment.
- Metrics-only: logs (Loki) and traces (Tempo) are separate systems.
Best for: large platform and SaaS teams that need multi-tenant metrics at scale and have the operational capacity to run a microservices backend.
4. Cortex
Cortex is the CNCF project Mimir originally forked from: a horizontally scalable, multi-tenant, Prometheus-compatible store, also Remote Write-based and object-storage-backed. It remains in use, though much of the community's momentum has shifted toward Mimir.
Pros
- Proven multi-tenant, horizontally scalable design with years of production history.
- CNCF project with an established architecture.
Cons
- Operationally complex, in the same microservices family as Mimir.
- Overlaps heavily with Mimir, which absorbed much of the contributor activity; greenfield projects increasingly start with Mimir instead.
Best for: teams already invested in Cortex, or specific multi-tenant SaaS deployments built around it.
5. VictoriaMetrics
VictoriaMetrics is a purpose-built time-series database known for efficiency and a low resource footprint. It runs as a single binary or a cluster (vmagent, vminsert, vmstorage, vmselect), ingests Prometheus Remote Write, and is valued for high compression and fast ingest. It queries with MetricsQL, a PromQL-compatible-but-extended dialect.
Pros
- Efficient ingest and compression with a comparatively light resource footprint.
- A genuine single-binary option, the simplest entry point on this list for small-to-mid deployments.
- Handles high cardinality well and is straightforward to operate at modest scale.
Cons
- MetricsQL is close to PromQL but not identical; some expressions behave differently from upstream.
- The open-source cluster stores on local block storage on vmstorage nodes rather than object storage as the primary tier, which changes the cost and scaling math relative to S3-native designs.
- Metrics-focused; logs (VictoriaLogs) are a separate product.
Best for: cost- and efficiency-focused teams that want a near-drop-in Prometheus replacement with minimal operational overhead and don't need object storage as the primary tier.
Quick Comparison
| Backend | Architecture | Primary storage | Query language | Multi-tenant | Beyond metrics |
|---|---|---|---|---|---|
| GreptimeDB | Single engine, compute/storage disaggregated | Object storage | PromQL + SQL | Yes | Metrics, logs, traces |
| Thanos | Prometheus + sidecar/store components | Object storage (blocks) | PromQL (via Prometheus) | Limited | Metrics only |
| Mimir | Microservices behind Remote Write | Object storage | PromQL | Yes (strong) | Metrics only |
| Cortex | Microservices behind Remote Write | Object storage | PromQL | Yes | Metrics only |
| VictoriaMetrics | Single binary or cluster | Local block storage | MetricsQL (PromQL-like) | Limited | Metrics only |
How to Choose
Staying Prometheus-native is the priority. If your recording rules, alert pipelines, and SRE tooling are built end-to-end on Prometheus internals and you want the smallest semantic delta, Thanos keeps Prometheus answering queries and adds object-storage history behind it. The cost is the component set.
Multi-tenant metrics at very large scale. Mimir is purpose-built for this, especially inside the Grafana ecosystem. Replacing a tuned Mimir cluster purely for storage savings is rarely a clean win; adopt it when tenant isolation and horizontal scale are the hard requirements.
Efficiency with minimal ops. VictoriaMetrics is the lightest to run and a near-drop-in Prometheus replacement. It's the pragmatic choice when the workload is metrics-only and local-disk storage economics are acceptable.
Collapsing the stack, controlling cost, or unifying signals. GreptimeDB is the strongest fit when the operational surface of a multi-component stack is competing with the product roadmap, when object-storage cost is the driver, or when logs and traces are coming next and you'd rather not run three separate systems. The trade-off to weigh is a younger ecosystem and a small set of PromQL edge cases.
The honest summary: the Prometheus-native stacks win when staying inside Prometheus's exact semantics and ecosystem is non-negotiable. The purpose-built databases win when the storage tier itself, its cost, its scale, its operational weight, or its single-signal ceiling, has become the problem you're trying to solve.
If GreptimeDB fits the shortlist, the migration guide walks through the Remote Write cutover, and the architectural comparison covers the Thanos/Mimir trade-off in depth.
About Greptime
GreptimeDB is an open-source, cloud-native database purpose-built for real-time observability. Built in Rust and optimized for cloud-native environments, it provides unified storage and processing for metrics, logs, and traces, delivering sub-second insights from edge to cloud at any scale.
- GreptimeDB OSS: the open-source database for observability and IoT workloads, with compute-storage disaggregation and object storage as the primary tier.
- GreptimeDB Enterprise: adds operational features for production scale, including bulk ingestion, auto-repartition, read replicas, LDAP/RBAC, a management console, and 24/7 expert support.
Stay in the loop
Join our community
Get the latest updates and discuss with other users.


