Prometheus Long-Term Storage Alternative: Why GreptimeDB Replaces Thanos and Mimir
Introduction
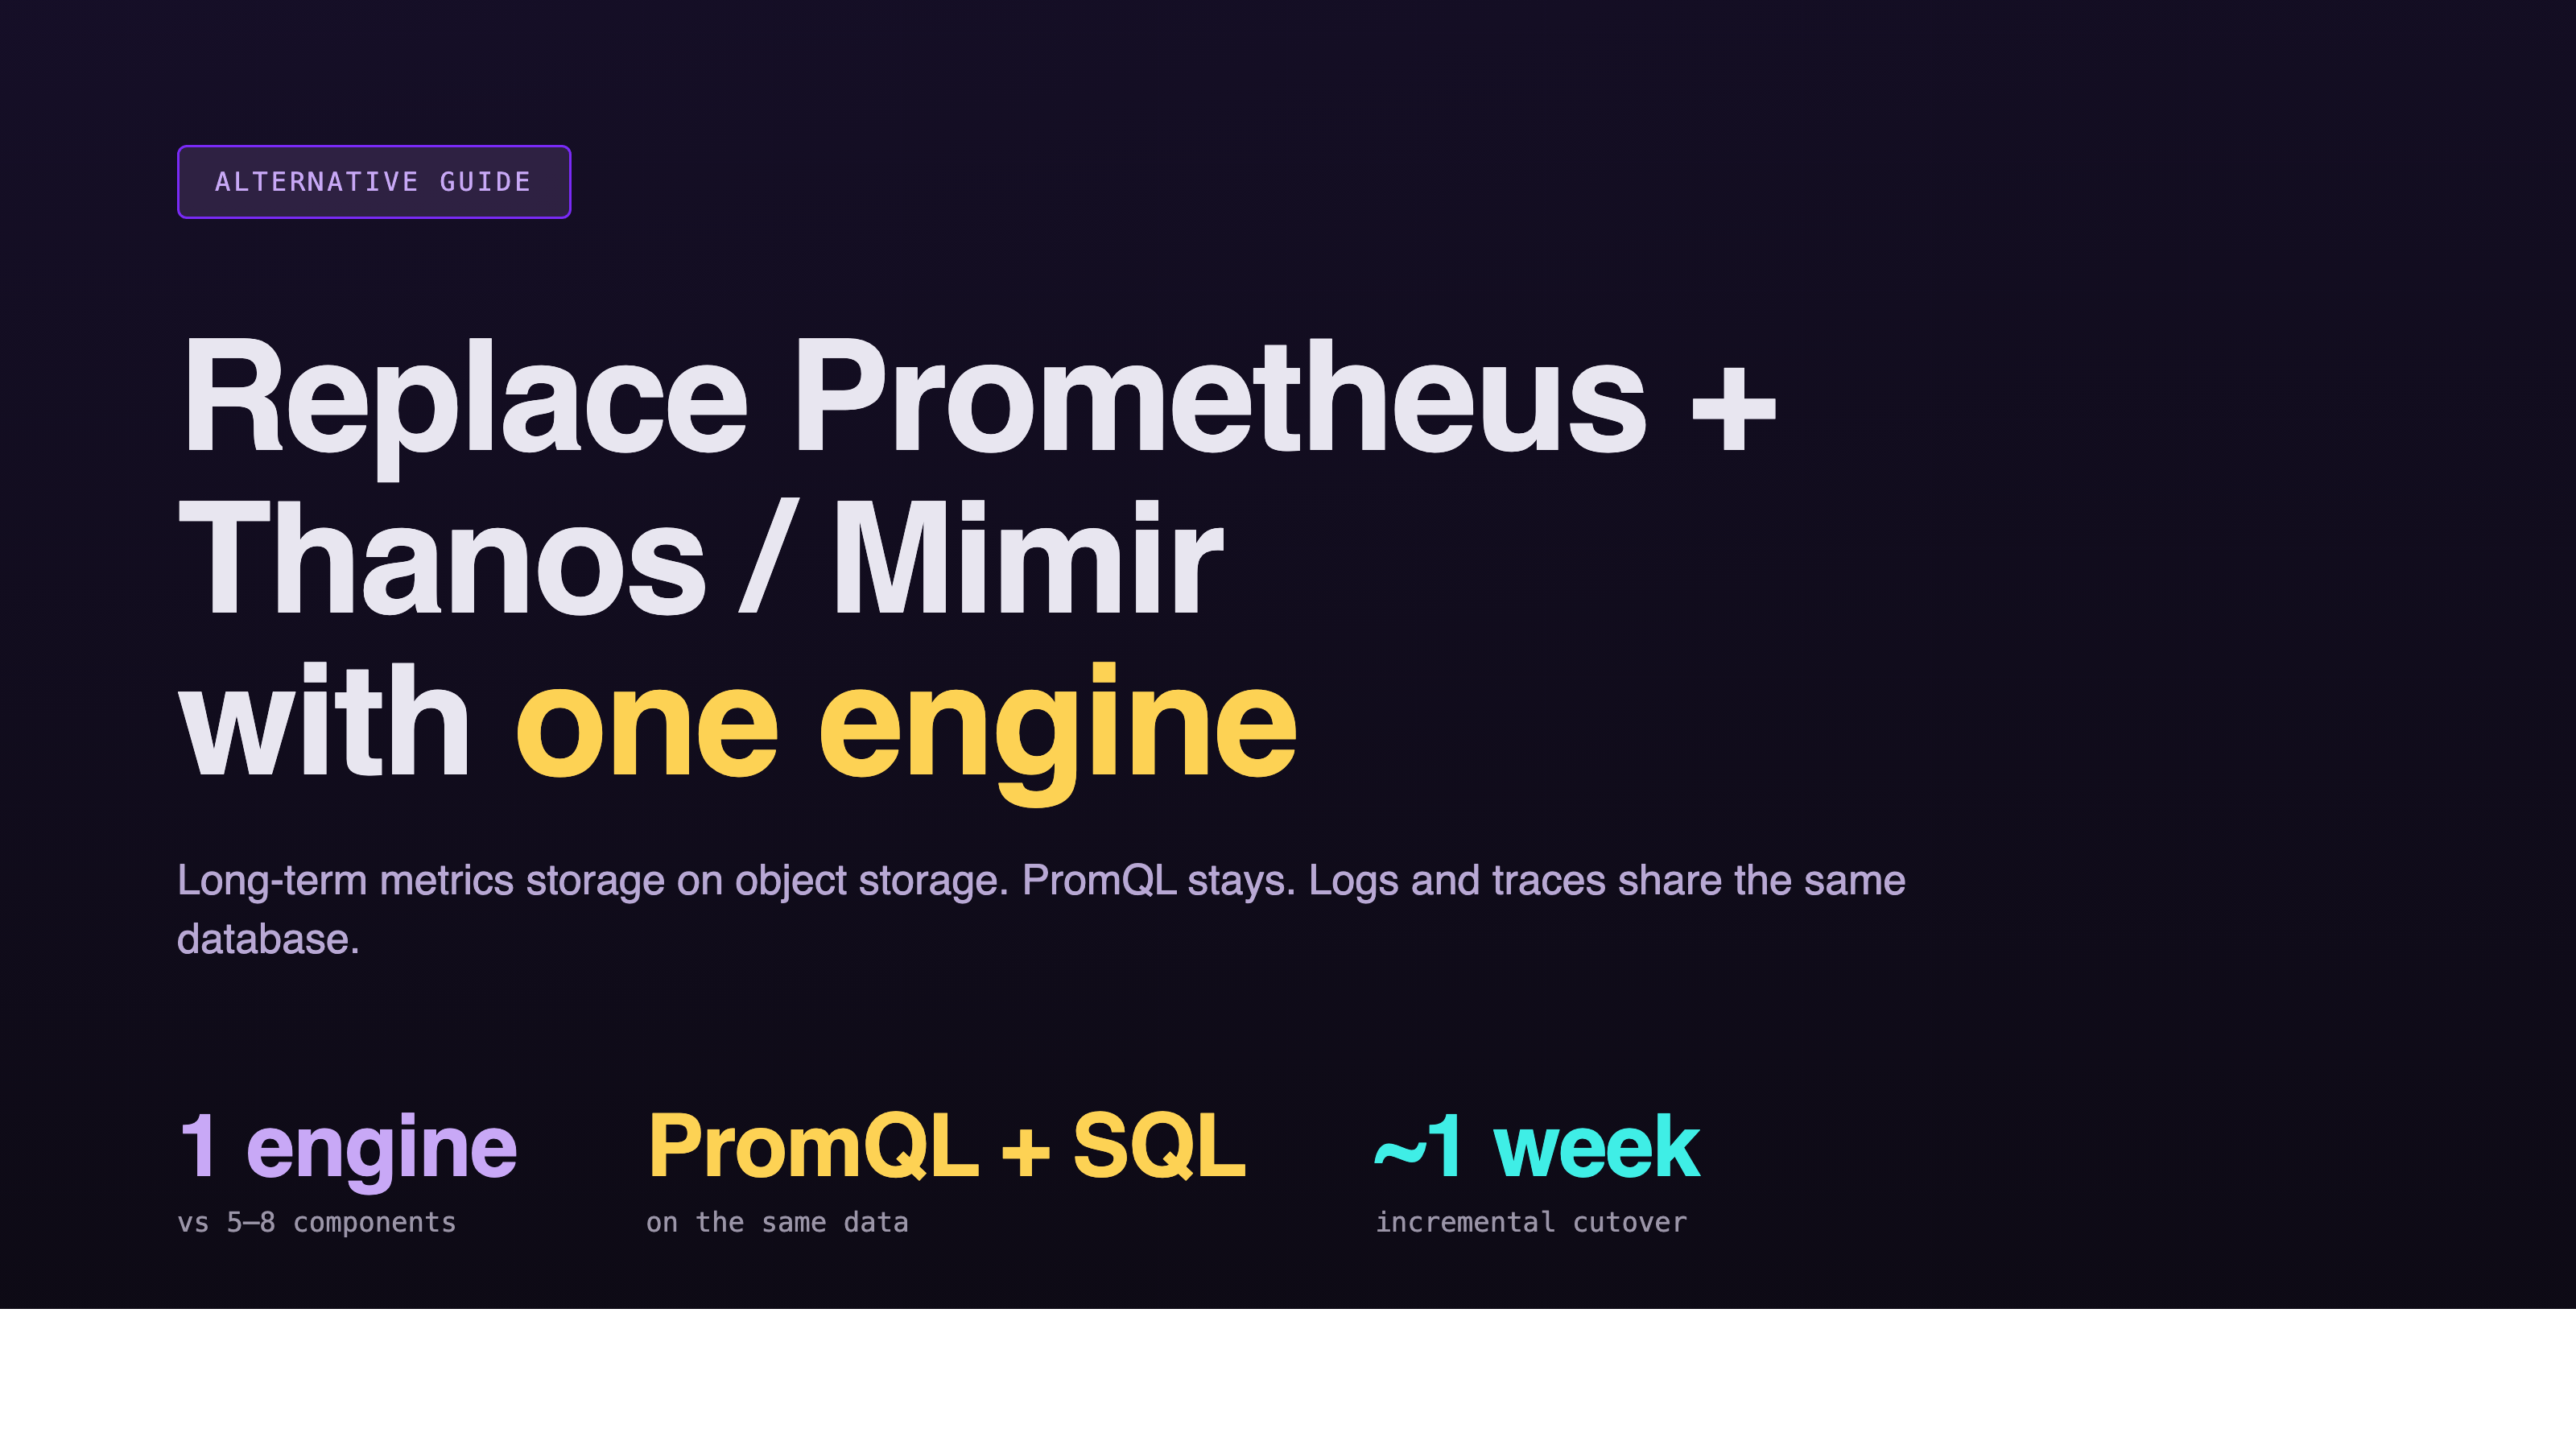
Prometheus is the de facto standard for cloud-native metrics. The embedded TSDB is tuned for short retention and modest cardinality, which is exactly the right call for the scrape-and-alert workflow it was designed for. The trade-off lands when teams need months or years of retention, multi-tenant isolation, or cross-cluster aggregation. That's when Thanos or Mimir get bolted on, and the operational footprint quietly grows from one process to a five-to-eight component distributed system.
GreptimeDB takes a different approach: replace the whole Prometheus + Thanos/Mimir long-term storage stack with a single database that speaks Prometheus Remote Write, runs PromQL natively, and stores data on object storage as the primary tier. PromQL dashboards keep working unchanged. SQL is available for the analytical queries PromQL was never meant to handle. Logs and traces share the same engine, so the metrics-only ceiling that drove the Thanos/Mimir bolt-on doesn't get rebuilt elsewhere.
This article walks through where GreptimeDB is a direct alternative to the Prometheus long-term storage stack, what the architectural trade-offs look like, and how a real migration from Thanos played out.
The Prometheus + Thanos/Mimir Stack: 5-8 Components
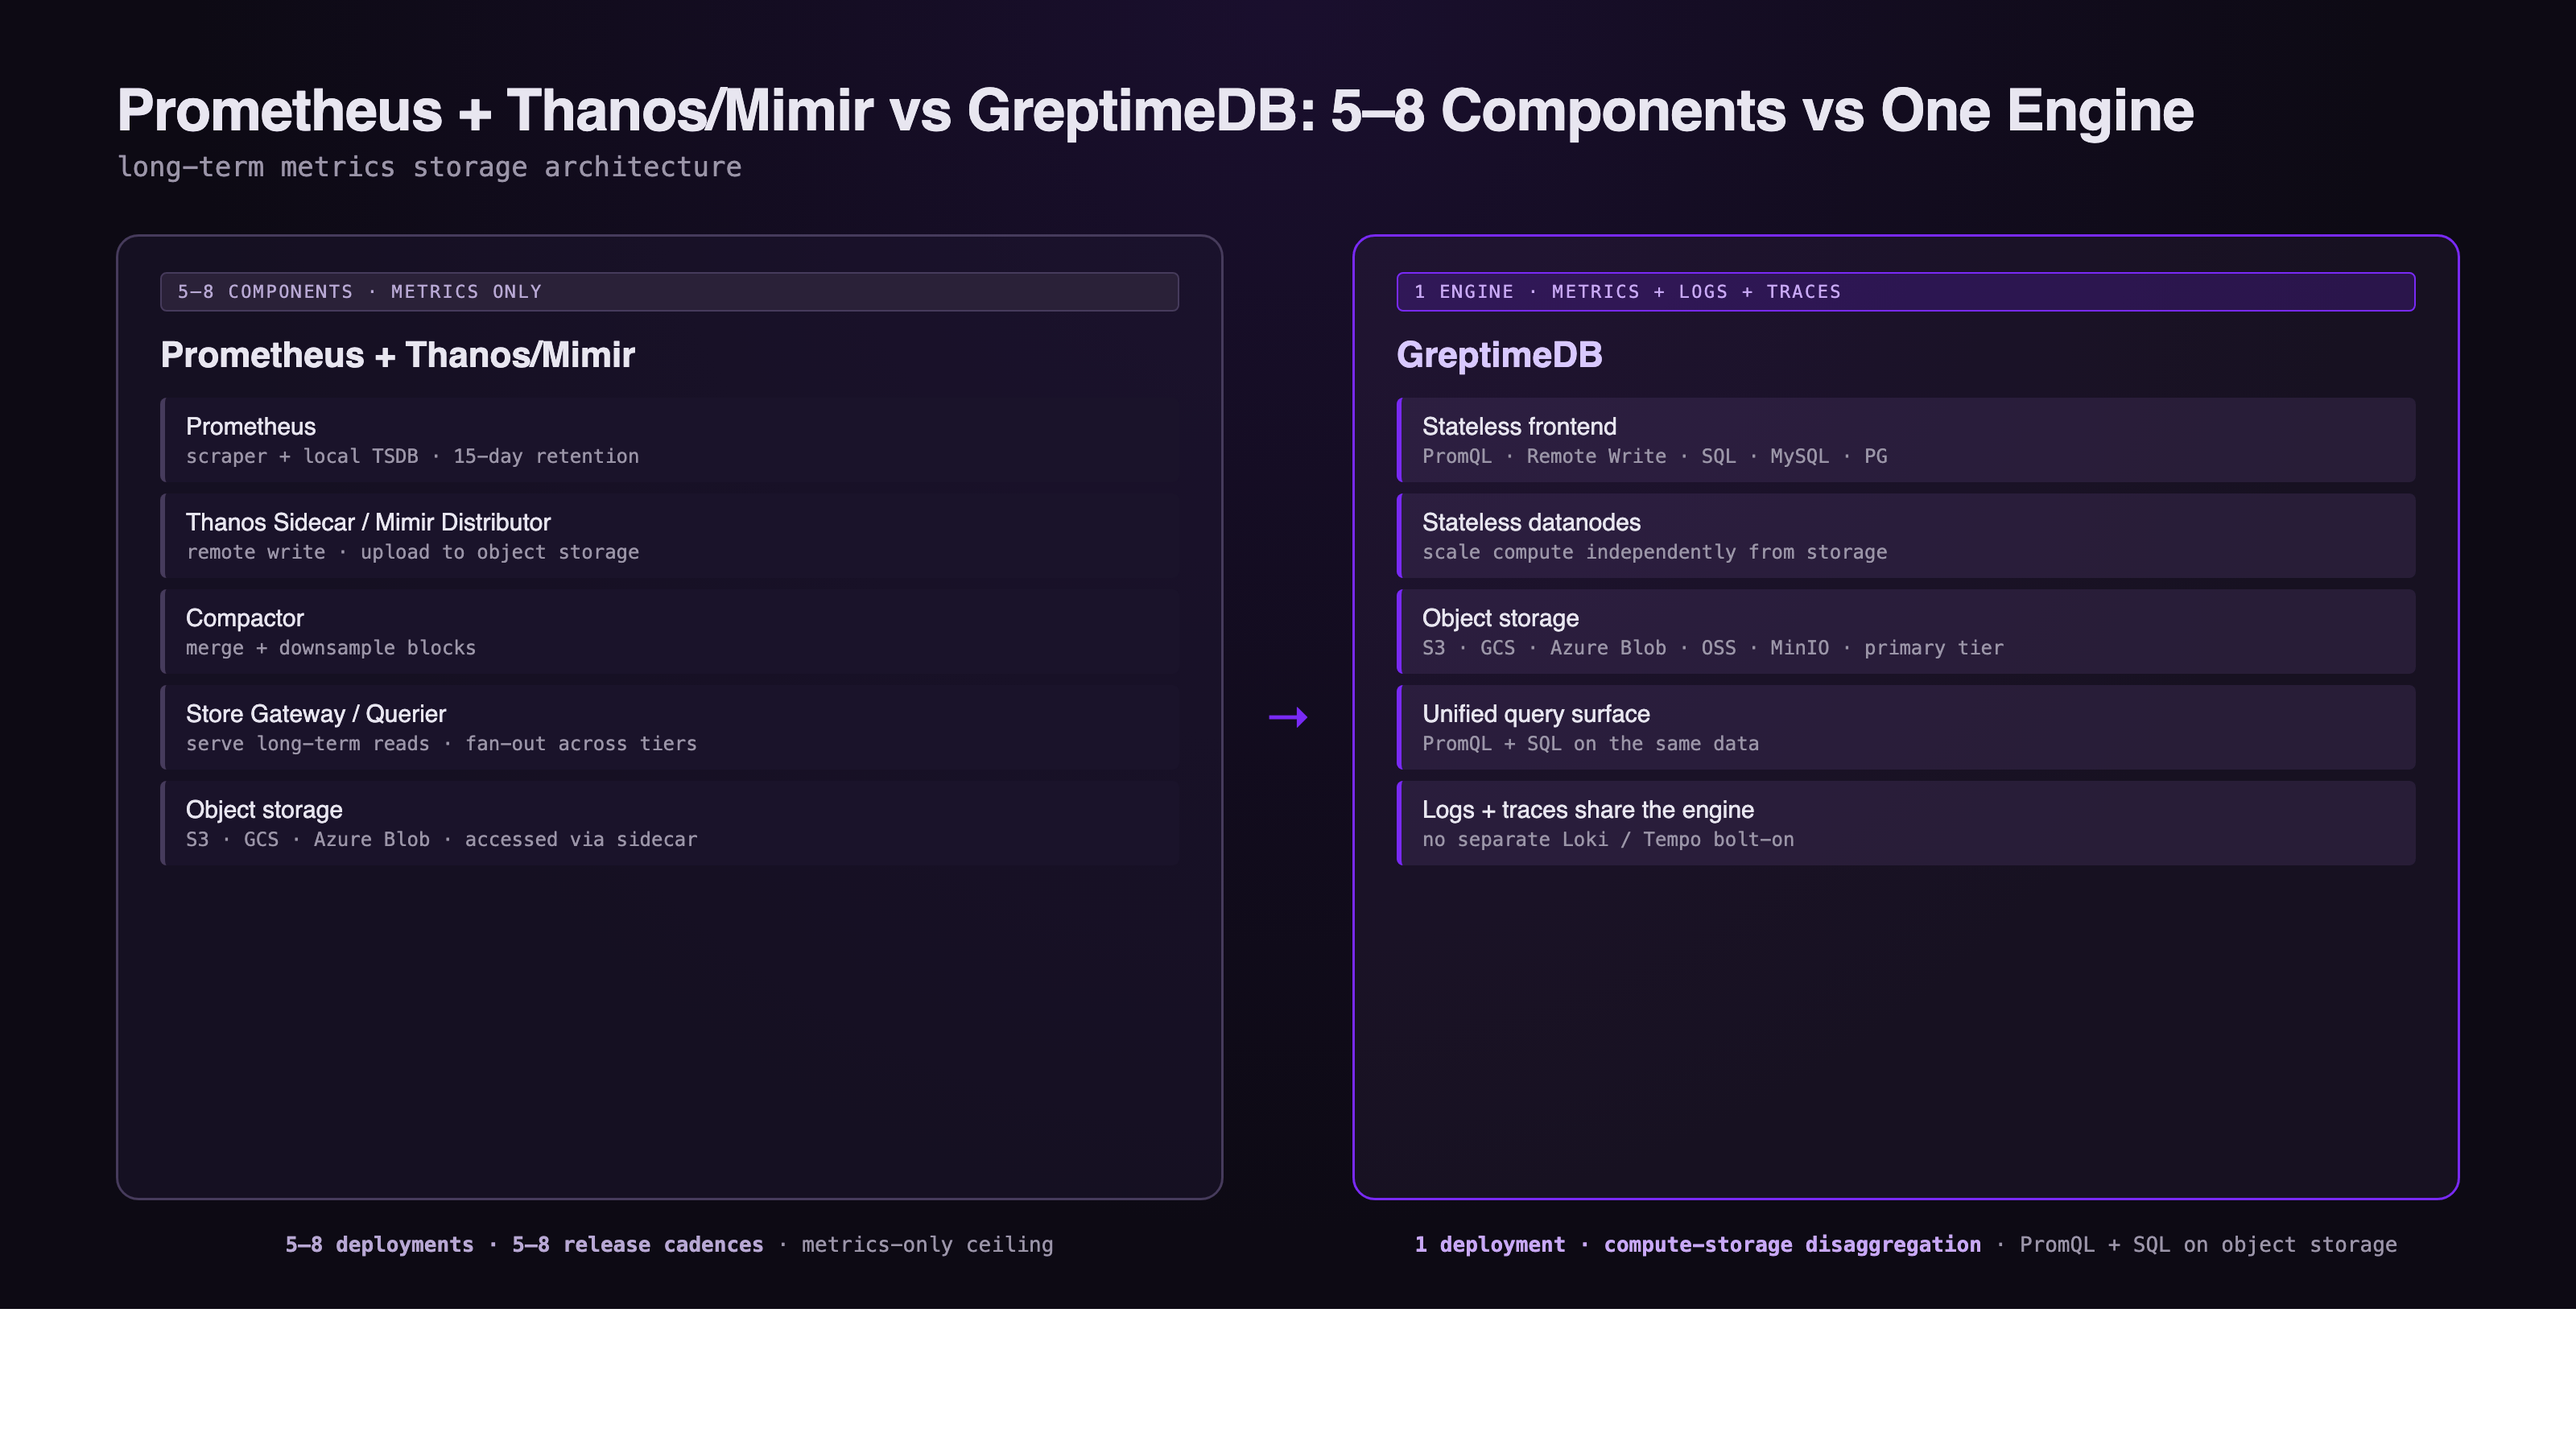
A Prometheus deployment that needs durable, queryable history typically grows into something like this:
- Prometheus itself: scraper plus local TSDB, 15-day default retention.
- Thanos Sidecar (or Mimir Distributor / Ingester): uploads or routes blocks to object storage.
- Compactor: merges and downsamples historical blocks.
- Store Gateway (or Mimir Querier): serves long-term reads from object storage.
- Querier / Query Frontend: fans out queries across Prometheus and the store tier.
- Object storage: S3, GCS, or Azure Blob.
That's a 5-8 component distributed system just to keep one signal (metrics) queryable past two weeks. Each component has its own release cadence, its own scaling story, its own failure mode. As a walkthrough of the long-term storage problem put it, the resulting "factorial level of complexity" is the price of compartmentalizing scrape, ingest, compaction, and query into independent services.
The architecture works. It's also the reason "we want long-term Prometheus storage but don't want to babysit Thanos" is one of the more common observability conversations in the field.
One Engine vs the Long-Term Storage Stack
GreptimeDB collapses the long-term storage stack into one engine:
- Stateless frontend for ingestion and query routing, including a Prometheus-compatible Remote Write / Remote Read endpoint.
- Stateless datanodes holding region replicas, scaled independently from the frontend.
- Object storage (S3, GCS, Azure Blob, OSS, MinIO) as the primary storage tier, not a cold archive behind a sidecar.
- SQL + PromQL as first-class query interfaces on the same data.
Compute and storage are disaggregated. Frontend and datanode tiers scale independently. No Sidecar, no Compactor process, no Store Gateway, no Querier-vs-Prometheus query routing layer. A Grafana dashboard that drove PromQL against Prometheus + Thanos points at GreptimeDB without rewriting expressions. Analytical queries that PromQL was never designed for (joins across labels, ad hoc SQL on historical metrics, correlation with logs and traces) happen inside the same engine.
For teams already running Loki for logs and Tempo for traces, the consolidation goes further: metrics, logs, and traces live on one storage layer instead of three.
PromQL Compatibility: Engaging the Standard
A common worry about leaving Prometheus + Thanos/Mimir is whether a non-Prometheus engine can keep up with PromQL semantics. GreptimeDB's PromQL implementation is written in Rust on Apache DataFusion, and on the PromLabs PromQL compliance test suite it scores the highest among all tested implementations apart from Prometheus itself, covered in the PromCon EU 2025 talk recap.
It helps to read Prometheus as a set of interface standards rather than a single implementation: OpenMetrics for the data format, PromQL for query, Remote Write for transport. Any engine that conforms to those interfaces is part of the Prometheus ecosystem. GreptimeDB conforms to all three. Existing scrape configs, recording rules, Alertmanager routes, and dashboards keep working after switching the Remote Write endpoint.
Case: DeepXplore's Migration from Thanos
DeepXplore, a tech startup focused on AI-driven performance testing, ran Thanos on Kubernetes for long-term Prometheus storage before switching. The motivation was straightforward, in the team's own words:
The installation and maintenance of Thanos clusters is often complex, time-consuming, and requires significant operational overhead.
After moving Prometheus Remote Write to GreptimeDB, the changes the team called out were operational, not benchmark-driven:
- Endpoint switch only. No scrape config or PromQL query rewrite.
- Cluster lifecycle handled by the GreptimeDB Operator, with etcd as the only external dependency.
- Object storage as primary backing. No separate sidecars, compactors, or store gateways to monitor.
- Queries that previously took longer in Thanos returned faster after configuration tuning (table partitioning, cache).
The story isn't "GreptimeDB is faster than Thanos in every benchmark." It's "the operational surface that drove the original switch from local TSDB to Thanos got smaller again, while query latency went the right direction." That's the trade-off worth weighing.
Storage Economics on Object Storage
The cost case for replacing the Thanos/Mimir stack is structural. At current AWS list prices, S3 Standard at ~$0.023/GB/mo sits roughly 3–5× below provisioned SSD EBS (gp3 ~$0.08/GB/mo). Thanos and Mimir already exploit this: historical blocks live on S3, hot data on local disk in front. GreptimeDB takes the same architectural principle and removes the sidecar layer. Data is written directly to Parquet on object storage, with a multi-tier cache for hot reads.
For high-cardinality workloads (millions of unique series from request IDs, pod UIDs, or tenant labels), GreptimeDB v1.0 ships flat format as the default SST layout, delivering 4× write throughput and up to 10× faster queries on millions of series compared with the previous series-oriented layout. High cardinality is the single hardest workload for Prometheus + Thanos to absorb, and it's exactly what object-storage-native columnar engines are built for.
The GreptimeDB Open Source product page summarizes the resulting cost envelope as up to 50× cost reduction versus typical multi-component observability stacks. The number depends on retention, cardinality, and query mix; the architectural drivers (object storage as primary, columnar compression, stateless compute scaling) are stable.
Migration Path
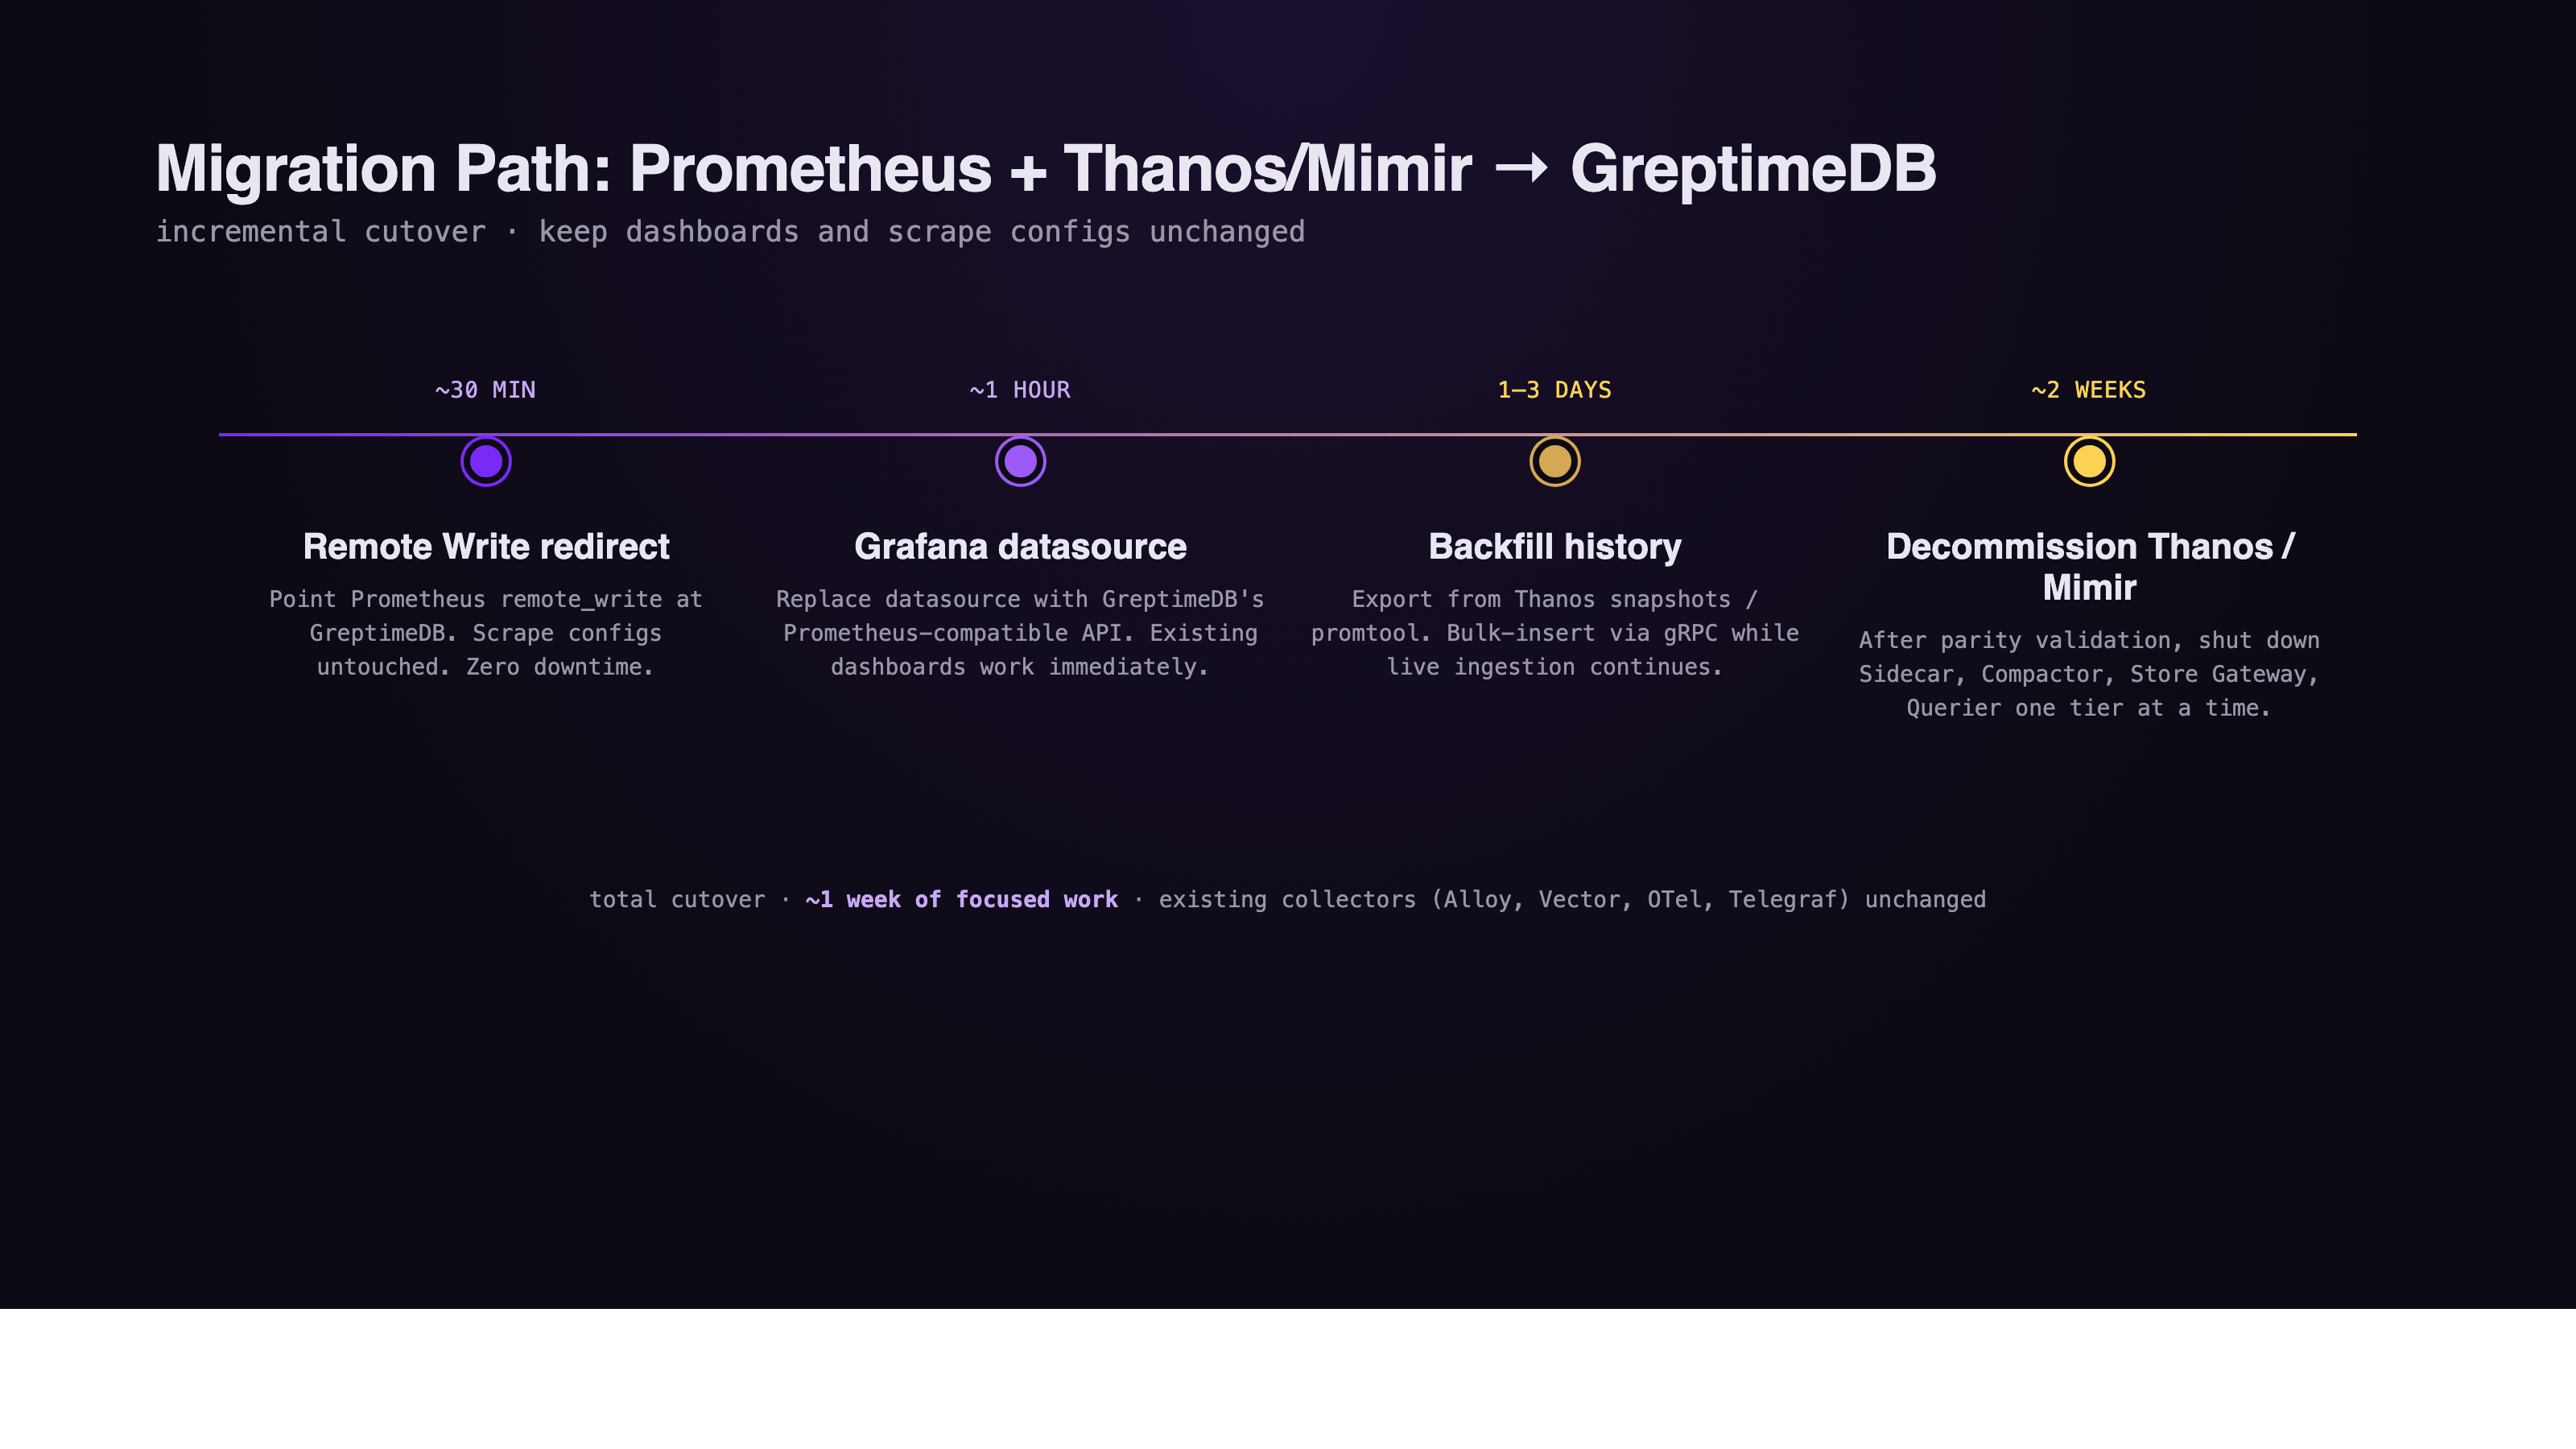
The Prometheus comparison page documents an incremental cutover that fits inside one week of focused work:
- Remote Write redirect (~30 minutes). Point Prometheus
remote_writeat GreptimeDB. Existing scrape configs are untouched. Zero downtime. - Grafana datasource (~1 hour). Replace the Grafana datasource with GreptimeDB's Prometheus-compatible API. Existing dashboards work immediately.
- Backfill history (1–3 days). Export historical data from Thanos snapshots or
promtooland bulk-insert via gRPC while live ingestion continues. - Decommission Thanos / Mimir (~2 weeks). After parity validation on real dashboards and alerts, shut down Thanos Sidecar, Compactor, Store Gateway, and Querier (or the corresponding Mimir components) one tier at a time.
Existing collectors keep writing through unchanged because GreptimeDB accepts their native protocols: Prometheus agents, Grafana Alloy, Vector, OpenTelemetry, Telegraf.
When Prometheus + Thanos/Mimir Still Wins
This is an alternative-for-long-term-storage comparison, not a "Thanos and Mimir are bad" argument. The Prometheus stack remains the better choice for:
- Pure Prometheus ecosystem investment. Teams whose recording rules, alert pipelines, and SRE tooling are built end-to-end on Prometheus internals, with no plan to consolidate logs or traces, face the smallest delta from staying.
- Mature multi-tenant Mimir deployments. Mimir's tenant isolation and query federation are the reason a number of large platforms adopted it. Replacing a tuned Mimir cluster purely for storage savings is rarely a clean win.
- Strict native Prometheus semantics. A handful of edge cases in recording rules, exemplars, or experimental Prometheus features may behave differently outside Prometheus itself. Compliance score is the highest outside Prometheus, not identical to it.
The case for GreptimeDB as a Prometheus long-term storage alternative gets strongest when the team is already running, or about to add, a separate stack for logs and traces, and when the operational surface of Thanos sidecars, compactors, and store gateways is starting to compete with the actual product roadmap.
Conclusion
For teams looking at Prometheus long-term storage, the choice is no longer "stay local-only" or "adopt the five-to-eight component Thanos / Mimir stack." A PromQL-compatible, object-storage-native engine that replaces the whole storage tier with one database, and that lets logs and traces share the same engine, is a real third option.
See the full GreptimeDB vs. Prometheus comparison for the feature-by-feature breakdown, or deploy GreptimeDB on Kubernetes to test it against your current Prometheus + Thanos or Mimir setup.
About Greptime
GreptimeDB is an open-source, cloud-native database purpose-built for real-time observability. Built in Rust and optimized for cloud-native environments, it provides unified storage and processing for metrics, logs, and traces — delivering sub-second insights from edge to cloud at any scale.
GreptimeDB OSS – The open-sourced database for small to medium-scale observability and IoT use cases, ideal for personal projects or dev/test environments.
GreptimeDB Enterprise – A robust observability database with enhanced security, high availability, and enterprise-grade support.
We're open to contributors — get started with issues labeled good first issue and connect with our community.
Stay in the loop
Join our community
Get the latest updates and discuss with other users.


