On this page
In the world of monitoring systems, Logs and Metrics are often treated separately. However, if we take a step back and examine these two kinds of data from a higher perspective, we will find that they are essentially both events. This realization opens up a new pathway to simplify and optimize event management within monitoring systems.
Understanding Events
An event in a monitoring system refers to a specific occurrence that occurs within the system at a particular moment.
At the core, an event is defined by three fundamental components: Timestamp, Payload, and Context:
- Timestamp: records when the event occurred;
- Payload: contains the details of the event;
- Context: provides supplementary information to understand the event.
For example, let's look at the CloudEvents format:
python
cloud_event = {
    "specversion": "1.0",
    "type": "example.event",
    "source": "example-source",
    "id": "12345",
    "time": "2022-01-01T12:00:00Z",
    "data": {
        "message": "Hello, CloudEvents!"
    }
}
Here, time corresponds to the event's timestamp, data corresponds to the event's payload, and other fields, such as subject and type, serve as context information.
Logs as Events
Logs are detailed records of system activities. They contain unstructured messages that often require sophisticated searching mechanisms to extract meaningful insights.
By considering logs as events, the content of the recorded messages becomes the payload. This allows us to unify the way we handle log data with other types of events.
Let's take NGINX access logs as an example:
sql
127.0.0.1 - - [10/Oct/2021:13:55:36 +0000] "GET /index.html HTTP/1.1" 200 612 "-" "Mozilla/5.0 (X11; Ubuntu; Linux x86_64; rv:93.0) Gecko/20100101 Firefox/93.0"We can model it into an event:
json
{
    "type": "nginx.access",
    "source": "nginx-server-01",
    "time": "2021-10-10T13:55:36+00:00",
    "ip": "127.0.0.1",
    "user": "-",
    "status": 200,
    "bytes": 612,
    "referrer": "-",
    "user_agent": "Mozilla/5.0 (X11; Ubuntu; Linux x86_64; rv:93.0) Gecko/20100101 Firefox/93.0",
    "data": "GET /index.html HTTP/1.1"
}
Here, the data corresponds to the payload, and other info such as referrer, ip is the context of the event. Of course, there is time for timestamp.
Metrics as Events
On the other hand, metrics are structured pieces of data, typically used for trend analysis and anomaly detection. Metrics convey information through specific fields or values, which can be considered their payload. This structured nature makes metrics ideal for aggregation and statistical analysis.
Take the Prometheus metric for example:
sql
http_requests_total{method="post", handler="upload", status="200"} 1027 1628206800We can model it into an event:
json
{
    "type": "prometheus.metric",
    "source": "prometheus-server-01",
    "id": "3b2a9567-7381-4bca-bfb3-c9238f7d6c52",
    "time": "2021-08-05T11:00:00Z",
    "metric_name": "http_requests_total",
    "value": 1027,
    "method": "post",
    "handler": "upload",
    "status": "200"
}
Here, the value corresponds to the payload, while other fields correspond to context, which are usually called tags of a measurement.
Similarities and Differences between Logs and Metrics as Events
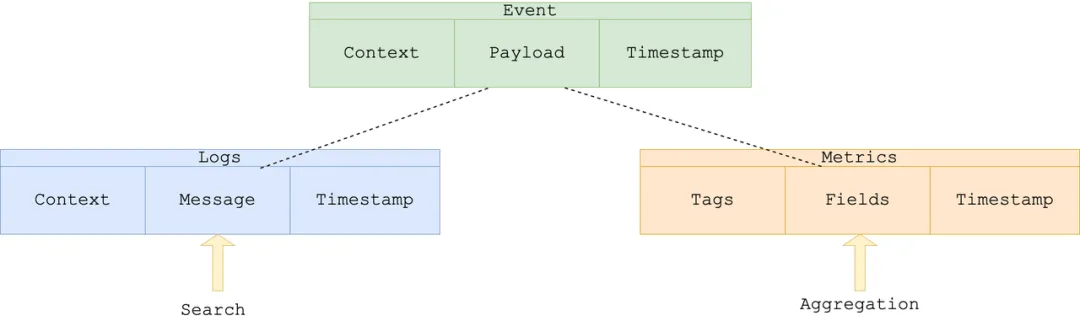
By abstracting both logs and metrics into the broader category of events, we can recognize that they share a common structure but differ in their payloads.
The similarities between the two provide opportunities for unified processing, but the distinction in their payloads is crucial, as different payloads necessitate different capabilities for analysis:
- Log (Text Messages): Require advanced search capabilities to navigate and understand unstructured data.
- Metric (Numerical Values): Depends on aggregation functions for trend analysis and anomaly detection.
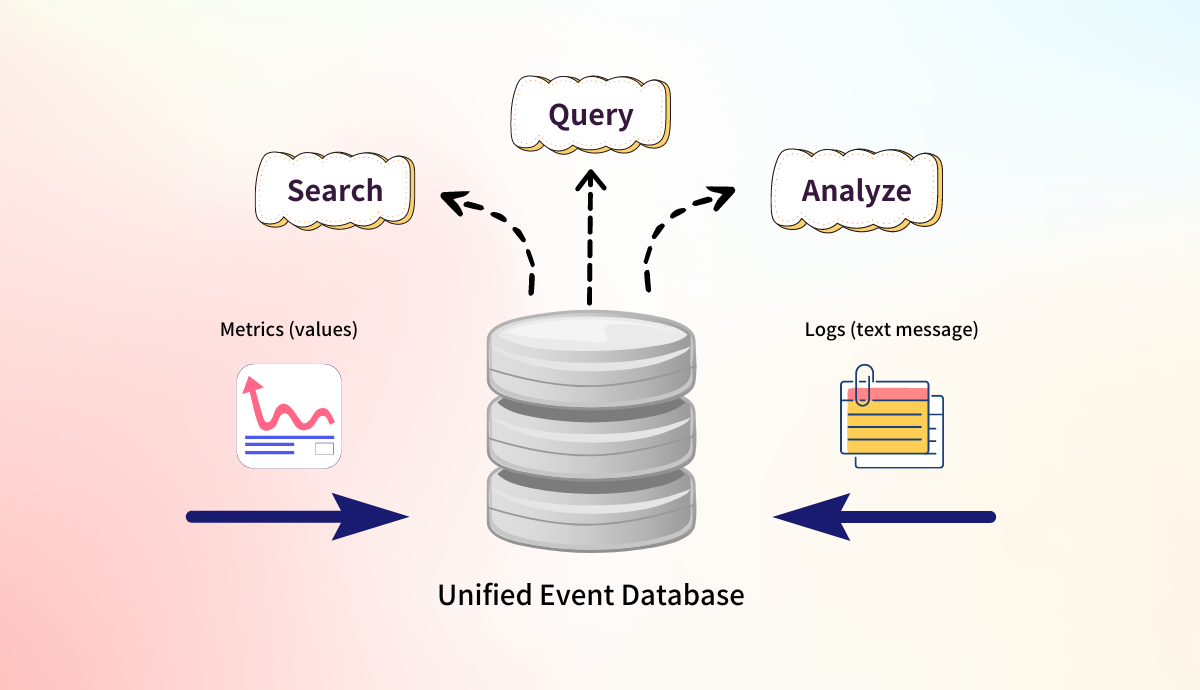
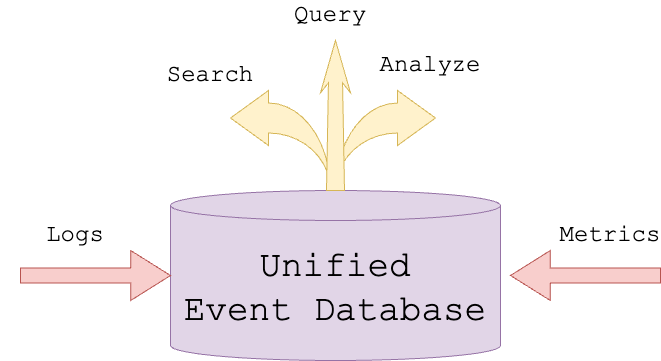
Unified Database for Logs and Metrics
Now, let's imagine the revolution of having a single database that can store all metrics, logs, and events. This unification can significantly enhance our ability to perform correlation analysis across different data sources. For example, root cause analysis becomes more straightforward as all relevant data is available in one place, reducing the need for switching between multiple systems and interfaces.
Advantages of a Unified Database
Enhanced Correlation Analysis: Having all events in one place allows for seamless correlation analysis. This is invaluable for identifying patterns and detecting issues early, thus aiding in root cause analysis and reducing alert fatigue.
Simplified Infrastructure: A single database serving multiple purposes can significantly reduce deployment and maintenance efforts, eliminating the need to build various integrations and shuffle data between multiple systems.
Real-Time Processing and Analysis: A unified database can simplify data processing, provide real-time analytics capabilities, offer faster insights, and enhance decision-making speed.
Cost Efficiency: Consolidating multiple systems into one reduces hardware and software costs, as well as operational overhead.
How GreptimeDB Revolutionizes the Event Management
To achieve the vision of unified event management, GreptimeDB is an excellent starting point. Next, we will introduce how to accomplish this goal using GreptimeDB.
- Ideal Platform for Data Management
GreptimeDB is an open-source, cloud-scale, fast, and cost efficient time series database that excels in handling large volumes of time series data. Completely written in Rust, its architecture provides great abstractions across table engines, storage engines, query engines, and indexing frameworks, making it a solid foundation for our unified approach.
You can find detailed architecture in the contributor guide.
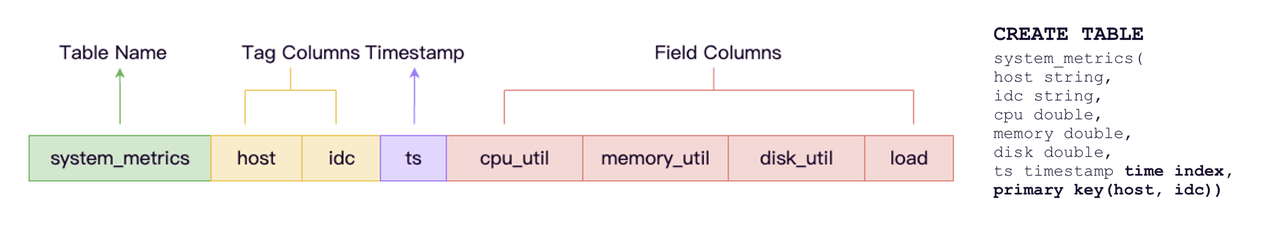
- User-Friendly Data Model
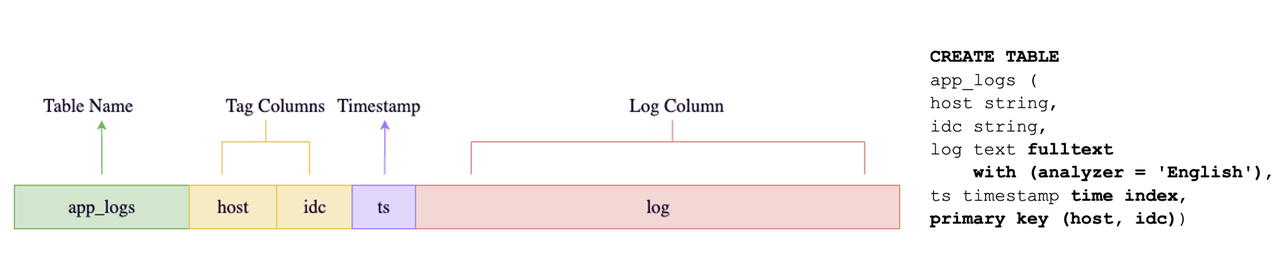
GreptimeDB offers a table abstraction that is intuitive for users familiar with relational databases (RDBMS). This model is also user-friendly for SQL-based analysis, making it easier for users to integrate with the existing data analysis ecosystem and query their data without a steep learning curve. GreptimeDB's table engine models the data, but from the user's perspective, the experience is schemaless.
- Enhancing Text Search Capabilities
To fully realize the vision for unified databases, we need to enhance GreptimeDB to support text columns. By adding tokenization and inverted indexes to these text columns, we can enable powerful search capabilities that allow users to efficiently search through log messages. This enhancement bridges the gap between unstructured logs and structured metrics.
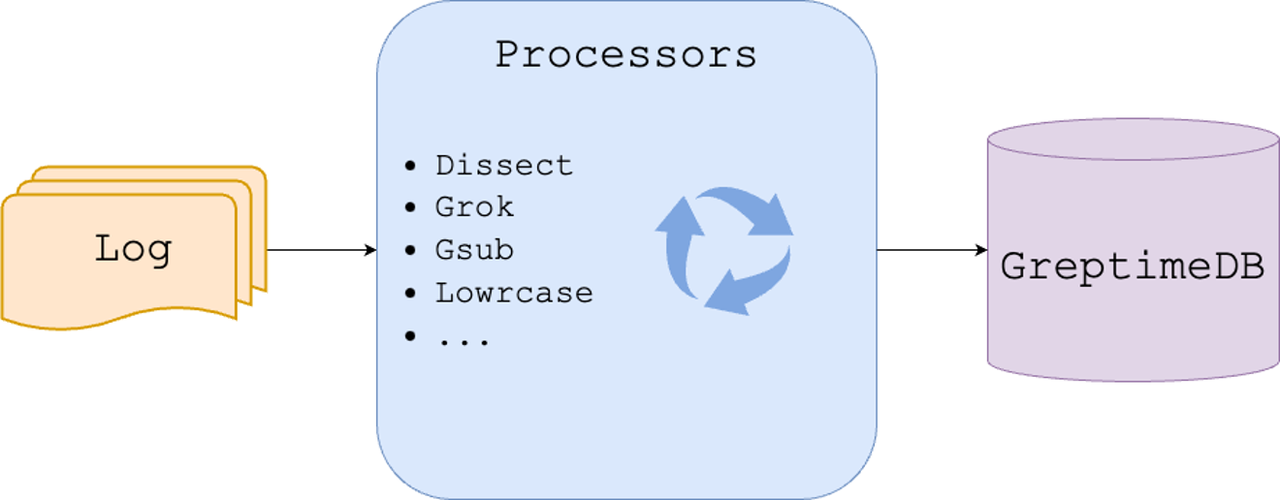
- Supporting Data Ingestion and Transformation
A Log database requires transformation similar to ElasticSearch processors. It consists of multiple stages, each executing tasks like data transformation, filtering, or enrichment. We're now implementing these functions within GreptimeDB.
We can even extract or compute metrics from logs.
For instance, determining the frequency of error occurrence in applications is crucial as excessive error is a clear indicator of issues.
While GreptimeDB's continuous aggregations can manage these requirements, we still need the SQL function that supports querying logs.
- Optimizing Data Compression and Storage
Although GreptimeDB has achieved compression rates far exceeding similar products through its architectural design and columnar storage format, we must continuously improve data compression and storage optimization algorithms, especially for logs and their index. These improvements will further reduce storage space requirements and enhance query speed, ensuring the system remains responsive as data volumes grow.
- Ecosystem Integration for Event Management
The final piece is the ecosystem. A critical component for the event management revolution is to improve the current visualization tools. These tools must be capable of representing events, logs, and metrics together in a unified view. This holistic perspective makes it easier for users to identify correlations, trends, and anomalies across different kinds of application or device event.
Through strategic use of GreptimeDB’s robust features and targeted enhancements, we can create a comprehensive, unified event management system that simplifies infrastructure, reduces costs, and provides superior real-time analysis capabilities.
Conclusion
By revisiting the history of handling logs and metrics in monitoring systems, we have reimagined how to treat logs and metrics as unified events within a single database. This unified database solution not only simplifies the infrastructure but also enhances users' abilities to process, analyze, and correlate various events in real-time. This leads to a more efficient monitoring experience, faster problem resolution, and significantly reduced system maintenance costs.
Embracing this paradigm shift requires innovative thinking and the adoption of advanced technologies, but the benefits far outweigh the efforts. As monitoring systems continue to evolve, the unified approach to handling logs, metrics, and events will become an industry standard, driving the next generation of performance and reliability.
About Greptime
Greptime offers industry-leading time series database products and solutions to empower IoT and Observability scenarios, enabling enterprises to uncover valuable insights from their data with less time, complexity, and cost.
GreptimeDB is an open-source, high-performance time-series database offering unified storage and analysis for metrics, logs, and events. Try it out instantly with GreptimeCloud, a fully-managed DBaaS solution—no deployment needed!
The Edge-Cloud Integrated Solution combines multimodal edge databases with cloud-based GreptimeDB to optimize IoT edge scenarios, cutting costs while boosting data performance.
Star us on GitHub or join GreptimeDB Community on Slack to get connected.


