On this page
Last week, we released GreptimeDB's first official performance report: GreptimeDB vs. Grafana Mimir - First Official Benchmark for High Volume Write In Performance. This report is based on prometheus-benchmark, highlighting GreptimeDB's ability to handle massive time-series in observability scenarios, especially its distributed horizontal scalability.
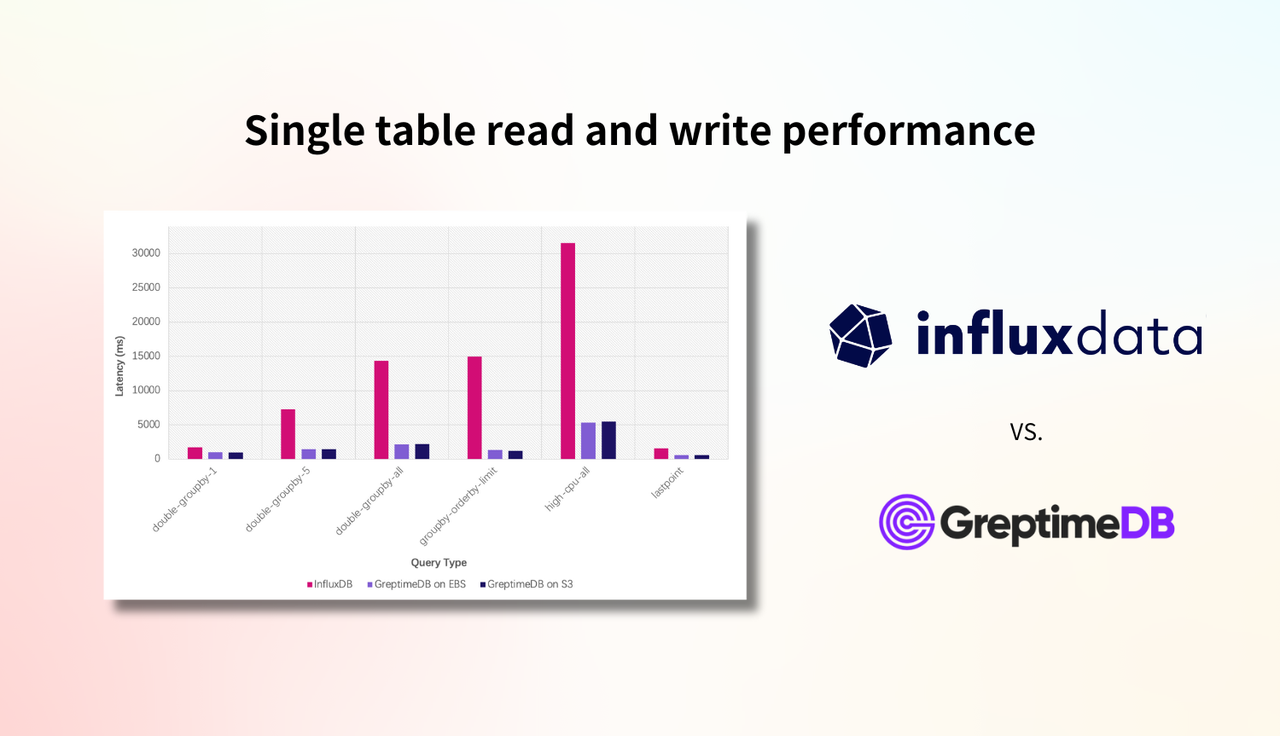
This week, we complete another important performance comparison report between GreptimeDB and InfluxDB. This report is based on the open-source TSBS performance testing suite, which primarily reflects the single table read and write performance of time-series databases. Because the version of InfluxDB 3.x is not stable yet , our test is based on InfluxDB v2.
This test is conducted on a TSBS branch forked by the Greptime team, which, compared to the official version, adds support for GreptimeDB and InfluxDB v2.
Before diving into the detailed report, the conclusions are as follows:
GreptimeDB vs. InfluxDB Benchmark Conclusions
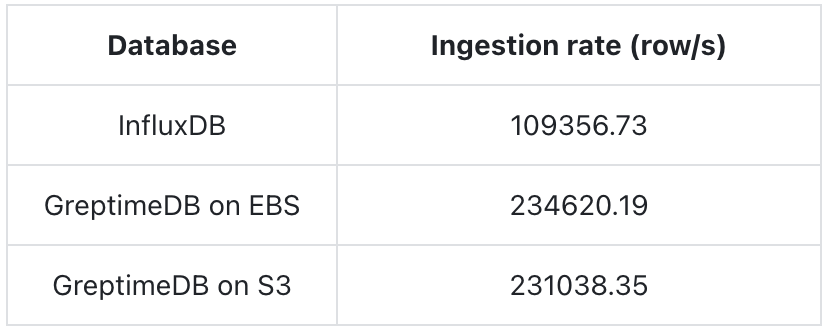
- GreptimeDB's write throughput is more than 2x that of InfluxDB.
- GreptimeDB shows significant advantages in query performance when handling large datasets or heavy computation scenarios, with some queries being over 11 times faster than InfluxDB.
- For queries involving small amounts of data, InfluxDB is slightly faster, but both databases have very short query times, falling within the same order of magnitude.
- GreptimeDB's read and write performance on S3 is comparable to EBS, and it is recommended to enable local caching when using object storage.
- When handling datasets larger than 1 billion rows, GreptimeDB's distributed version demonstrates good horizontal and vertical scalability, whereas the open-source version of InfluxDB can't handle such scenarios.
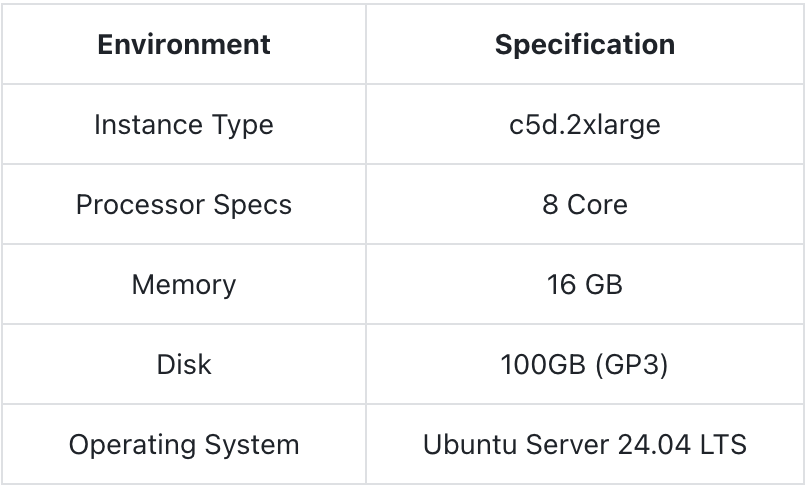
Test Environment
Hardware Environment (Note: Follow this with the specifics of the hardware environment used in the tests.)
Software Version
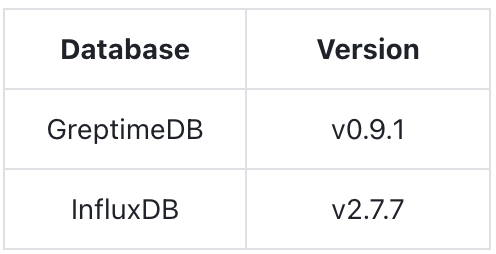
Aside from GreptimeDB setting up local caching for testing storage on S3, no other settings were specially configured.
TSBS Test Scenarios
This benchmark utilized the test dataset generated by TSBS and the test data files were in InfluxDB's Line protocol format.
text
cpu,hostname=host_0,region=eu-central-1,datacenter=eu-central-1a,rack=6,os=Ubuntu15.10,arch=x86,team=SF,service=19,service_version=1,service_environment=test usage_user=58i,usage_system=2i,usage_idle=24i,usage_nice=61i,usage_iowait=22i,usage_irq=63i,usage_softirq=6i,usage_steal=44i,usage_guest=80i,usage_guest_nice=38i 1686441600000000000The measurement name is cpu, and the data includes one timestamp, 10 tags, and 10 fields. The generated data represents the CPU metrics of several hosts over a period of time.
The tags uniquely identify each host and include: hostname, region, datacenter, rack, os, arch, team, service, service_version, service_environment.
The fields contain CPU-related metrics of the machines, including: usage_user, usage_system, usage_idle, usage_nice, usage_iowait, usage_irq, usage_softirq, usage_steal, usage_guest, usage_guest_nice.
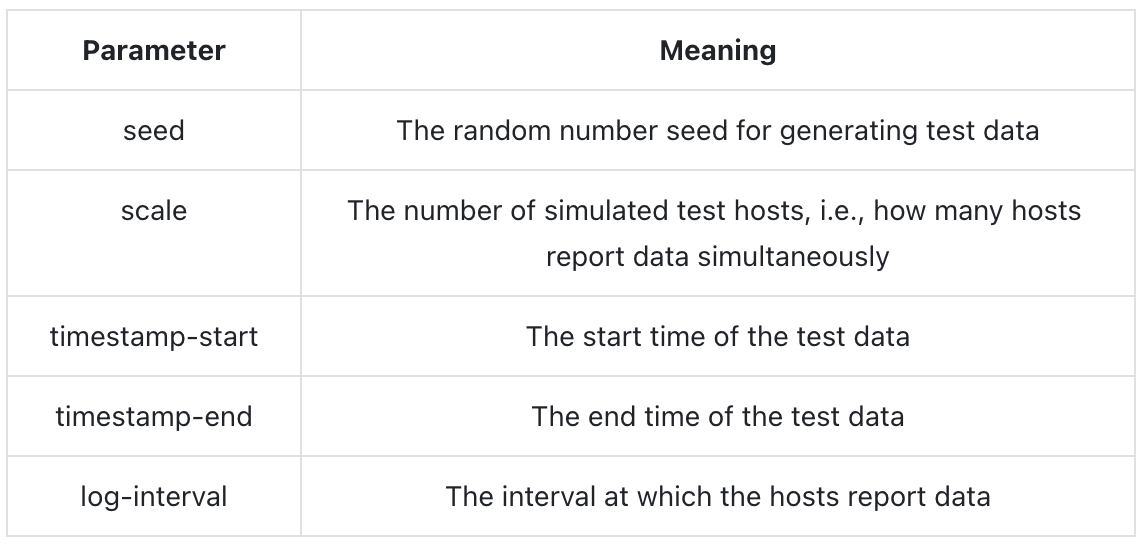
The meanings of the key parameters involved in the benchmarking tool are as follows:
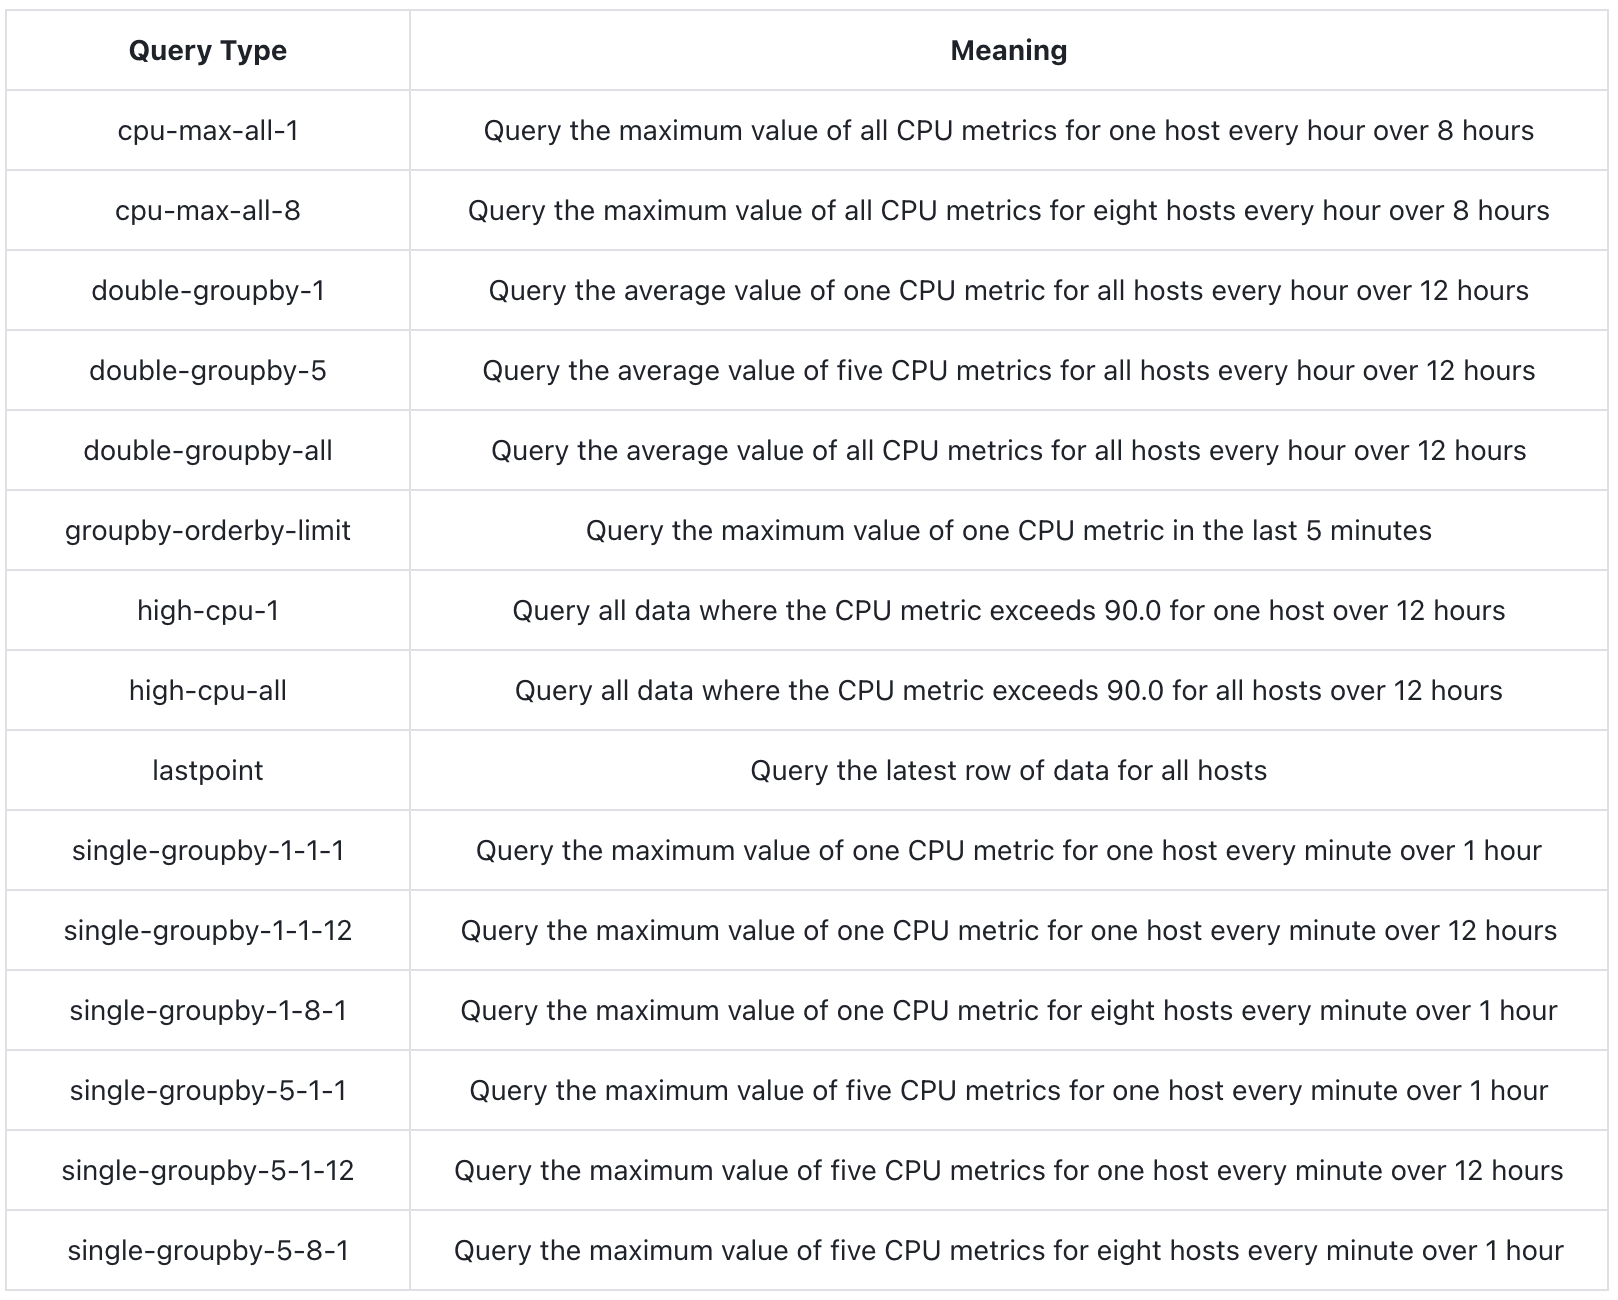
The types and meanings of queries generated by TSBS are as follows.
Since there are 10 fields to record CPU-related metrics, the table will specify how many CPU metrics were queried, indicating the number of fields queried.
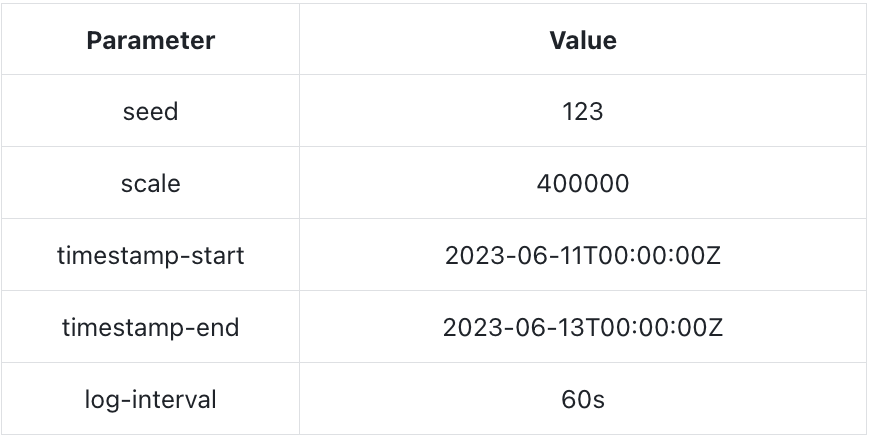
Data generation parameters:
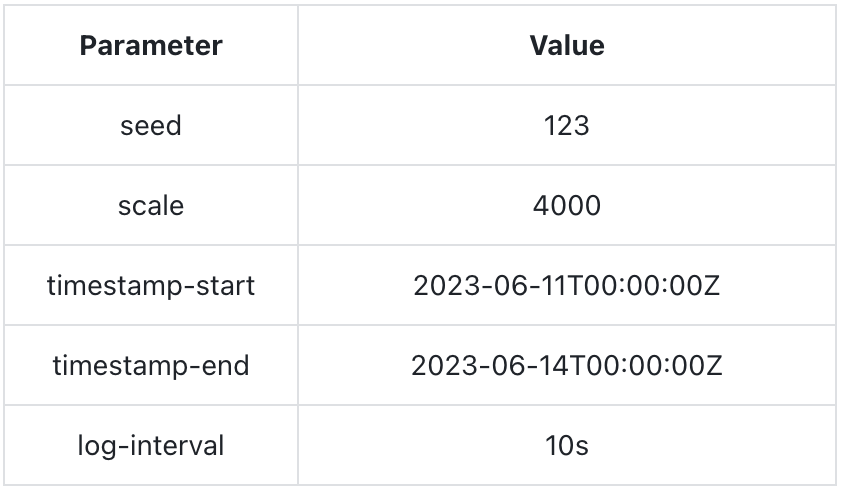
The generated data exceeds 100 million rows (a total of 103,680,000 rows), with a data file size of approximately 34GB.
In this test, both GreptimeDB and InfluxDB used the InfluxDB Line Protocol for data writing. GreptimeDB is compatible with this protocol.
GreptimeDB vs. InfluxDB Benchmark Test Results
Ingestion Performance
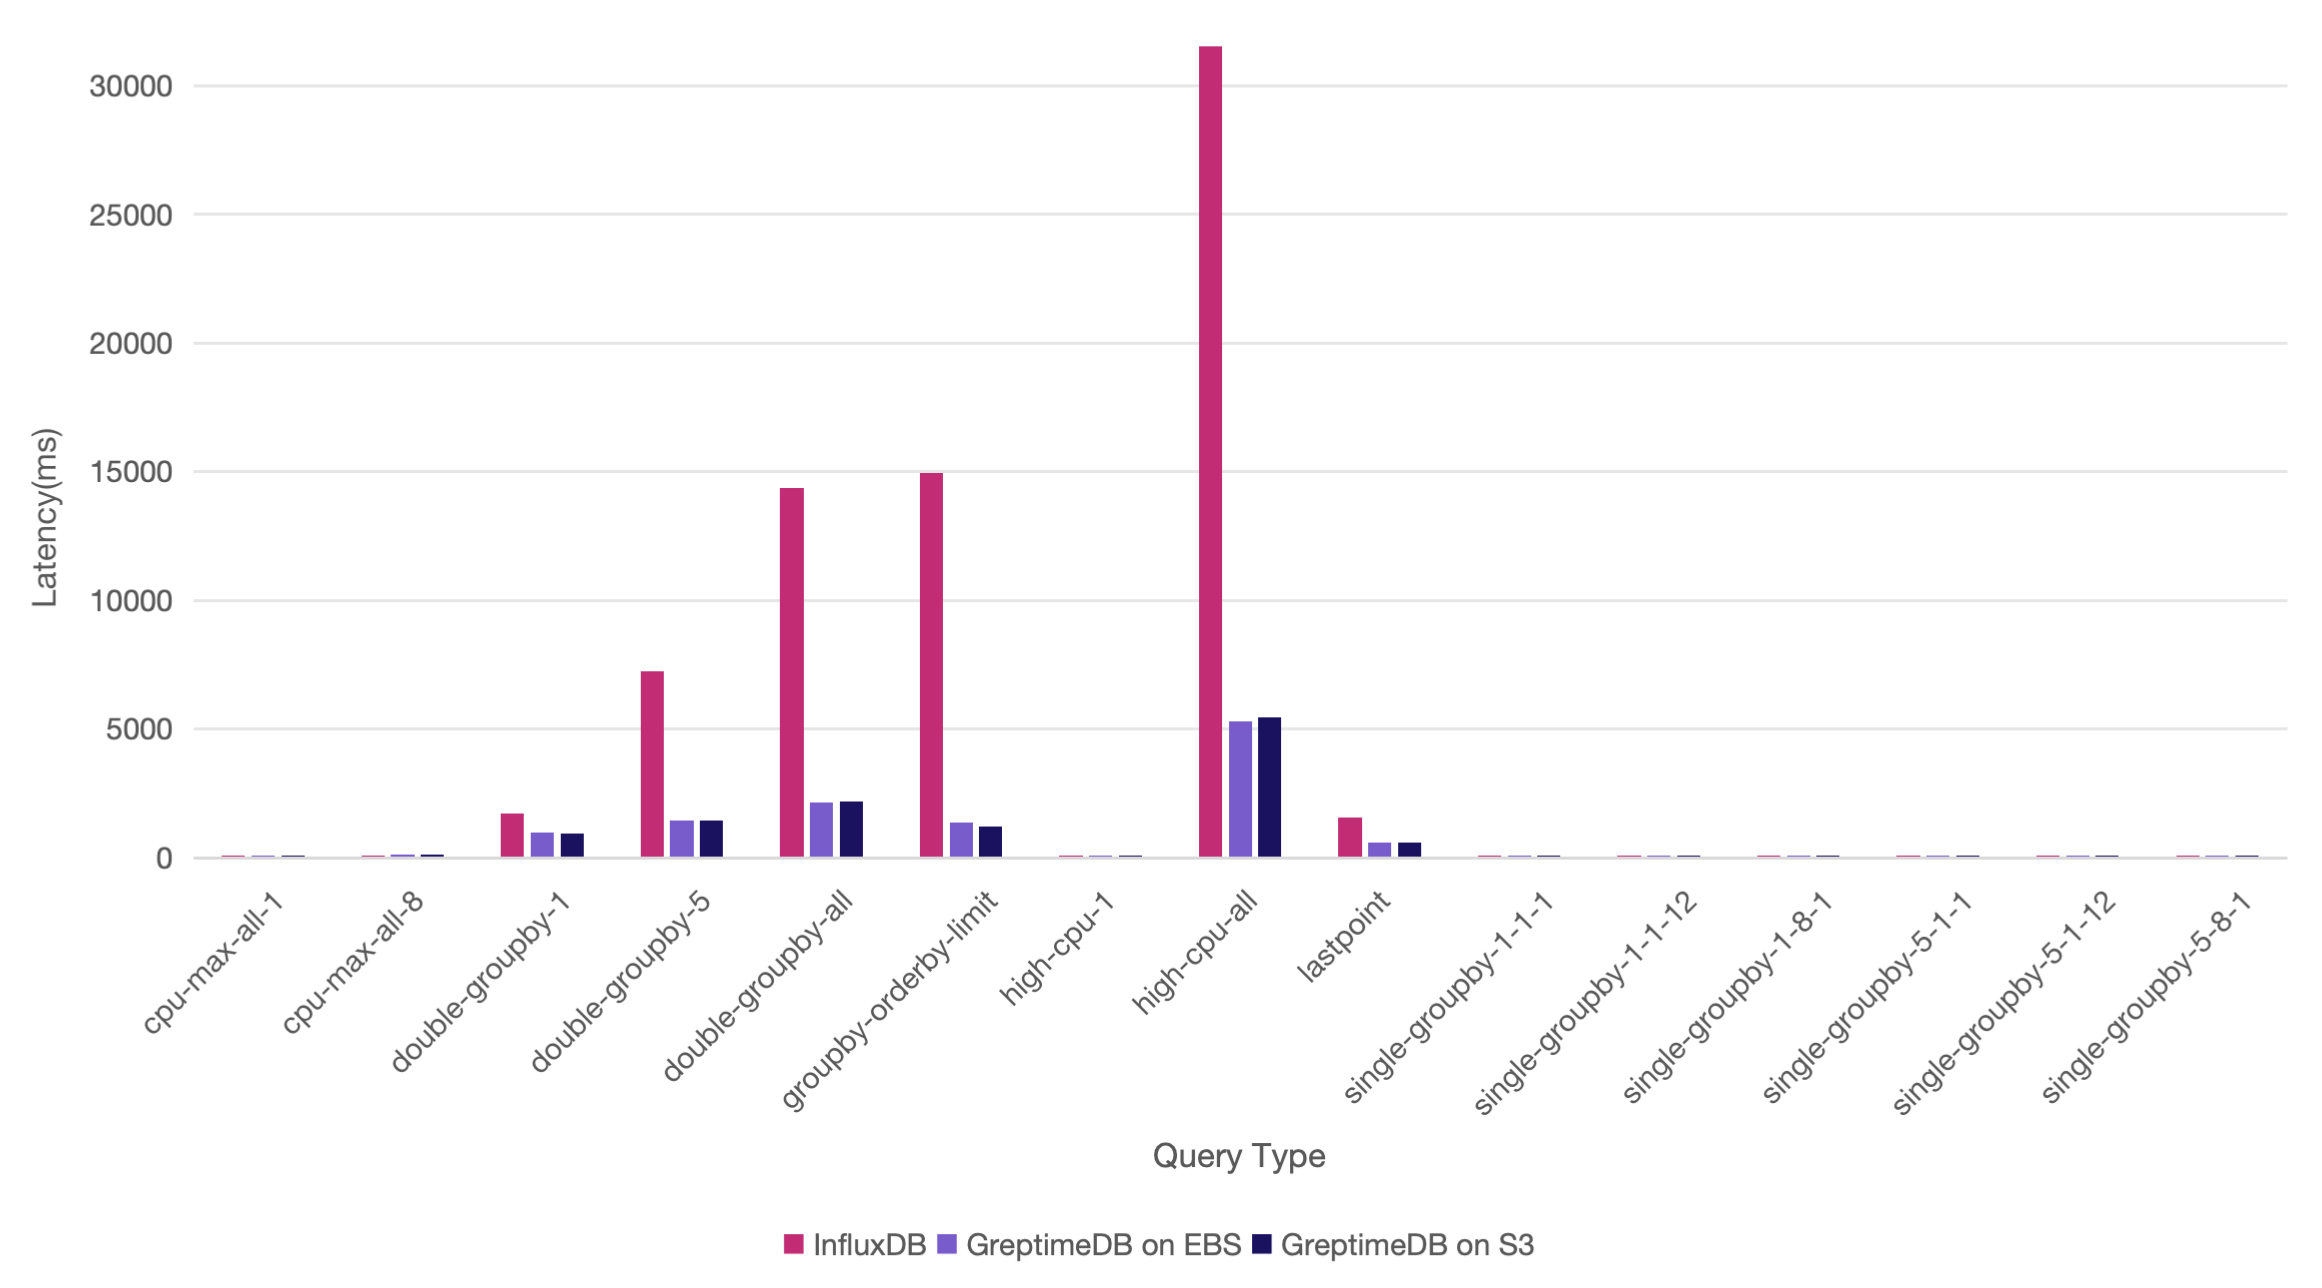
Query Performance
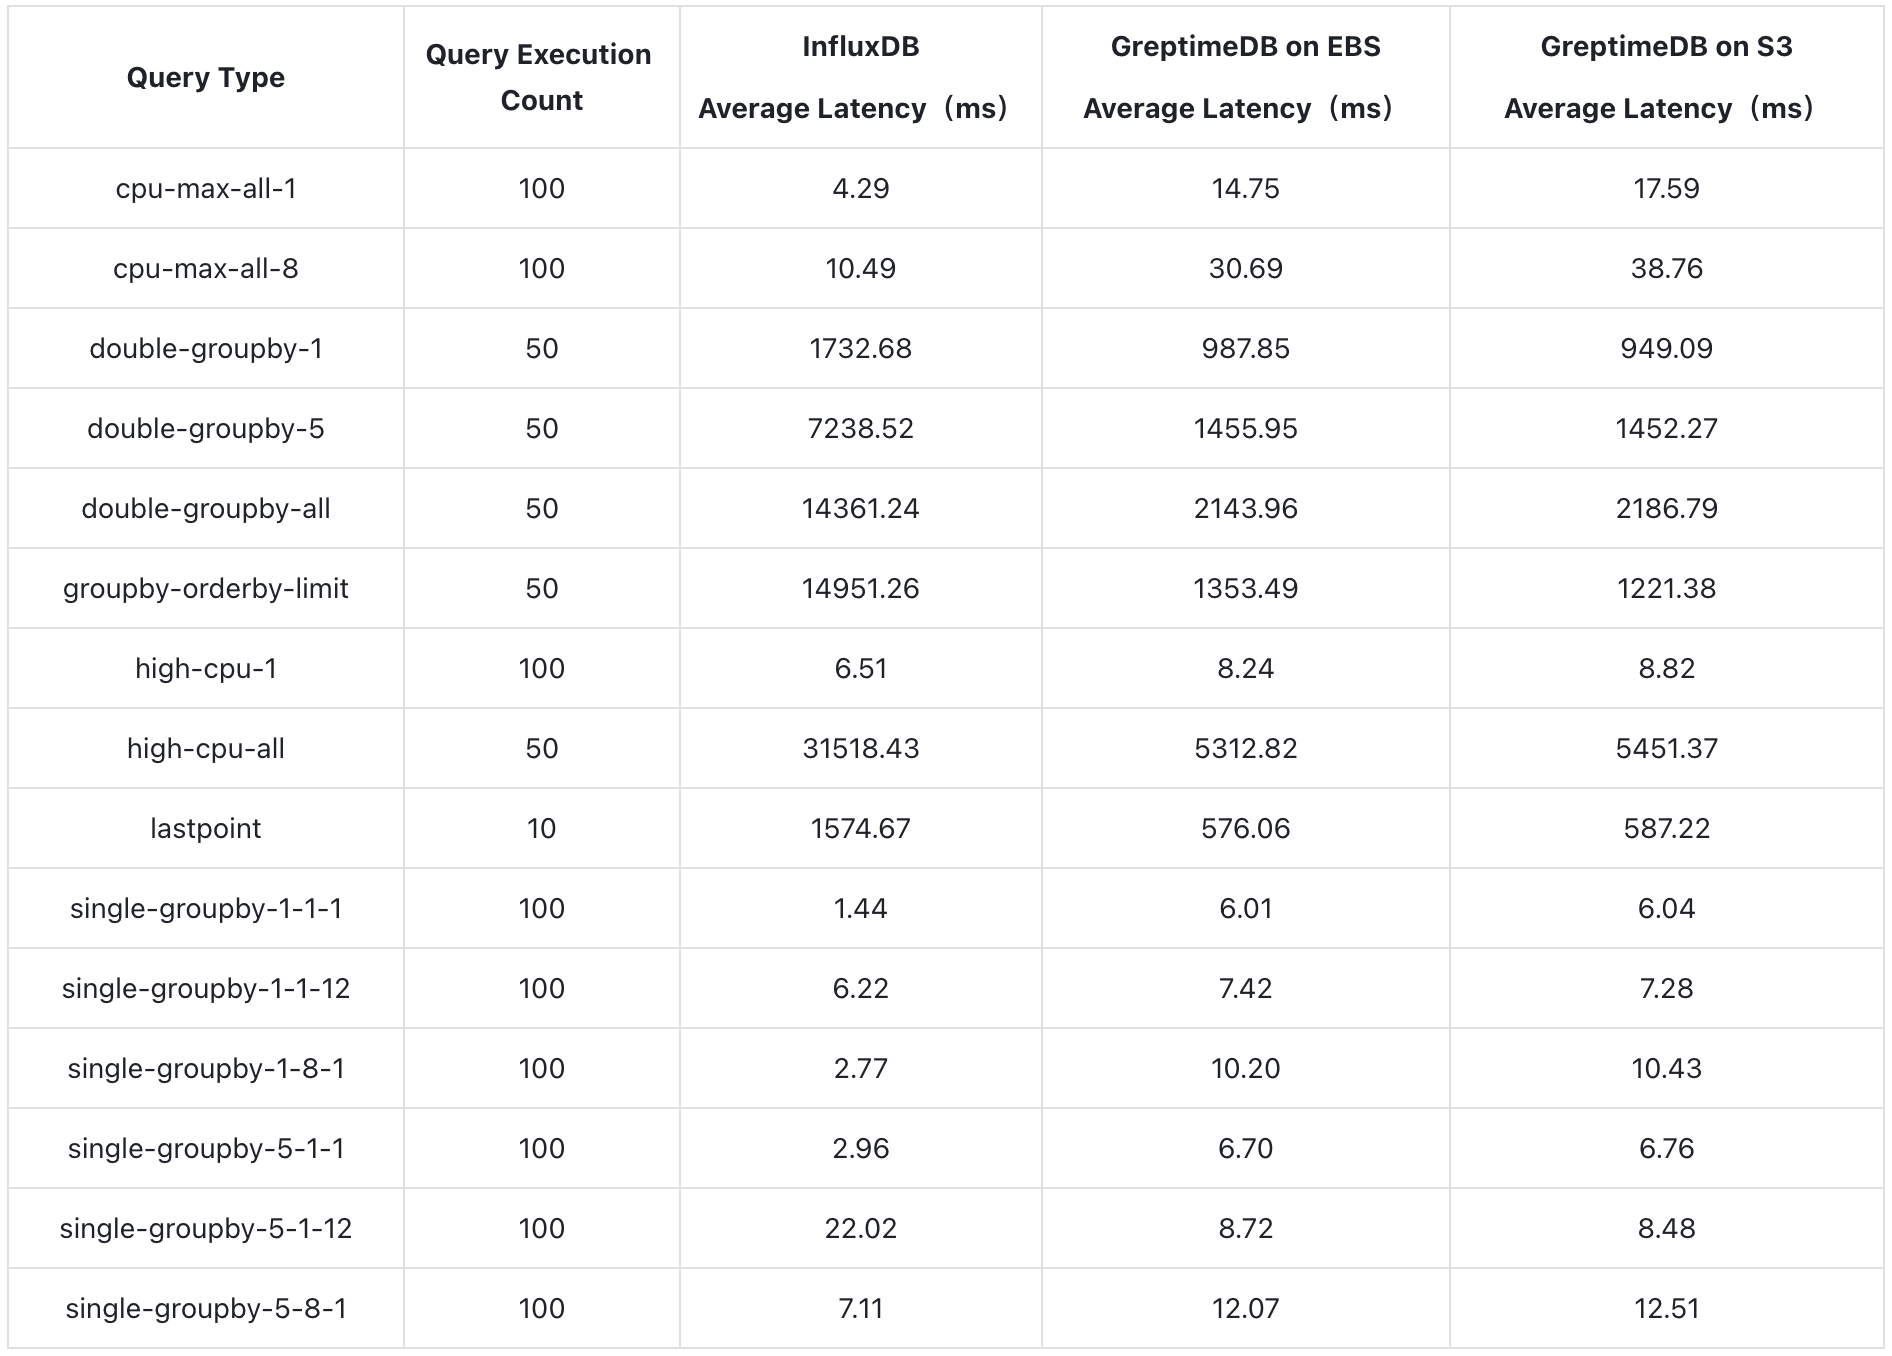
For queries involving 12 hours of data for all hosts, such as double-groupby-1, double-groupby-5, double-groupby-all, and high-cpu-all, or scenarios requiring sorting like groupby-orderby-limit and lastpoint, GreptimeDB demonstrates significant query performance advantages, being 2 to 11 times faster.
For queries with smaller amounts of data, InfluxDB is slightly faster, but GreptimeDB remains competitive. This difference is primarily due to variations in their architectural implementations. Let's illustrate this more clearly with bar charts (Y-axis represents the query time, where smaller values indicate faster queries):
1.1 Billion Rows Performance Test
We attempted to scale the data to 400,000 hosts to evaluate the capabilities of both databases. The test data generation parameters are as follows:
This generated approximately 1.15 billion rows of data (a total of 1,152,000,000 rows), with a size of around 380GB.
During the test, we excluded some extremely large queries that lacked practical reference value.
InfluxDB Results
When we attempted to write the data to InfluxDB, we soon encountered the following error:
bash
unexpected error writing points to database: engine: cache-max-memory-size exceeded: (1100848220/1073741824)Subsequently, we made a series of attempts to address this issue, including increasing the parameters mentioned in the error message and using larger machines (upgraded to a 24-core machine). However, we still could not complete the data ingestion successfully. The write throughput gradually dropped to 20,000 rows per second, triggering TSBS backpressure.
[worker 6] backoff took 5.40sec
[worker 4] backoff took 3.77sec
[worker 8] backoff took 3.77sec
[worker 13] backoff took 3.77sec
[worker 11] backoff took 2.29sec
[worker 2] backoff took 6.09sec
[worker 12] backoff took 6.09sec
[worker 14] backoff took 6.09sec
[worker 3] backoff took 6.09sec
[worker 15] backoff took 6.09sec
[worker 1] backoff took 6.09sec
[worker 9] backoff took 6.09sec
1722445355,62999.07,6.922500E+08,229983.34,6299.91,6.922500E+07,22998.33
Additionally, the database was practically unavailable during the write process, so InfluxDB failed to complete the test.
GreptimeDB Results
We used the same c5d series machines with EBS storage. The cluster's container specifications are as follows:
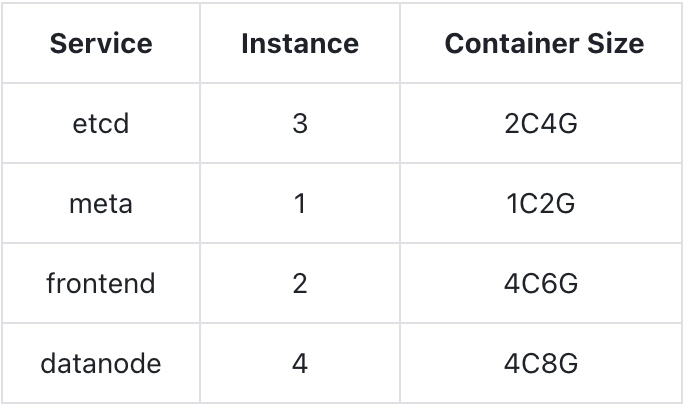
A total of 8 regions are created during the test. The table creation statement is as follows:
sql
CREATE TABLE IF NOT EXISTS cpu (
  hostname STRING NULL,
  region STRING NULL,
  datacenter STRING NULL,
  rack STRING NULL,
  os STRING NULL,
  arch STRING NULL,
  team STRING NULL,
  service STRING NULL,
  service_version STRING NULL,
  service_environment STRING NULL,
  usage_user BIGINT NULL,
  usage_system BIGINT NULL,
  usage_idle BIGINT NULL,
  usage_nice BIGINT NULL,
  usage_iowait BIGINT NULL,
  usage_irq BIGINT NULL,
  usage_softirq BIGINT NULL,
  usage_steal BIGINT NULL,
  usage_guest BIGINT NULL,
  usage_guest_nice BIGINT NULL,
  ts TIMESTAMP(9) NOT NULL,
  TIME INDEX (ts),
  PRIMARY KEY (hostname, region, datacenter, rack, os, arch, team, service, service_version, service_environment)
)
PARTITION ON COLUMNS (hostname) (
   hostname < 'host_144998',
   hostname >= 'host_144998' AND hostname < 'host_189999',
   hostname >= 'host_189999' AND hostname < 'host_234998',
   hostname >= 'host_234998' AND hostname < 'host_279999',
   hostname >= 'host_279999' AND hostname < 'host_324998',
   hostname >= 'host_324998' AND hostname < 'host_369999',
   hostname >= 'host_369999' AND hostname < 'host_54999',
   hostname >= 'host_54999'
);
The write throughput ranged between 250,000 to 360,000 rows per second, successfully completing the data write.
Query Test Results:
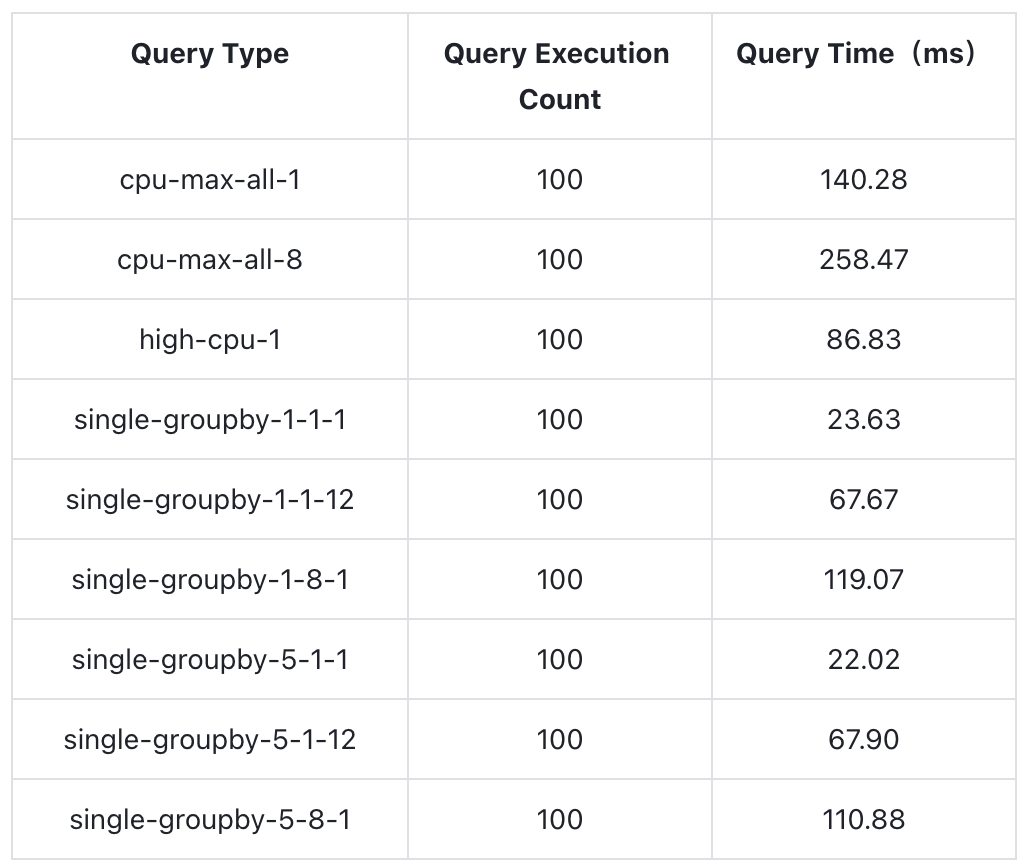
Thanks to its cloud-native architecture, GreptimeDB can support larger-scale data read and write operations through horizontal scaling, whereas InfluxDB cannot handle the same scenario.
Test Manual
To help developers to reproduce the test smoothly, we have provided a test manual. You can follow the instructions in the manual to replicate the test.
GreptimeDB single-table read and write performance surpass InfluxDB
This test demonstrated GreptimeDB's excellent single-table read and write performance, showing a clear advantage over InfluxDB v2. Additionally, it maintained the same outstanding read and write capabilities when using object storage.
We will continue to optimize more query scenarios, compare with other time-series databases in the industry, and rerun this test when InfluxDB v3 is ready. Stay tuned!
GreptimeDB v0.9.1 has been released, fixing some bugs found since the v0.9.0 release. Users currently on v0.9.0 are recommended to upgrade. For detailed release notes, please refer to GreptimeDB v0.9.1 Release Notes.
About Greptime
Greptime offers industry-leading time series database products and solutions to empower IoT and Observability scenarios, enabling enterprises to uncover valuable insights from their data with less time, complexity, and cost.
GreptimeDB is an open-source, high-performance time-series database offering unified storage and analysis for metrics, logs, and events. Try it out instantly with GreptimeCloud, a fully-managed DBaaS solution—no deployment needed!
The Edge-Cloud Integrated Solution combines multimodal edge databases with cloud-based GreptimeDB to optimize IoT edge scenarios, cutting costs while boosting data performance.
Star us on GitHub or join GreptimeDB Community on Slack to get connected.


