On this page
OpenTelemetry focuses on the protocol layer of Observability
Devops Teams must prioritize observability within their networks and applications enabling them to understand issues that arise and plan for future expansion and support. In the previous article about semantic conventions, we broke down the methods of observability into these three layers:
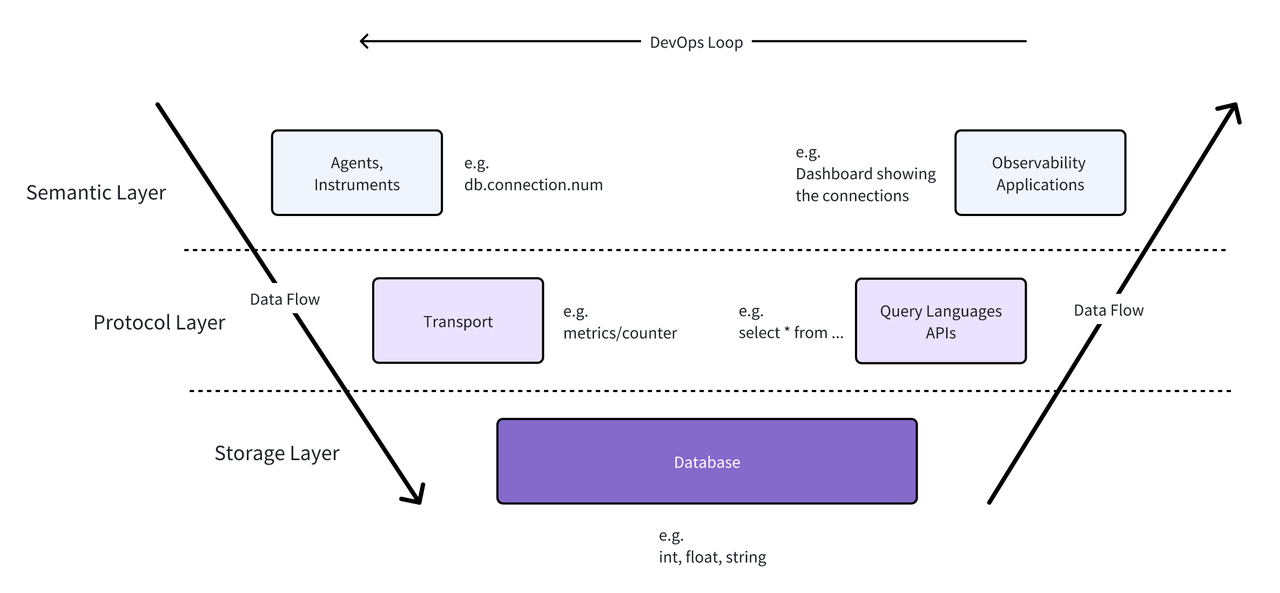
- The Semantic Layer: This layer is about identifying what data to collect and making sense of the data collected. It involves:
- Defining meaningful metrics and events
- Establishing alert thresholds and rules
- Designing dashboards and visualizations
- Implementing tagging and labeling strategies for easy data categorization specific to the semantic event determined by the organization
- The Protocol Layer: This layer focuses on how data is transmitted and communicated. It involves
- Selecting appropriate data transfer protocols
- Implementing data serialization formats (e.g., JSON, Protocol Buffers)
- Working with APIs and SDKs for facilitating data routing between the storage layer and semantic layer
- The Storage Layer: This layer deals with how observability data is stored and retrieved. It involves:
- Choosing appropriate databases for the organization’s use case
- Determining data model for the data types being consumed
- Managing data compression and archiving
- Ensuring data durability and backup strategies
- Optimizing intelligent indexing for optimal read/write performance
At this time, OpenTelemetry focused primarily on the protocol layer. OpenTelemetry does not prescribe exactly what to store, or what to do with it, but rather how it's shaped, and how to move it around.
How OpenTelemetry addresses observability challenges
OpenTelemetry (OTel) is a set of open source standards for monitoring the health of your application or network based on sets of observability data or signals. This data is broken down into three different types: metrics, logs, and traces. In summary, metrics and logs help to understand what happened and where, while traces help to correlate those happenings to identify when and in what order they happened. Together, these signals provide a comprehensive view of your system’s health allowing operators to ensure their networks are running smoothly. OpenTelemetry specializes in servicing distributed systems by building on its concept of context propagation. The platform aims to deliver clarity into complex systems by providing a continuous context aligning system events across applications and hosts. Teams are able to understand what happened, where it happened, and when it happened.
While OpenTelemetry shares a large amount of overlap with many of other popular apps and frameworks in the ecosystem, OTel leans strongly into its open source ethos by defining a vendor-neutral set of protocol standards and interfaces. OTel has seen wide adoption within the observability space due to this transparency and composability.
So how exactly can teams use these different signals to ensure the health of their network?
Metrics
Metrics consist of quantitative data describing some performance, benchmark, or statistic relevant to the health of your application. Examples of metrics include
- Number of bytes received to a specific interface
- Number of times a service returned http-500 errors
- Memory utilization in a given interval
- Number of timeouts a service incurred when running some process
Metrics can be aggregated and exported in user-defined ways to help teams understand when certain events occur and allow teams to invoke fallback mechanisms to ensure the stability of their system. For example, a team might capture a metric such as disk utilization to understand how much capacity exists on a given storage node, and invoke a purge process when the utilization exceeds some given threshold.
Logs
Logging was the first monitoring tool to help developers understand what’s happening in their code. Logs provide a simple, unstructured way for developers to emit messages from running processes to provide more context about the code’s process and status. Most developers will use well known logging libraries in their chosen language to aid in their development process. OTel made the decision to support legacy logging solutions by augmenting these logs to support the OTel Log Data format through supporting bridge components and/or sending these logs through some transformation process while ingesting them through the OTel collector. This provides an easier onboarding process to getting teams started with OpenTelemetry.
Traces
Traces represent the journey of a request as it flows through various services and components in a distributed system. They help track the path and performance of individual requests, making it easier to identify where bottlenecks or errors occur. Traces are made of spans representing a single operation or unit of work within a system, like a database query, an HTTP request, or a function execution. Spans are often related in a parent-child hierarchy, where a parent span can have one or more child spans. This structure helps map the flow of a request through different components of the system. An example of a trace might look something like this
python
{
  "trace_id": "4bf92f3577b34da6a3ce929d0e0e4736",
  "spans": [
    {
      "span_id": "6e0c63257de34c92",
      "parent_span_id": null,
      "name": "GET /api/v1/users",
      ...
    },
    {
      "span_id": "9a92f9a757bb43e1",
      "parent_span_id": "6e0c63257de34c92",
      "name": "Cache lookup",
      "start_time": "2024-08-24T10:23:45.125Z",
      "end_time": "2024-08-24T10:23:45.128Z",
      "attributes": {
        "cache.hit": true,
        "cache.key": "user_123456"
      },
      "events": [],
      "links": []
    }
  ]
}
Core Components of OpenTelemetry
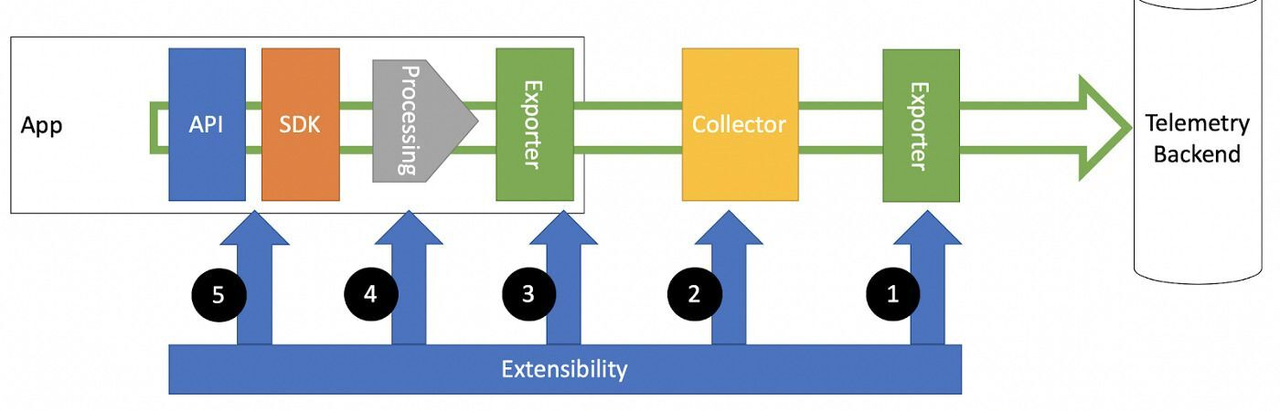
As mentioned previously, OpenTelemetry is vendor neutral. It provides the specification, standards, and core components, and allows others to implement these to best suit their needs. Some of the key components of the OpenTelemetry ecosystem include:
API: The OpenTelemetry API provides a standardized way for applications to generate telemetry data. It's language-specific and offers interfaces for creating spans, adding attributes, and managing context. e.g. Java, Python, Go, JavaScript, .NET, Ruby, PHP, Rust, C++
SDK: The SDK implements the API and provides additional functionality like sampling, batching, and export of telemetry data. It's configurable and extensible to meet various use cases. e.g. OpenTelemetry SDK (official), Jaeger SDK, Zipkin SDK
Collector: The OpenTelemetry Collector is a vendor-agnostic proxy that can receive, process, and export telemetry data. It supports multiple input and output formats, making it easier to integrate with various backends and data sources. e.g. OpenTelemetry Collector (official), Jaeger Collector, Grafana Alloy, Fluent Bit
Instrumentation Libraries: These are language-specific libraries that automatically instrument popular frameworks and libraries to generate telemetry data without requiring changes to application code. e.g. auto-instrumentation for Spring Boot, Django, Express.js, ASP.NET Core
Exporters: Exporters are plugins that send the collected telemetry data to various backends or analysis tools. They support different protocols and data formats. e.g. Prometheus, Jaeger, Zipkin, Datadog, New Relic, Splunk, Elasticsearch
Propagators: These components are responsible for propagating context (like trace and span information) across service boundaries, enabling distributed tracing. e.g. W3C Trace Context, B3 Propagator, Jaeger Propagator
Semantic Conventions: OpenTelemetry is in the process of defining a set of semantic conventions for naming and structuring telemetry data, this attempts to establish consistency across different implementations and languages. e.g. HTTP, Database, Messaging, FaaS, General, Exception
These core components work together to provide a comprehensive observability solution that can be adapted to various environments and integrated with different tools in the observability ecosystem. The wide range of implementations and integrations available for each component demonstrates the flexibility and broad adoption of the OpenTelemetry standard across the industry.
Example openTelemetry implementation
Below is a simple application to illustrate the different components and how they work together:
python
from opentelemetry import trace
from opentelemetry.sdk.trace import TracerProvider
from opentelemetry.sdk.trace.export import BatchSpanProcessor
from opentelemetry.exporter.otlp.proto.grpc.trace_exporter import OTLPSpanExporter
from opentelemetry.instrumentation.flask import FlaskInstrumentor
from opentelemetry.propagate import set_global_textmap
from opentelemetry.propagators.b3 import B3MultiFormat
from opentelemetry.sdk.resources import SERVICE_NAME, Resource
from flask import Flask
import requests

# 1. API & SDK
tracer_provider = TracerProvider(
    resource=Resource.create({SERVICE_NAME: "example-service"})
)
trace.set_tracer_provider(tracer_provider)

# 2. Exporter
otlp_exporter = OTLPSpanExporter(endpoint="http://localhost:4317")
span_processor = BatchSpanProcessor(otlp_exporter)
tracer_provider.add_span_processor(span_processor)

# 3. Propagator
set_global_textmap(B3MultiFormat())

# 4. Instrumentation
app = Flask(__name__)
FlaskInstrumentor().instrument_app(app)

tracer = trace.get_tracer(__name__)

@app.route("/")
def hello():
    with tracer.start_as_current_span("make-request") as span:
        span.set_attribute("custom.attribute", "example value")
        response = requests.get("https://api.example.com")
        span.set_attribute("response.status_code", response.status_code)
    return "Hello, World!"

if __name__ == "__main__":
    app.run(debug=True)
To run the sample process you would need to run an OpenTelemetry Collector, which executes as a separate docker image or executable. An example Docker configuration looks similar to the following:
python
version: "3"
services:
  otel-collector:
    image: otel/opentelemetry-collector:latest
    command: ["--config=/etc/otel-collector-config.yaml"]
    volumes:
      - ./otel-collector-config.yaml:/etc/otel-collector-config.yaml
    ports:
      - "4317:4317" # OTLP gRPC receiver
      - "4318:4318" # OTLP HTTP receiver
      - "8888:8888" # Prometheus metrics exposed by the collector
      - "8889:8889" # Prometheus exporter metrics
      - "13133:13133" # Health check extension
Executing the above docker file with a mounted configuration similar to below would allow the python process to export its data to this target, e.g. otel-collector-config.yaml.
python
receivers:
  otlp:
    protocols:
      grpc:

processors:
  batch:

exporters:
  logging:
    loglevel: debug

service:
  pipelines:
    traces:
      receivers: [otlp]
      processors: [batch]
      exporters: [logging]
With all of the different moving pieces to this collection process, it's easy to get overwhelmed. We have provided a small introduction to the different components of OpenTelemetry and how the pieces move together. In future articles, we will expand deeper into how to create a more robust observability pipeline with OpenTelemetry
About Greptime
Greptime offers industry-leading time series database products and solutions to empower IoT and Observability scenarios, enabling enterprises to uncover valuable insights from their data with less time, complexity, and cost.
GreptimeDB is an open-source, high-performance time-series database offering unified storage and analysis for metrics, logs, and events. Try it out instantly with GreptimeCloud, a fully-managed DBaaS solution—no deployment needed!
The Edge-Cloud Integrated Solution combines multimodal edge databases with cloud-based GreptimeDB to optimize IoT edge scenarios, cutting costs while boosting data performance.
Star us on GitHub or join GreptimeDB Community on Slack to get connected.


