Microservices have been haunting me in my dreams: Microservices serving up a delicious full stack pancake breakfast, Microservices being unreachable under the couch cushions, Microservices pulling me over and asking me if I had any idea how fast I was committing my code.
The popularization of microservices, cloud-native architectures, and distributed systems has created the need for centralized log management tools to capture all of those disparate logs. Log aggregation is the process of collecting all logs across a network into systems and tools that allow operators to quickly and accurately understand significant events as they occur.
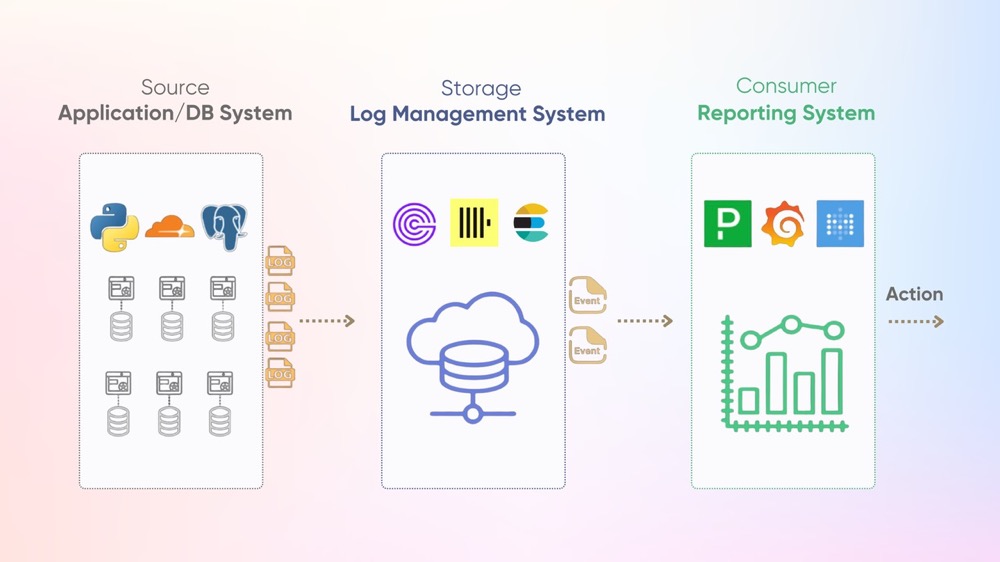
What does a Log Aggregation Pipeline look like
At a high level a log pipeline has 3 main components:
- The source of the logs
- The storage of the logs
- the consumer of the logs

Source of Logs
The source of logs can come from many places - application logs (e.g. log4j, winston), system logs (e.g. syslog, Windows Event Log), or infrastructure logs (e.g. nginx, kubernetes). These logs can be collected by agents like Fluentd, Vector, or Alloy and sent directly to a storage layer via instrumenting your code with a framework like OpenTelemetry.
Storage of Logs
The storage layer handles persisting logs and making them searchable. Specialized databases like Elasticsearch, ClickHouse, or GreptimeDB provide indexing to speed up full-text searching and offer semantics and SDKs to extract occurrences of interest from these logs. The storage must handle high write throughput while enabling fast querying.
Consumer of Logs
The consumers that need to do stuff with these logs include developers debugging issues through web UIs, automated alerting systems checking for errors, and business intelligence tools generating reports. Tools like Metabase, Grafana, and Pagerduty are some of the most well-known consumer applications of logs.
The storage layer is the backbone of any log aggregation pipeline. As the central component where sources write data and consumers read it, the storage layer represents one of the most significant investments in both code configuration and infrastructure costs.
With that in mind, it's important to think about what critical factors influence upstream and downstream processes of a log storage layer.
Factors to consider when choosing a log management tool
TLDR: Important factors to consider when evaluating log aggregation storage include:
- Compression rate
- Resource utilization
- Ingestion performance
- Query performance
- Query interface
- Supported 3rd party integrations
Users are growing, transactions are growing, and services are growing. It seems like everything is expanding—except for my hairline. This ever-growing volume of logs of these different factors should prompt one to consider the scalability and performance of the log management tool in question.
The ingestion rate will dictate how quickly your system will be able to save incoming logs, where compression rate and resource utilization are two of the primary factors to consider when evaluating the data storage of those logs. These metrics will help you understand if your system can keep up with the volume and velocity of incoming logs, and how much it is going to cost to archive that data.
But, What good is an exabyte of data if you can't get any relevant information out of it? The tool's query performance and query interface directly affect its usability. Does your system need to support full-text search to find arbitrary string patterns, or is structured, label-based search sufficient for your use case. What type of filtering and joining will your queries need to perform? What capabilities exist to identify and capture meaningful events from an unstructured log file?
Are you excited to learn your 16th domain specific language of the year with zoom-bippity-bap-query-lang, or are you a seasoned, SQL-soldier looking to reach for that trusty select * from logs lasso to wrangle some data. Finding the right fit for your team's capacity and preference will be the difference between a welcome adoption or a dreadful chore.
Integration flexibility is equally important, as the solution must capture logs from your existing infrastructure while providing accessible APIs for AlertManagers, IncidentManagers, and BI Visualization platforms to source from. Supported 3rd party integrations with all of the tools in your environment will make building an integrated log pipeline much easier. What does the journey look like from source log to actionable event. What protocols and query interfaces are required by your consuming applications?
Answering these questions will help you best determine the right fit for your deployment.
Summary
As you evaluate these factors, it’s clear that selecting a log management tool is no trivial task — it requires balancing performance, scalability, cost-efficiency, and usability. This is where GreptimeDB shines. Designed for high-performance time-series data management, GreptimeDB offers seamless log ingestion, efficient compression, and lightning-fast query capabilities. It supports familiar query languages including SQL and PromQL and integrates effortlessly with your existing ecosystem, making it an ideal choice for modern log aggregation pipelines.
This blog is just the beginning. In the next part, we’ll dive deeper into comparing those popular log management tools to highlight their strengths and trade-offs. Stay tuned!
About Greptime
Greptime offers industry-leading time series database products and solutions to empower IoT and Observability scenarios, enabling enterprises to uncover valuable insights from their data with less time, complexity, and cost.
GreptimeDB is an open-source, high-performance time-series database offering unified storage and analysis for metrics, logs, and events. Try it out instantly with GreptimeCloud, a fully-managed DBaaS solution—no deployment needed!
The Edge-Cloud Integrated Solution combines multimodal edge databases with cloud-based GreptimeDB to optimize IoT edge scenarios, cutting costs while boosting data performance.
Star us on GitHub or join GreptimeDB Community on Slack to get connected.


