In the realm of cloud-native systems, Kubernetes has become the go-to platform for container orchestration. With the rise of microservices architectures, managing the increasing complexity of applications has presented new challenges, particularly in terms of efficiently collecting and processing data. Vector is a high-performance data pipeline that provides an excellent solution for observability within Kubernetes, enabling operations teams to collect, process, and transmit Logs, Metrics, and Events seamlessly across the system.
What Data Needs to Be Collected for Monitoring in Kubernetes?
Monitoring a Kubernetes environment requires the collection of various data types to ensure system stability and observability. This data typically includes:
Logs
Metrics
Events
Each of these data types plays a critical role in diagnosing issues, optimizing performance, and improving the reliability of services.
Logs
Logs are textual records generated by systems that help track the state of applications and services. They contain crucial information such as request details, errors, and warnings. In Kubernetes, logs can come from several sources:
Container Logs: Each container generates standard output logs, which can be used to analyze container performance, including reasons for crashes or exceptions.
Operating System Logs: These logs, found in locations such as
/var/log/messagesanddmesg, provide valuable insights when troubleshooting Kubernetes node issues.Kubernetes Component Logs: Logs generated by Kubernetes components like the
kubelet,kube-apiserver, andkube-controller-managerhelp monitor cluster management and scheduling activities.
Metrics
Metrics are used to diagnose the performance and health of a system. In Kubernetes, metrics can be collected at multiple levels:
Node Metrics: CPU utilization, memory usage, disk I/O, and network I/O metrics help assess the health of cluster nodes.
Pod and Container Metrics: Metrics related to CPU, memory, and network traffic for individual pods and containers help track resource consumption.
Application Metrics: Microservices often expose custom metrics like response times, transactions per second (TPS), and error rates, which are crucial for monitoring application performance.
Events
Events are records of system-level operations and state changes within Kubernetes, helping operations teams quickly identify issues. Event types include:
Pod and Container Lifecycle Events: Information on pod startup, shutdown, and restarts.
Scheduling Events: Data about decisions made by the Kubernetes scheduler.
Health Check and Resource Management Events: Alerts when resources or services fail to meet health thresholds.
Vector Deployment Models in Kubernetes
Vector can be deployed in Kubernetes in various ways, typically as either a DaemonSet or a Pod, depending on the data collection needs and scope.
Using DaemonSet to Deploy Vector
A DaemonSet ensures that a pod runs on every node in the cluster. Deploying Vector as a DaemonSet offers several benefits:
Node Coverage: Ensures that a Vector instance runs on every node, enabling the collection of logs, metrics, and events from all nodes.
Centralized Management: Leverages Kubernetes-native management capabilities for tasks such as upgrading and fault recovery.
Efficient Resource Usage: Since each node runs its own Vector instance, it minimizes resource contention, optimizing overall cluster resource usage.
Using Pod to Deploy Vector
Alternatively, Vector can be deployed as a regular Pod if the data collection scope is limited to specific applications or services. This method offers greater flexibility and is suited for scenarios such as:
Specific Application Monitoring: When only specific services or containers need monitoring, Vector can be deployed as an isolated pod.
Resource Isolation: Using pods isolates Vector's resource consumption from other cluster services, avoiding any interference with the rest of the infrastructure.
Testing and Experimentation: Pods are ideal for testing configurations, evaluating different data collection rules, or experimenting with various data sinks.
Why Choose DaemonSet for Vector Deployment?
Deploying Vector as a DaemonSet is the most common and recommended approach in Kubernetes. This setup provides several advantages:
Containerized Flexibility: Each node in the Kubernetes cluster runs a Vector instance, ensuring comprehensive data collection from all nodes, improving the integrity of the collected data.
Localized Data Processing: DaemonSets ensure logs, metrics, and events are processed locally on the node they are generated, reducing network latency and overhead.
Scalability and Maintenance: As the cluster grows, new nodes automatically join the DaemonSet, ensuring continuous data collection and system observability.
How to Use Vector in Kubernetes
Deploying Vector in Kubernetes is straightforward. Below is a basic example of how to configure Vector to send Kubernetes node host_metrics and container logs to GreptimeDB.
Step 1: Install Helm
First, you need to install Helm, which can be done following the instructions in the official Helm documentation.
Step 2: Add the Vector Helm Chart Repository
Before deploying Vector, add the Vector Helm repository:
helm repo add vector https://helm.vector.dev
helm repo update
Step 3: Create the Configuration File
Create a values-vector.yaml file containing the configuration for Vector:
role: "Agent"

tolerations:
  - operator: Exists

service:
  ports:
    - name: prom-exporter
      port: 9598

containerPorts:
  - name: prom-exporter
    containerPort: 9598
    protocol: TCP

customConfig:
  data_dir: /vector-data-dir

  sources:
    kubernetes_logs:
      type: kubernetes_logs

    host_metrics:
      type: host_metrics
      collectors:
        - cpu
        - memory
        - network
        - load
      namespace: host
      scrape_interval_secs: 15

  transforms:
    kubernetes_container_logs:
      type: remap
      inputs:
        - kubernetes_logs
      source: |
        .message = .message
        .container = .kubernetes.container_name
        .pod = .kubernetes.pod_name
        .namespace = .kubernetes.pod_namespace

  sinks:
    logging:
      compression: gzip
      endpoint: http://greptimedb.default:4000
      table: kubernetes_container_logs
      pipeline_name: kubernetes_container_logs
      inputs:
        - kubernetes_container_logs
      type: greptimedb_logs

    metrics:
      type: greptimedb_metrics
      inputs:
        - host_metrics
      dbname: public
      endpoint: greptimedb.default:4001
Step 4: Deploy Vector
Now, deploy Vector using the following Helm command:
helm upgrade --install vector vector/vector --values values-vector.yaml -n defaultCheck the status of the Vector pod:
kubectl get po -n defaultStep 5: Access the Data
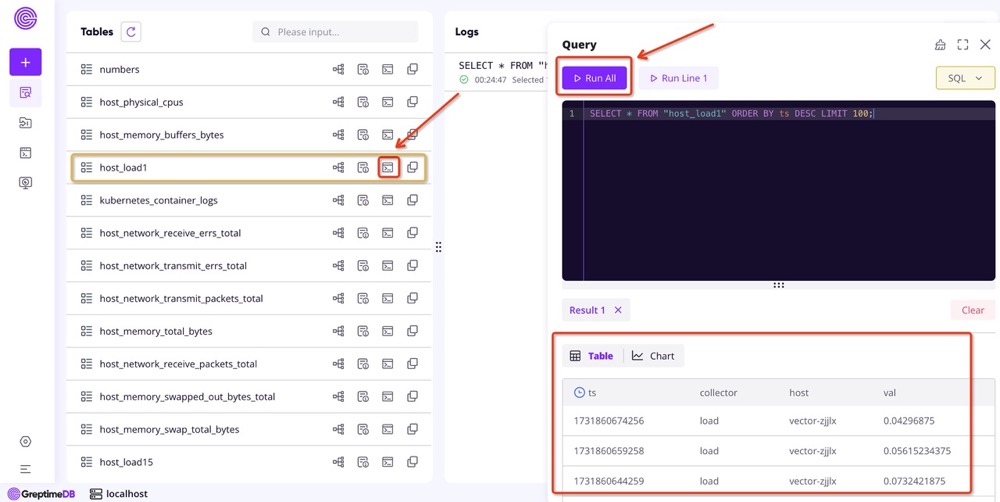
In the Vector configuration file, under customConfig.sources.host_metrics, we defined four types of metrics to collect from Kubernetes nodes: CPU, memory, network, and load. These metrics are then sent to GreptimeDB through customConfig.sinks.metrics. You can view detailed information on these metrics via the GreptimeDB dashboard:

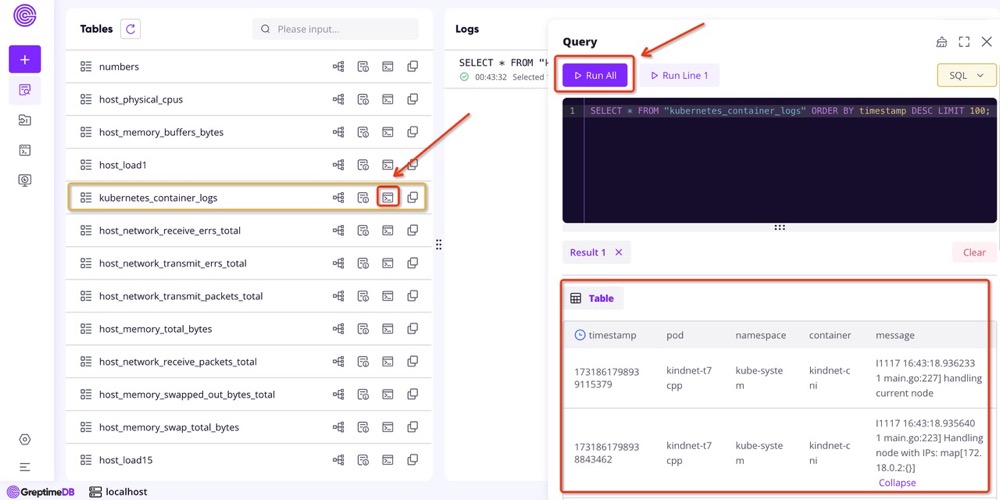
In the Vector configuration, customConfig.sources.kubernetes_logs defines how to collect Kubernetes container logs. These logs are sent to GreptimeDB's kubernetes_container_logs table via customConfig.sinks.logging. By querying this table, you can view all the container logs:

Conclusion
Vector is a powerful and flexible tool for collecting logs and metrics, particularly well-suited for Kubernetes environments. Its high performance, flexible configuration, and powerful data processing capabilities make it an excellent choice for cloud-native applications. Whether handling logs, metrics, or events, Vector provides a reliable solution that enhances the observability and stability of systems, empowering DevOps and SRE teams to improve operational efficiency.
References
About Greptime
Greptime offers industry-leading time series database products and solutions to empower IoT and Observability scenarios, enabling enterprises to uncover valuable insights from their data with less time, complexity, and cost.
GreptimeDB is an open-source, high-performance time-series database offering unified storage and analysis for metrics, logs, and events. Try it out instantly with GreptimeCloud, a fully-managed DBaaS solution—no deployment needed!
The Edge-Cloud Integrated Solution combines multimodal edge databases with cloud-based GreptimeDB to optimize IoT edge scenarios, cutting costs while boosting data performance.
Star us on GitHub or join GreptimeDB Community on Slack to get connected.


