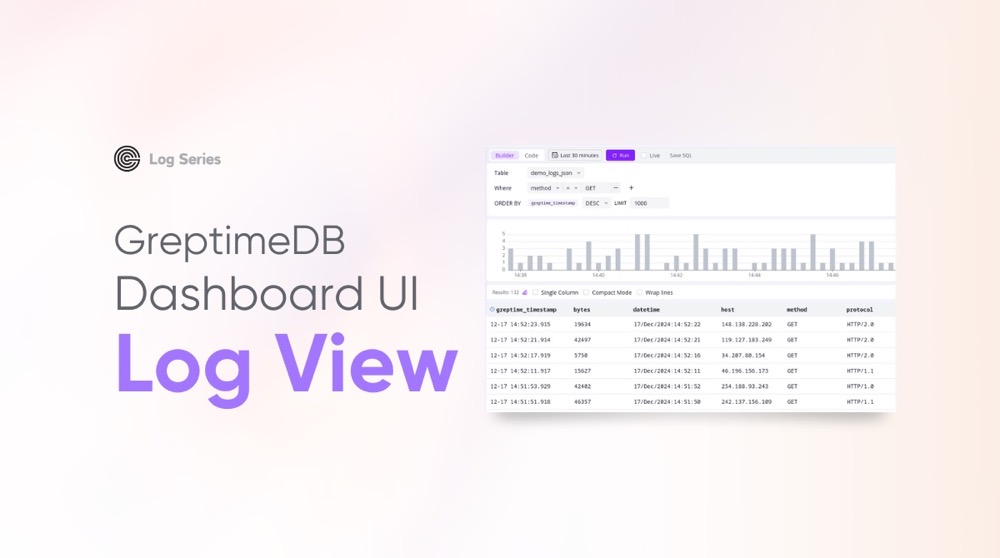
From GreptimeDB v0.11 release, we ship a new UI for querying and viewing logs and events stored in GreptimeDB. Let us dive into the details to see how our new Log UI can help you with navigating your data and get insights from it.

Query Builder
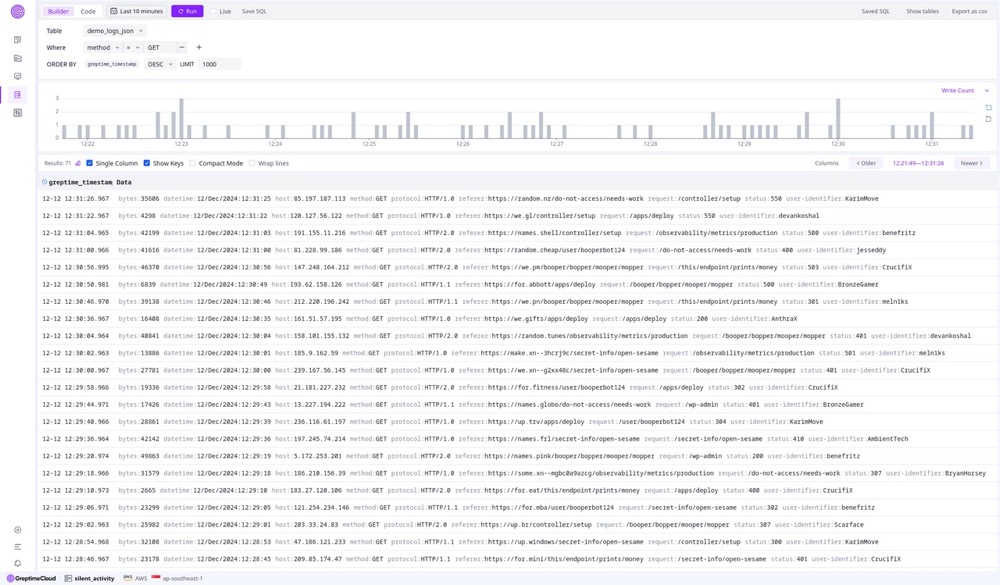
The query builder allows you to select the table to query, define filters and data sorting options.

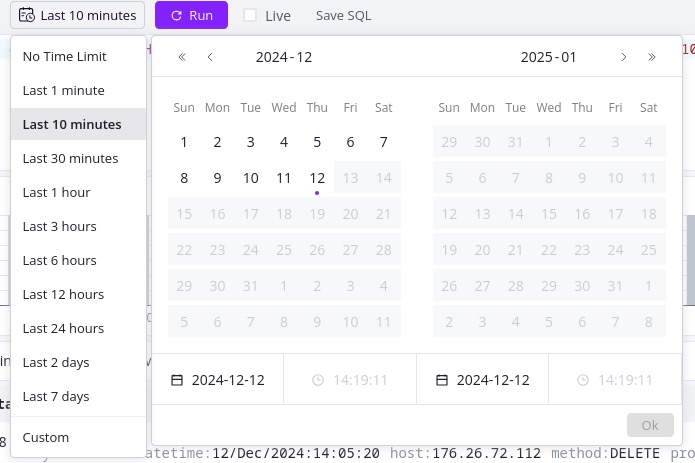
The Date/Time Picker provides you a quick access to timestamp filters. If you use relative date time range like "Last 10 minutes", it will always fetch data from current time. This is useful for tailing logs for the latest update.

Like many visualization and BI tools, it's also possible to switch to "Code" mode and write SQL directly for advanced queries.

Click the "Run" button to execute the query and retrieve results. If you check the "Live" option, the UI will run the query periodically to tail the latest results and prepend the to the UI.
Result View
The result view first provides an overview of the result item count over time, then followed by the actual result table. By zooming in and out the bar chart, we will show the data for your selected time range.

There are two types of result table views: single-column view and multi-column view. The single-column mode is to simulate a log file experience. You can also toggle the visibility of field keys if it provides little information for you.

While the multi-column view is great for structured event data, gives you a clear table experience.

You also control the display size by turning on "Compact Mode" to include more data in one screen. And use "Wrap Line" to avoid horizontal scroll bars.
The time navigation widget gives you a quick look of data time range of current page, and is navigatable between time ranges. While the column filter allows you to toggle the visibility of columns from the result table.

Pipeline Management
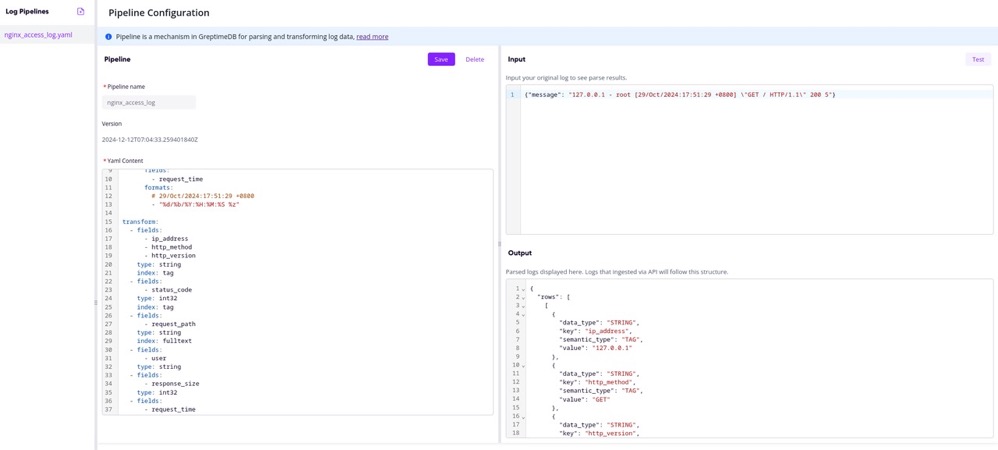
GreptimeDB has built in log data processing pipelines to transform any format of log input to the structure you want. Previously, it was only available as REST API but in this release, we built a dedicated pipeline management UI.

You can edit and test your pipeline and see the intermediate data structure to be stored in database.
First Release of Our Log UI
This is the first release of our log UI. We are continuously working on it to ship new features and bugfixes.
To add feedback for it, head to our community slack and dashboard github project
About Greptime
Greptime offers industry-leading time series database products and solutions to empower IoT and Observability scenarios, enabling enterprises to uncover valuable insights from their data with less time, complexity, and cost.
GreptimeDB is an open-source, high-performance time-series database offering unified storage and analysis for metrics, logs, and events. Try it out instantly with GreptimeCloud, a fully-managed DBaaS solution—no deployment needed!
The Edge-Cloud Integrated Solution combines multimodal edge databases with cloud-based GreptimeDB to optimize IoT edge scenarios, cutting costs while boosting data performance.
Star us on GitHub or join GreptimeDB Community on Slack to get connected.


