Observability in software engineering has evolved from its origins in control theory to become a critical strategy for managing complex software systems, necessitating advanced solutions like GreptimeDB's unified storage model. This approach efficiently integrates metrics, logs, and traces into a single platform, addressing the challenges of modern distributed architectures and enhancing operational efficiency and analytical capabilities, while also aligning with future trends in AI integration and real-time data processing.
Why Do We Need to Observe Our Program
Every programmer has printed logs and uses them to debug and improve their program. That's observability.
Short Long History of Observability
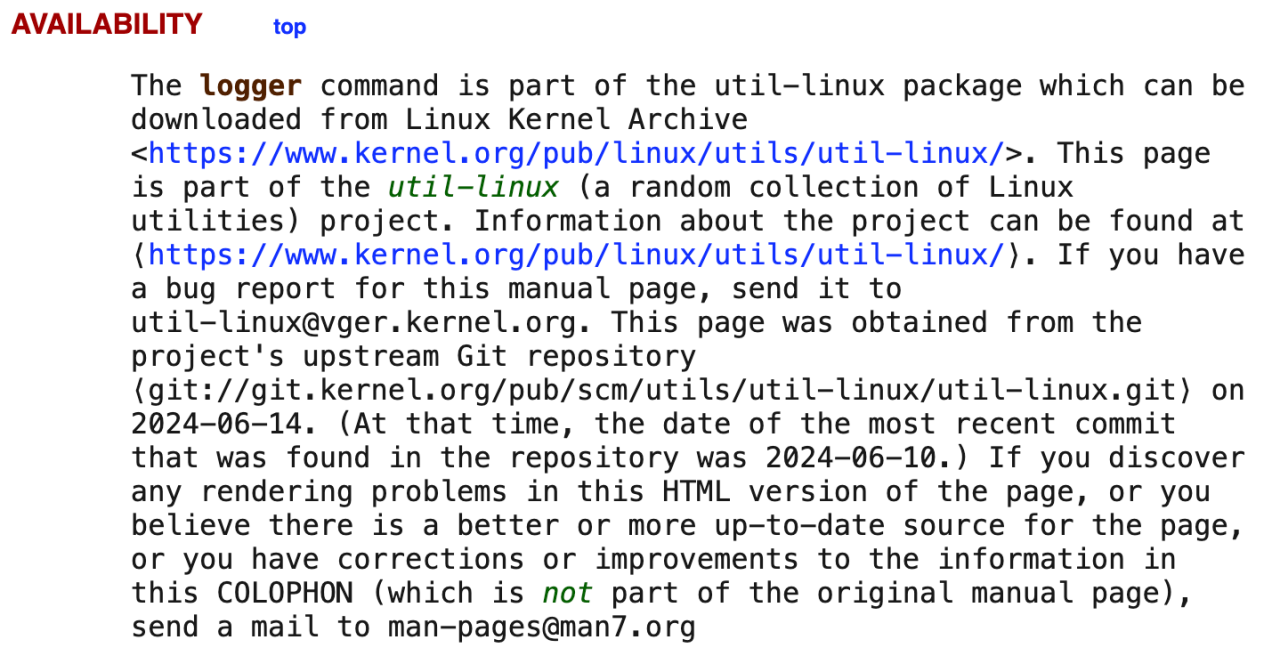
One day I started wondering what's the earliest observability tools were used because I came across an update notice of the `logger(1p) command, as a part of "new things" from POSIX 2024. It enhanced multi-threading support, improved with better arguments, and added support for bulk loggings. Making it more versatile for modern use cases.

logger(1p) is a few years older than me. But obviously, this is not the very beginning. The oldest occurrence I can find is a concept named observability from control theory, first introduced by engineer Rudolf E. Kálmán in 1960. It's initially applied to physical systems, and has evolved significantly to address the complexities of modern software architectures.
Nowadays, we are already beyond the stage of simply tracking CPU usage or memory consumption. As networks and distributed systems emerged, both observability requirements and tools have significantly shifted to a more sophisticated form. With the proliferation of microservices, containerization, serverless architectures, and cloud-native movement, systems have become increasingly distributed and dynamic. One can hardly tell what's actually happening without proper observability tools.
Moreover, we are eager to take one more step forward - not only solving problems passively, but also making proactive emergency predictions, continuous performance tuning, and providing valuable business insights. The entire observability infrastructure has become a hard requirement for any software system with real traffic.
But sadly, the story is not that simple.
Chaotic Time-Series Landscape
The observability data, or more specifically, time-series data comes in various forms, with each serving a specific purpose. Here are some often-used categories:
Metrics: Numerical measurements that are generated and collected at regular intervals. Represents system throughput, resource utilization, process latency, etc. It's particularly useful for identifying trends and anomalies in system behavior over time.
Logs: Timestamped records of discrete events occurring within a system. Providing detailed context about specific occurrences, errors or transactions. They are essential for debugging issues and understanding the sequence of events leading to a problem.
Traces: Distributed event spans follow the path of a request as it moves through various components of a distributed system. Helping visualize the flow and often the bottlenecks in complex architectures.
The three above are often referenced together as typical fundamental pieces of observability. Recently, another form has gotten more and more attention and has emerged as a crucial fourth pillar as well:
- Profiles. Samples system-wide to identify non-optimal code paths in applications. However, most time-series databases aim for only one or a few types of time-series data, which means you are likely to end up deploying lots of databases to make use of various time-series data:
| Data Type | Use Scenario | Popular Database | Languages |
|---|---|---|---|
| Metrics | Performance monitoring, resource utilization tracking | Prometheus, InfluxDB, Graphite | PromQL |
| Logs | Debugging, security analysis, audit trails | Elasticsearch, Splunk, Loki | LogQL, LogsQL, EQL, ... |
| Traces | Distributed system performance analysis, request flow tracking | Jaeger, Zipkin, Tempo | API |
| Profiles | Sampling CPU usage | ? | ? |
Ideally, we'd naturally expect these various types of time-series data to work together to provide a comprehensive view of a highly distributed system. But the crucial truth is not only the data have to be stored in separate systems, even the query languages are divorced. Correlating these different types of time-series data is nothing more than an unrealistic dream. Let alone the observability infrastructure makes the entire system's architecture way worse.
Hence, we built GreptimeDB, which wishes to make a significant impact on this chaotic landscape.
GreptimeDB's Unified Storage
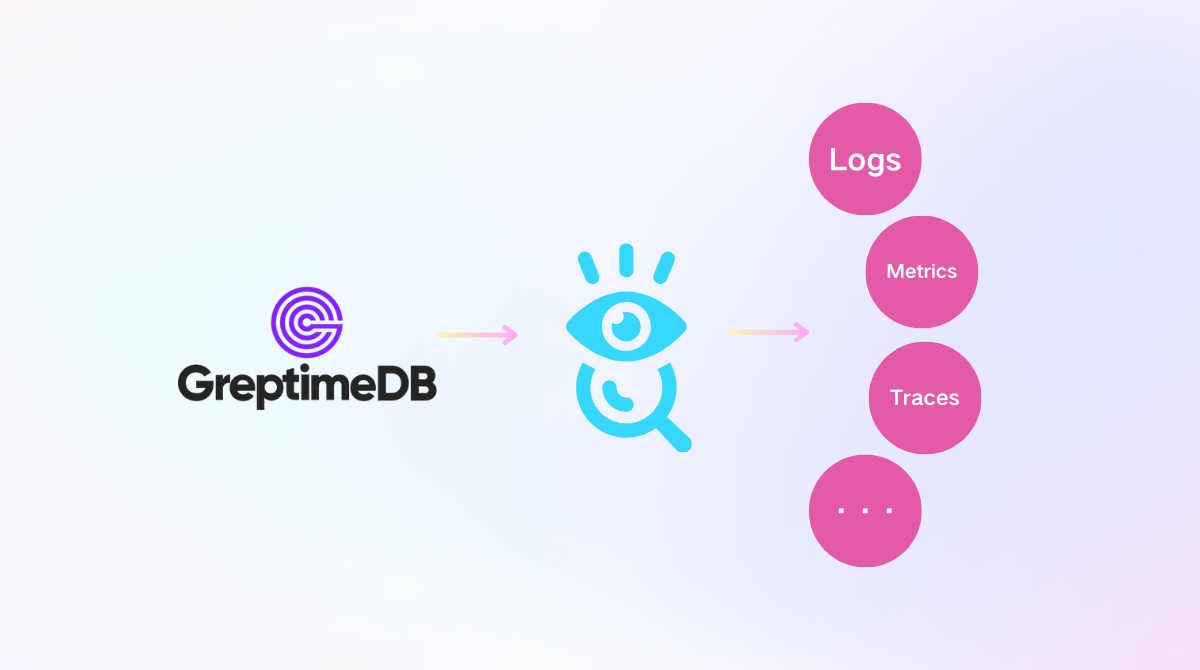
GreptimeDB aims to be a unified storage for various kinds of time-series data that can handle and correlate these different types in one single database, unleashing analysis capabilities and data value for more accurate predictions and faster root cause analysis.
Modeling From Reality and For Reality
Before diving in, let's discuss how GreptimeDB models time-series data.
Despite metrics or traces, all different kinds of forms are projections of the program entity, making it observable for our developers. In other words, we don't think either metrics or logs or anything else is distinguishable enough to make a dedicated database for each, at least from the storage perspective. This doesn't make sense - all of them are just from different angles of projection of one identical thing. That's the way we model time-series data: focus on the fundamental things that can mostly reflect reality, instead of focusing on the projected shadow.
The closer our model gets to reality, the more we can observe reality. This is the experience of physical science.

Two different space telescope photos give us completely different impressions. Ignore technical limitations such as mirror size or glass crafting, we still can observe much more information through Webb. Because it brings lots of new sensors that make Webb capable of handling a broader infrared range. Simply a step towards the real world, the reality.
Unified Model
Consider how the time-series data is generated, it merely associates a group of values with two things: an entity that produces the value, and time. Where the value can be anything we want to use and visualize, like metrics, logs or trace spans. The entity is the thing we want to observe, a node, an API or a service. Reflecting on practice, we categorize them into three semantic types:
Timestamp: A fundamental element for all time-series data, allowing for precise temporal tracking and associated with physical time.
Tags: Metadata elements that can serve as identifiers or categorization markers for distinguishing different entities.
Fields: The actual data values, which can be multi-dimensional, accommodating complex metrics, log data or profile events etc.
This simple yet versatile structure enables GreptimeDB to efficiently store and query different types of observability data within a unified framework. And do optimizations special for time-series scenarios that focus on reducing storage cost and accelerating queries.
Here is what features and benefits GreptimeDB as a unified time-series storage provides.
Advanced Features and Benefits
First and most intuitively, GreptimeDB promises simplified architecture and infrastructure. It's really hard to maintain a complex business system. We don't want another mess of the infra system. GreptimeDB consolidates (or from our perspective, this is how it should be from the very beginning) multiple time-series data types into a single system. Significantly reduces the operational complexity and cost associated with maintaining separated storage solutions for metrics, logs, traces and more.
Supercharged query capabilities, of course. It was hard or even impossible to pin complex issues down with different sources of context in different databases. You simply can't associate an unexpected spike metric with related logs when they are physically in different places. GreptimeDB as a centralized data storage on the other hand, enables faster and more accurate identification of issues by allowing seamless correlation between different data types. In short, GreptimeDB gives you a holistic understanding of your system.
Our unified storage solutions can also lead to significant cost savings by eliminating the need for multiple specialized storage systems. This saving is from many aspects, either visible or invisible. GreptimeDB's storage engine is optimized for time-series data, providing efficient compression and indexing techniques that work across all data types to save storage service costs. This consolidation also reduces licensing costs and minimizes the human cost required to manage and maintain separate data silos. In our test scenarios, we can save 10~100x storage costs compared with other famous time-series solutions. And this measurement only includes the visible storage cost part.
Outlook and Future Trends
The future of observability is poised for significant advancements, driven by emerging technologies and evolving software landscapes. We believe in a future where observability becomes more intelligent, integrated, and essential to maintaining the reliability and performance of increasingly complex systems. GreptimeDB aims to shape that future with our communities.
About Greptime
Greptime offers industry-leading time series database products and solutions to empower IoT and Observability scenarios, enabling enterprises to uncover valuable insights from their data with less time, complexity, and cost.
GreptimeDB is an open-source, high-performance time-series database offering unified storage and analysis for metrics, logs, and events. Try it out instantly with GreptimeCloud, a fully-managed DBaaS solution—no deployment needed!
The Edge-Cloud Integrated Solution combines multimodal edge databases with cloud-based GreptimeDB to optimize IoT edge scenarios, cutting costs while boosting data performance.
Star us on GitHub or join GreptimeDB Community on Slack to get connected.


