On this page
Recently, DeepSeek, a large language model (LLM) application, has gained significant attention for its powerful capabilities, often praised as a groundbreaking innovation. Like Greptime, which delivers high-performance and cost-efficient data infrastructure solutions, DeepSeek stands out not only for its technological advancements but also for its efficiency. As a company committed to driving innovation, Greptime actively engages with the global tech community to explore and advance emerging technologies.
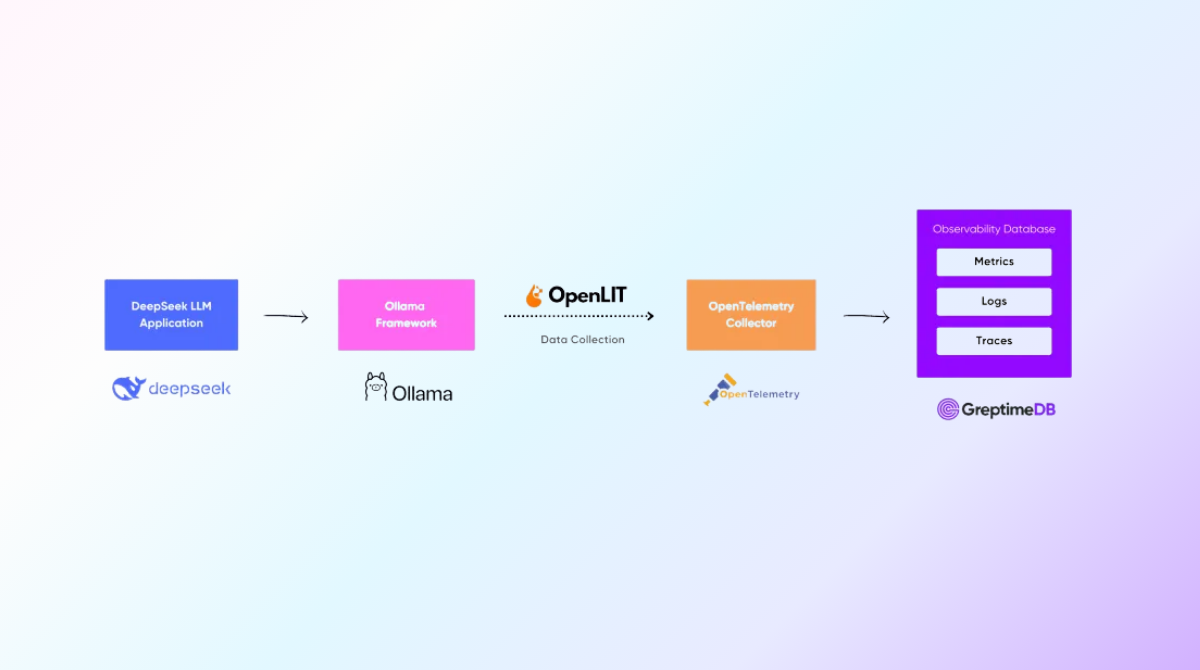
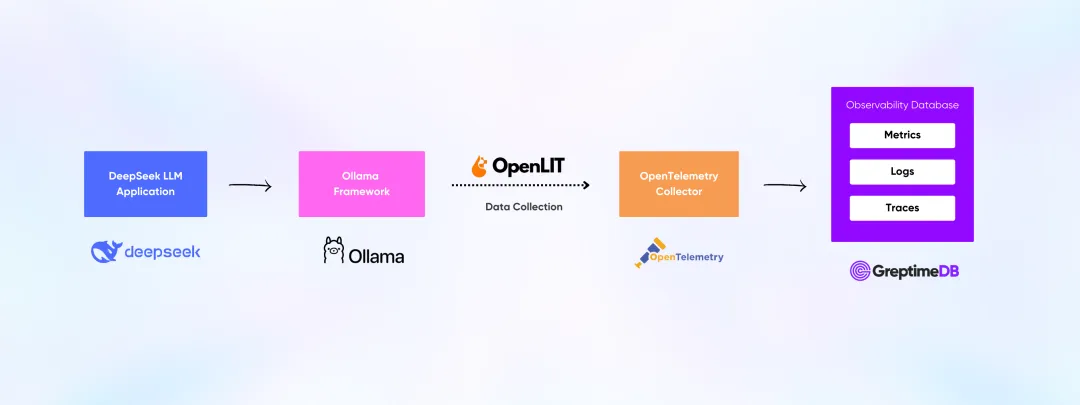
GreptimeDB, as a unified observability database, fully supports the [OpenTelemetry data protocol](link here), enabling it to act as a backend for Otel Collector while storing different data formats such as metrics, traces, and logs.
Ollama, a lightweight local framework for running LLM applications, allows easy deployment and operation of various LLMs. Effective monitoring is critical for ensuring the stability and reliability of these services. This article provides a detailed guide on how to utilize GreptimeDB and OpenTelemetry to achieve comprehensive monitoring of a DeepSeek LLM application deployed with Ollama.
Installing and Running Ollama and DeepSeek R1 Model
To get started, you can download the appropriate installation package for your operating system from Ollama's official website. On macOS, you can easily install Ollama using Homebrew:
bash
brew install ollamaAfter installation, confirm that Ollama is installed correctly:
bash
ollama --versionFor this example, the installed version is 0.5.7:
bash
ollama version is 0.5.7To start Ollama:
bash
ollama serveNext, pull and run the DeepSeek model. As this example uses an older MacBook Pro, we will use the DeepSeek R1 1.5b model:
bash
ollama run deepseek-r1:1.5bIf the model is successfully downloaded, you will enter the interactive interface for Ollama and DeepSeek:
bash
$ ollama run deepseek-r1:1.5b
>>> /?
Available Commands:
  /set            Set session variables
  /show           Show model information
  /load <model>   Load a session or model
  /save <model>   Save your current session
  /clear          Clear session context
  /bye            Exit
  /?, /help       Help for a command
  /? shortcuts    Help for keyboard shortcuts
Use """ to begin a multi-line message.
With this, Ollama and DeepSeek R1 1.5b are properly configured. Let’s try asking DeepSeek a question:
bash
curl http://localhost:11434/api/chat -d '{
  "model": "deepseek-r1:1.5b",
  "messages": [
    {
      "role": "user",
      "content": "why is the sky blue?"
    }
    ],
   "stream": false
}'
DeepSeek will return the generated response.
Configuring GreptimeDB and Otel Collector
To set up GreptimeDB and OpenTelemetry (Otel) Collector, we use Docker Compose for ease of configuration and deployment.
Begin by creating a docker-compose.yml file:
yaml
services:
  greptimedb:
    image: docker.io/greptime/greptimedb:v0.11.2
    command: standalone start --http-addr=0.0.0.0:4000 --rpc-addr=0.0.0.0:4001 --mysql-addr=0.0.0.0:4002 --postgres-addr 0.0.0.0:4003
    ports:
      - 4000:4000
      - 4001:4001
      - 4002:4002
      - 4003:4003
    networks:
      - demo-network
    healthcheck:
      test: [ "CMD", "curl", "-f", "http://127.0.0.1:4000/health" ]
      interval: 3s
      timeout: 3s
      retries: 5
  otel-collector:
    image: otel/opentelemetry-collector-contrib
    volumes:
      - ./otel-collector-config.yaml:/etc/otelcol-contrib/config.yaml
    ports:
      - 13133:13133 # health_check extension
      - 4317:4317 # OTLP gRPC receiver
      - 4318:4318 # OTLP http receiver
    networks:
      - demo-network
networks:
  demo-network:
Next, create the otel-collector-config.yaml file:
yaml
receivers:
  otlp:
    protocols:
      grpc:
        endpoint: 0.0.0.0:4317
      http:
        endpoint: 0.0.0.0:4318
exporters:
  debug:
    verbosity: detailed
  otlp:
    endpoint: localhost:4317
    tls:
      insecure: true
  otlphttp:
    endpoint: http://greptimedb:4000/v1/otlp
    tls:
      insecure: true
extensions:
  health_check:
service:
  extensions: [health_check]
  pipelines:
    traces:
      receivers: [otlp]
      exporters: [debug,otlphttp]
    metrics:
      receivers: [otlp]
      exporters: [debug,otlphttp]
    logs:
      receivers: [otlp]
      exporters: [debug,otlphttp]
In this configuration, we direct the collected metrics, traces, and logs from the Otel Collector to the backend otlphttp exporter, which is configured to interface with GreptimeDB at http://greptimedb:4000/v1/otlp.
Starting GreptimeDB and Otel Collector
To start both GreptimeDB and the Otel Collector, simply use Docker Compose:
bash
docker-compose upUpon successful startup, you should see logs like the following:
bash
greptimedb-1      | 2025-02-10T07:44:07.951605Z  INFO servers::grpc: gRPC server is bound to 0.0.0.0:4001
...
otel-collector-1  | 2025-02-10T07:44:07.980Z        info        [email protected]/service.go:275        Everything is ready. Begin running and processing data.
You can verify that everything is running by visiting the GreptimeDB dashboard at http://localhost:4000/dashboard/.
Monitoring Ollama Application with OpenLIT
OpenLIT is an open-source AI engineering platform designed to provide complete observability for LLMs, including GPU monitoring, evaluation, and prompt management. With its SDK, OpenLIT can automatically instrument LLM applications based on the Ollama framework, enabling performance tracking, token usage, and user interactions.
To set it up, install the necessary Python dependencies:
bash
pip install ollama --quiet
pip install langchain --quiet
pip install langchain-ollama --quiet
pip install openlit --quiet
Initialize OpenLIT in your AI application and send the collected data to the Otel Collector's 4318 endpoint:
python
import openlit
openlit.init(otlp_endpoint="http://127.0.0.1:4318", disable_batch=True)
Then, run a simple script to interact with DeepSeek and monitor the results:
python
from langchain_ollama.llms import OllamaLLM
openlit.init(otlp_endpoint="http://127.0.0.1:4318", disable_batch=True)
llm = OllamaLLM(model='deepseek-r1:1.5b')
print(llm.invoke("Tell me a joke"))
Run the script:
python
python joke.pyThe output will be a light-hearted joke generated by DeepSeek:
bash
<think>

</think>

Sure! Here's a light one:

Why don’t skeletons fight each other?
Because they have Genders.
That's a good joke!
If everything is running smoothly, the Otel Collector will have written the trace and metric data to GreptimeDB. We can then check the tables in GreptimeDB by connecting to port 4002 using a MySQL client:
sql
mysql -h 0.0.0.0 -P 4002Execute the show tables command:
sql
mysql> show tables;
+----------------------------+
| Tables |
+----------------------------+
| gen_ai_total_requests |
| gen_ai_usage_cost_bucket |
| gen_ai_usage_cost_count |
| gen_ai_usage_cost_sum |
| gen_ai_usage_input_tokens |
| gen_ai_usage_output_tokens |
| gen_ai_usage_total_tokens |
| numbers |
| opentelemetry_traces |
+----------------------------+
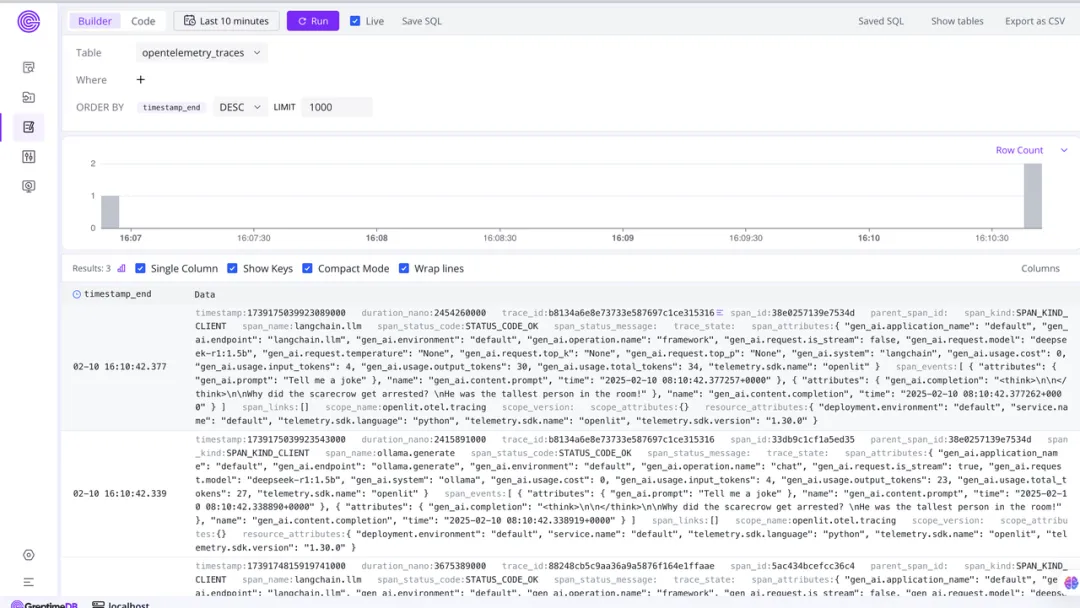
9 rows in set (0.01 sec)Here, the opentelemetry_traces table contains the trace data, while the other gen_ai prefixed tables store the metrics collected by OpenLIT.
Visualizing Data in GreptimeDB Dashboard
Finally, with all the metrics and traces collected, you can visualize the data in GreptimeDB’s dashboard. To view log data, navigate to the log query page.
To get the total request count, execute an SQL query:
sql
select * from gen_ai_total_requests;Output:
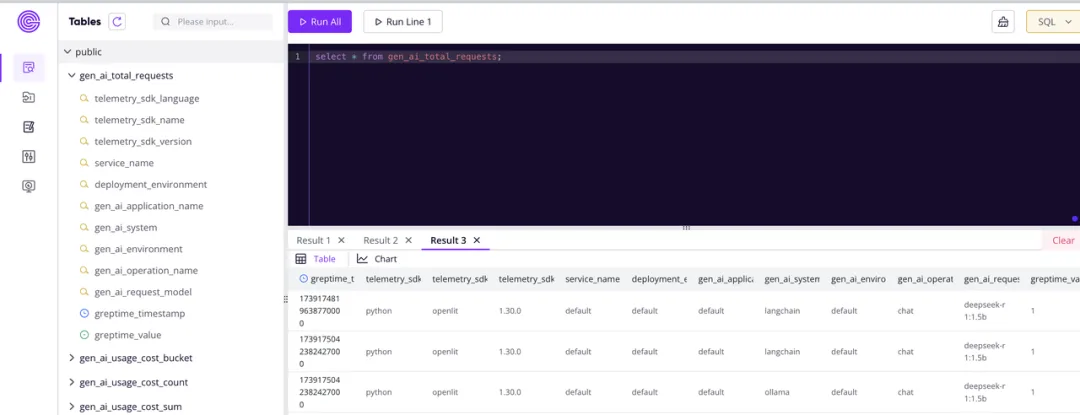
You can also integrate Grafana to display metrics and traces from GreptimeDB, as GreptimeDB supports MySQL and Prometheus data sources. For more details, check out the GreptimeDB-Grafana integration documentation.
The full code for this demo can be found here: GitHub - GreptimeTeam.
About Greptime
Greptime offers industry-leading time series database products and solutions to empower IoT and Observability scenarios, enabling enterprises to uncover valuable insights from their data with less time, complexity, and cost.
GreptimeDB is an open-source, high-performance time-series database offering unified storage and analysis for metrics, logs, and events. Try it out instantly with GreptimeCloud, a fully-managed DBaaS solution—no deployment needed!
The Edge-Cloud Integrated Solution combines multimodal edge databases with cloud-based GreptimeDB to optimize IoT edge scenarios, cutting costs while boosting data performance.
Star us on GitHub or join GreptimeDB Community on Slack to get connected.


