On this page
Key Findings
- Compared to GreptimeDB v0.9, which initially introduced log-related functionalities, v0.12 delivers substantial improvements in read/write performance and resource efficiency, achieving up to 67.5% higher write throughput while reducing CPU usage to 40%.
- In log ingestion scenarios, whether handling structured or unstructured data, GreptimeDB demonstrates exceptional write throughput, reaching 111% of ClickHouse’s performance and 470% of Elasticsearch’s. Furthermore, when leveraging cost-efficient object storage, there is no significant performance degradation.
- For log queries, GreptimeDB remains competitive with ClickHouse and Elasticsearch, with each database excelling in different use cases. Thanks to multi-level caching optimizations, GreptimeDB sustains high query performance even when data is stored on object storage, achieving an optimal cost-to-performance balance.
- With its columnar storage and advanced compression algorithms, GreptimeDB offers the best compression ratio among the three databases, with persistent storage requirements at only 50% of ClickHouse’s and 12.7% of Elasticsearch’s, effectively reducing long-term data retention costs.
Benchmark Scenarios
Test Data and Methodology
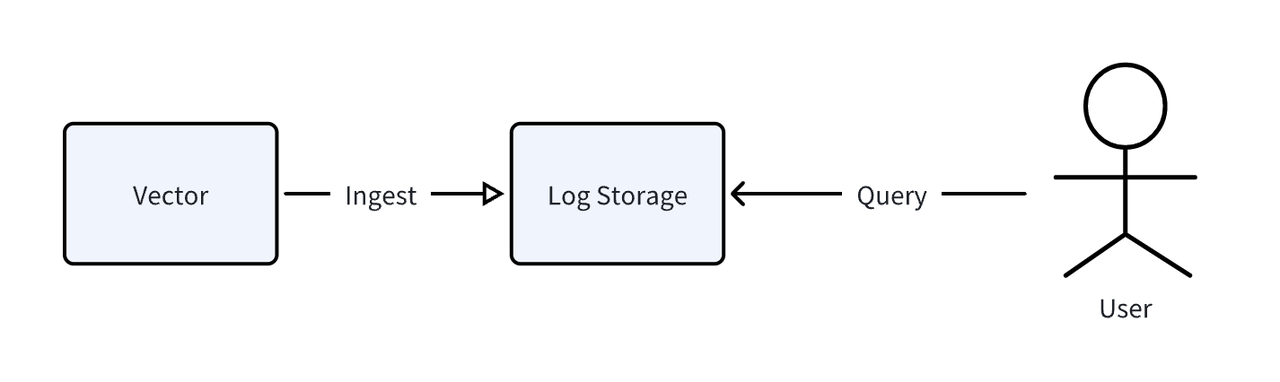
We used nginx access logs as the input data, with a typical log entry structured as follows:
plaintext
129.37.245.88 - meln1ks [01/Aug/2024:14:22:47 +0800] "PATCH /observability/metrics/production HTTP/1.0" 501 33085The log data was generated and ingested using Vector, an open-source observability pipeline. The overall benchmarking process is illustrated below:
We tested two data models based on different storage and query needs:
- Structured Data Model: Logs were parsed into individual fields, with each field stored in separate columns. Queries targeted specific columns for filtering and retrieval.
- Unstructured Data Model: Except for the timestamp field, the entire log message was stored as a single text field with full-text indexing enabled. Keyword-based queries were used for searches.
Hardware and Software Setup
Hardware Platform
| Component | Configuration |
|---|---|
| Server Model | AWS c5d.2xlarge, 8 vCPU 16GiB Memory |
| Operating System | Ubuntu24.04 LTS |
Software Versions
| Database | Version |
|---|---|
| GreptimeDB | v0.12 |
| ClickHouse | 24.9.1.219 |
| Elasticsearch | 8.15.0 |
Note: Detailed database configurations are provided in the appendix.
Read/Write Performance Benchmarking
Write Throughput
| Database | Structured Model Avg. TPS | Unstructured Model Avg. TPS |
|---|---|---|
| GreptimeDB (v0.9) | 127,226 | 95,238 |
| GreptimeDB (v0.12) | 185,535 | 159,502 |
| GreptimeDB (v0.12, S3) | 182,272 | 154,209 |
| ClickHouse | 166,667 | 136,612 |
| Elasticsearch | 39,401 | 28,058 |
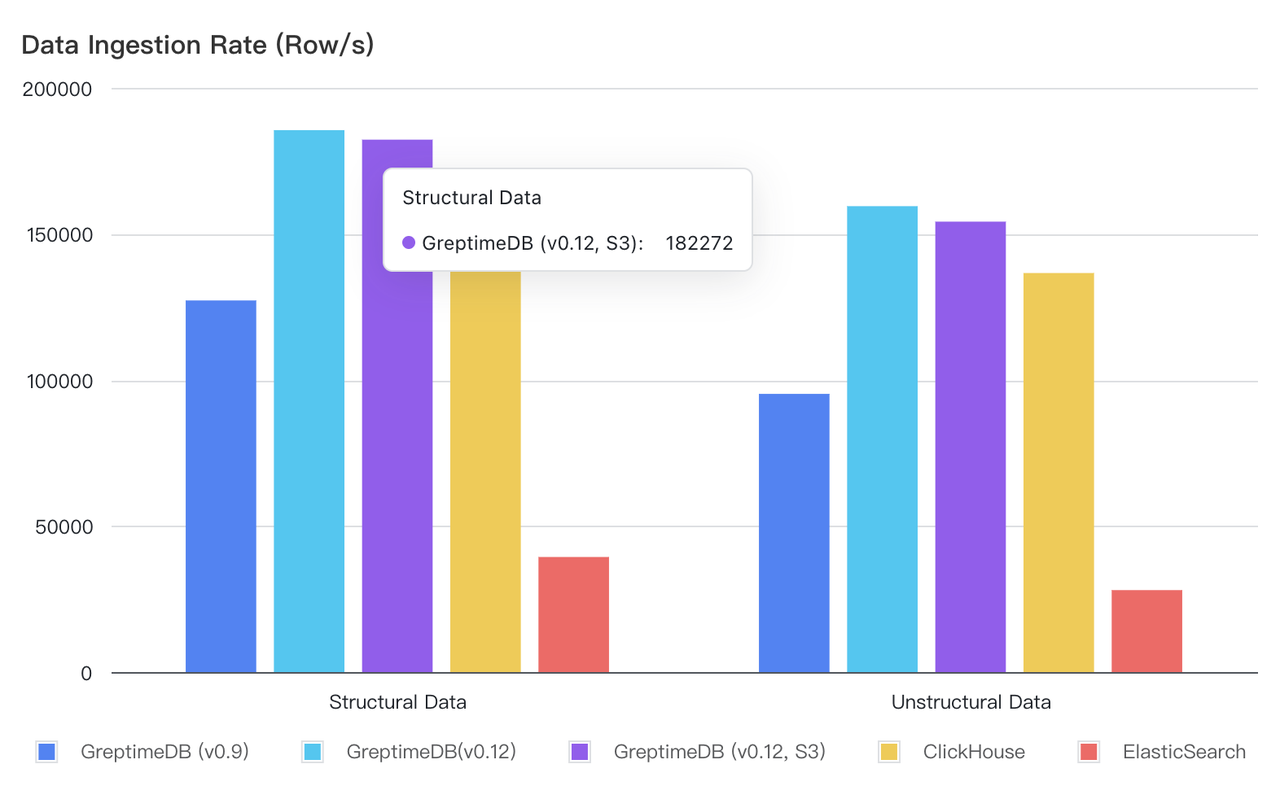
Observations:
- GreptimeDB v0.12 significantly improves write performance, achieving a 45.8% increase in structured data throughput and a 67.5% increase in unstructured data throughput compared to v0.9.
- GreptimeDB outperforms ClickHouse in write throughput, while both significantly surpass Elasticsearch. For structured logs, GreptimeDB achieves 4.7x Elasticsearch’s throughput, while for unstructured logs, it reaches 5.7x.
- When using AWS S3 for storage, GreptimeDB’s write throughput is reduced by only 1–2%, making it a cost-efficient solution without compromising performance.
Query Performance
Six different query types were evaluated to simulate real-world log analysis use cases:
- Count Query: Count total rows in the dataset.
- Keyword Matching: Filter logs based on user, method, endpoint, version, and status code.
- Time Range Query: Retrieve approximately half of the dataset (~50 million rows) within a time range.
- Mid-Time Range Query: Retrieve 1,000 rows within a middle-time window.
- Recent-Time Range Query: Retrieve 1,000 rows within the most recent minute.
- Keyword Matching + Time Range Query: Filter logs within a specific time range using keyword matching.
Note:
- Both GreptimeDB and ClickHouse use SQL for queries. GreptimeDB supports MySQL client tools, whereas ClickHouse provides its own command-line client: ClickHouse CLI.
- For Elasticsearch, we used the search REST API: Elasticsearch Search API.
Structured Data Queries
| Query Type (ms) | GreptimeDB | GreptimeDB on S3 | ClickHouse | Elasticsearch |
|---|---|---|---|---|
| Count Query | 6 | 6 | 46 | 10 |
| Keyword Matching | 22.8 | 24.7 | 52 | 134 |
| Time range | 512.3 | 653.9 | 413 | 16 |
| Middle Time Range | 18.6 | 15.7 | 56 | 32 |
| Recent Time Range | 16.1 | 11.8 | 133 | 25 |
| Keyword Matching+Range Query | 19 | 43.2 | 52 | 88 |
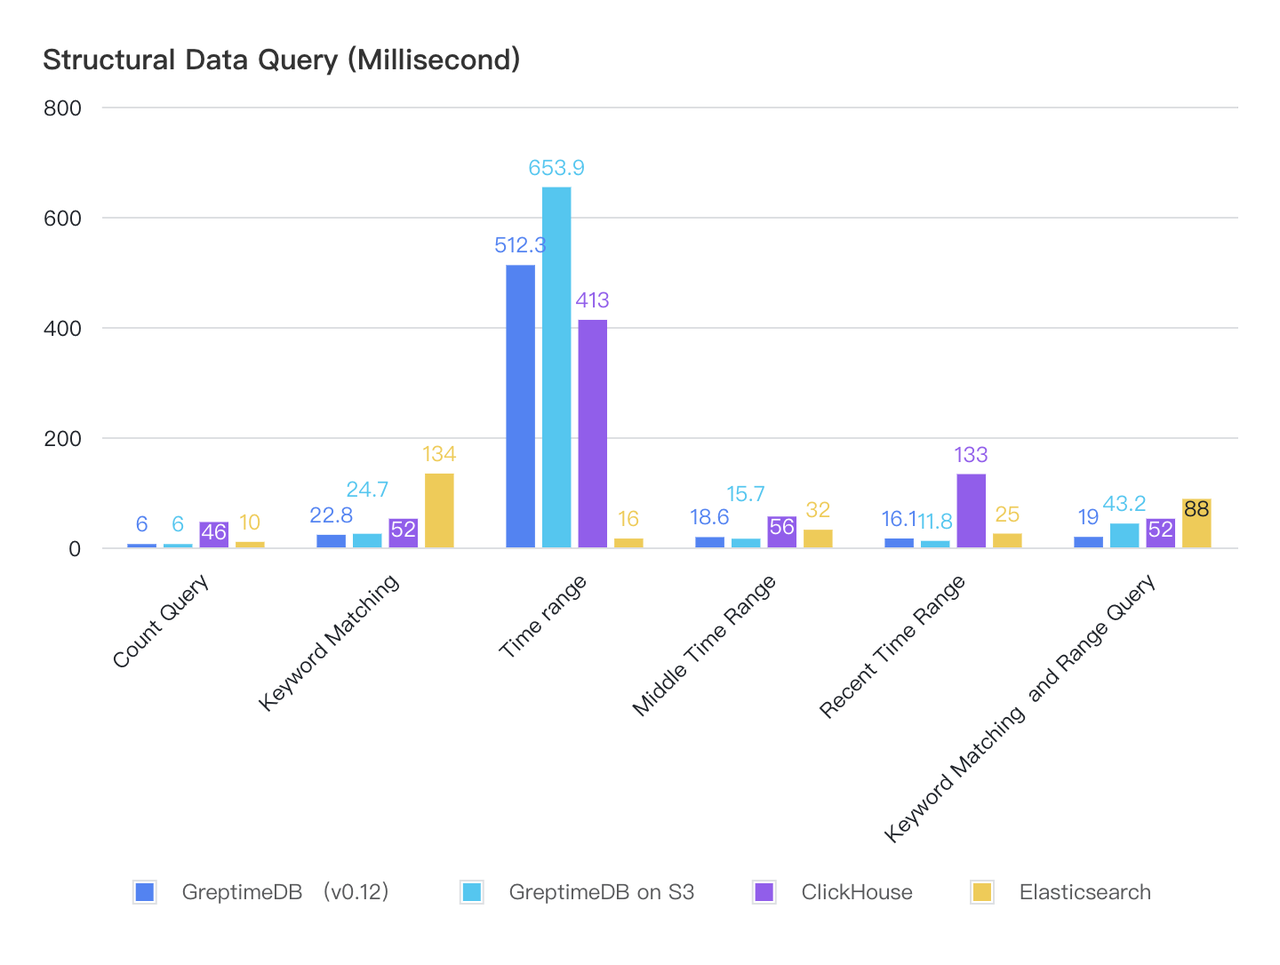
Findings:
- GreptimeDB and ClickHouse exhibit comparable query performance for structured data.
- For large time-range scans, GreptimeDB and ClickHouse experience noticeable latency increases but complete queries within a few hundred milliseconds.
- Thanks to multi-level caching, GreptimeDB maintains stable performance even when data is stored on S3.
Unstructured Data
| Query Type & Execution Time (ms) | GreptimeDB | GreptimeDB on S3 | ClickHouse | Elasticsearch |
|---|---|---|---|---|
| Count query | 6 | 6 | 8 | 9 |
| Keyword matching | 2547 | 2478 | 2080 | 161 |
| Time range | 1166 | 1330 | 572 | 10 |
| Middle Time Range | 22.4 | 32.2 | 51 | 26 |
| Recent Time Range | 13.5 | 13.8 | 606 | 22 |
| Keyworld Matching and Range Query | 331.8 | 350.2 | 1610 | 122 |
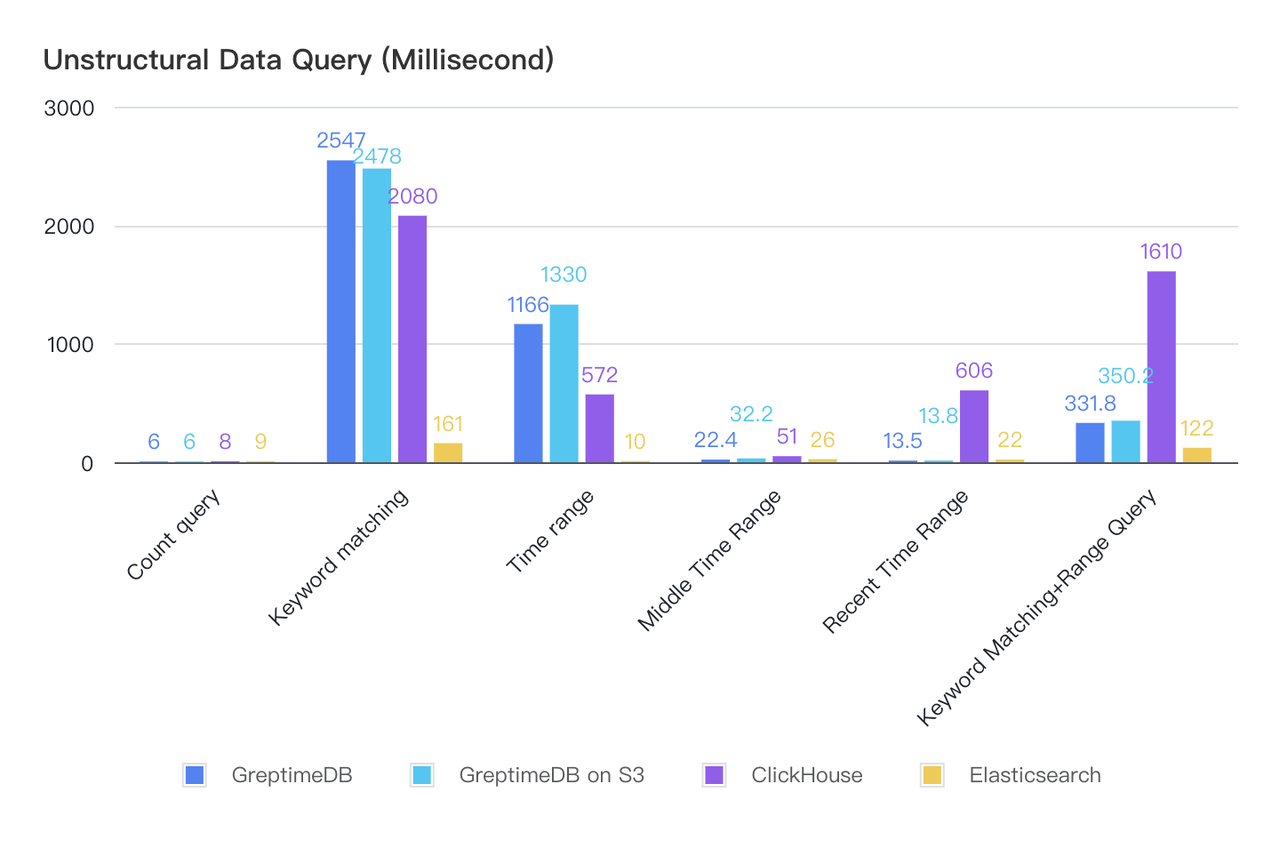
- GreptimeDB v0.12 has improved performance in most unstructured data queries compared to v0.9.
- Both GreptimeDB and ClickHouse experience performance degradation in unstructured data queries, falling behind Elasticsearch.
Resource Utilization and Compression Rate
Resource Utilization
With a write rate limited to 20,000 rows per second, we compared CPU and memory usage for GreptimeDB, ClickHouse, and Elasticsearch:
| Database | Structured Model | Structured Model | Unstructured Model | Unstructured Model |
|---|---|---|---|---|
| Parameter | CPU (%) | Memory (MB) | CPU (%) | Memory (MB) |
| GreptimeDB (v0.9) | 33.24 | 337 | 16.79 | 462 |
| GreptimeDB (v0.12) | 13.2 | 408 | 10.29 | 624 |
| ClickHouse | 9.56 | 611 | 26.77 | 732 |
| Elasticsearch | 40.22 | 9883 | 47.54 | 9320 |
- ClickHouse has the lowest CPU usage, while GreptimeDB is slightly higher but shows significant improvements over v0.9 (from 33.24% to 13.2% in structured data and from 16.79% to 10.29% in unstructured data).
- GreptimeDB consumes the least memory, whereas Elasticsearch’s memory usage is an order of magnitude higher than both GreptimeDB and ClickHouse.
- Both GreptimeDB and ClickHouse employ LSM Tree-like structures, resulting in significant memory fluctuations.
Compression Rate
We tested data compression by writing approximately 10GB of raw data and measuring the persistent storage size across different databases:
| Database | Structured Model | Structured Model | Unstructured Model | Unstructured Model |
|---|---|---|---|---|
| Parameter | Data Size (GB) | Compression Ratio | Data Size (GB) | Compression Ratio |
| GreptimeDB | 1.3 | 13% | 3.3 | 33% |
| ClickHouse (Before Compression) | 7.6 | 26% | 15.5 | 51% |
| ClickHouse (After Compression) | 2.6 | 26% | 5.1 | 51% |
| Elasticsearch (Before Compression) | 14.6 | 102% | 19 | 172% |
| Elasticsearch (After Compression) | 10.2 | 102% | 17.2 | 172% |
Key takeaways:
- GreptimeDB v0.12 maintains a strong compression advantage, storing structured data at just 13% of the original size and unstructured data at 33%.
- Structured data models leverage columnar encoding and adaptive compression strategies, achieving significantly better compression than unstructured models.
Note: ClickHouse and Elasticsearch continuously compress data in the background. The table above records both pre- and post-compression storage sizes.
Conclusions
GreptimeDB v0.12 brings significant improvements in both write and query performance, making it an efficient and cost-effective choice for log processing. With superior write throughput, robust storage efficiency, and competitive query performance, GreptimeDB stands as a compelling alternative to ClickHouse and Elasticsearch in observability and logging use cases.
Appendix
Software Configuration
- GreptimeDB (Local Storage): Default settings were used.
- GreptimeDB (S3 Storage): Configured as follows
toml
[storage]
type = "S3"
bucket = "<bucket_name>"
root = "log_benchmark"
access_key_id = "<ACCESS_KEY>"
secret_access_key = "<SECRET_KEY>"
endpoint = "<S3_ENDPOINT>"
region = "<S3_REGION>"
cache_path = "<CACHE_PATH>"
cache_capacity = "20G"

[[region_engine]]
[region_engine.mito]
enable_experimental_write_cache = true
experimental_write_cache_size = "20G"
Vector Log Parsing Configuration
toml
[transforms.parse_logs]
type = "remap"
inputs = ["demo_logs"]
source = '''
. = parse_regex!(.message, r'^(?P<ip>\S+) - (?P<user>\S+) \[(?P<timestamp>[^\]]+)\] "(?P<method>\S+) (?P<path>\S+) (?P<http_version>\S+)" (?P<status>\d+) (?P<bytes>\d+)$')

# Convert timestamp to a standard format
.timestamp = parse_timestamp!(.timestamp, format: "%d/%b/%Y:%H:%M:%S %z")

# Convert status and bytes to integers
.status = to_int!(.status)
.bytes = to_int!(.bytes)
'''
Table Schema
Structured Data Model:
GreptimeDB
sql
-- Enables append mode and sets `user`, `path`, and `status` as tags (i.e., primary keys)
CREATE TABLE IF NOT EXISTS `test_table` (
    `bytes` Int64 NULL,
    `http_version` STRING NULL,
    `ip` STRING NULL,
    `method` STRING NULL,
    `path` STRING NULL,
    `status` SMALLINT UNSIGNED NULL,
    `user` STRING NULL,
    `timestamp` TIMESTAMP(3) NOT NULL,
    PRIMARY KEY (`user`, `path`, `status`),
    TIME INDEX (`timestamp`)
)
ENGINE=mito
WITH(
    append_mode = 'true'
);
ClickHouse
sql
--Use the default MergeTree engine, defining the same sorting key.
CREATE TABLE IF NOT EXISTS test_table
(
    bytes UInt64 NOT NULL,
    http_version String NOT NULL,
    ip String NOT NULL,
    method String NOT NULL,
    path String NOT NULL,
    status UInt8 NOT NULL,
    user String NOT NULL,
    timestamp String NOT NULL,
)
ENGINE = MergeTree()
ORDER BY (user, path, status);
Elasticsearch
json
{
  "vector-2024.08.19": {
    "mappings": {
      "properties": {
        "bytes": {
          "type": "long"
        },
        "http_version": {
          "type": "text",
          "fields": {
            "keyword": {
              "type": "keyword",
              "ignore_above": 256
            }
          }
        },
        "ip": {
          "type": "text",
          "fields": {
            "keyword": {
              "type": "keyword",
              "ignore_above": 256
            }
          }
        },
        "method": {
          "type": "text",
          "fields": {
            "keyword": {
              "type": "keyword",
              "ignore_above": 256
            }
          }
        },
        "path": {
          "type": "text",
          "fields": {
            "keyword": {
              "type": "keyword",
              "ignore_above": 256
            }
          }
        },
        "status": {
          "type": "long"
        },
        "timestamp": {
          "type": "date"
        },
        "user": {
          "type": "text",
          "fields": {
            "keyword": {
              "type": "keyword",
              "ignore_above": 256
            }
          }
        }
      }
    }
  }
}
Unstructured Data Model
GreptimeDB
sql
--message column enables the FULLTEXT option, which turns on full-text indexing.
CREATE TABLE IF NOT EXISTS `test_table` (
    `message` STRING NULL FULLTEXT WITH(analyzer = 'English', case_sensitive = 'false'),
    `timestamp` TIMESTAMP(3) NOT NULL,
    TIME INDEX (`timestamp`)
)
ENGINE=mito
WITH(
    append_mode = 'true'
);
ClickHouse
sql
SET allow_experimental_full_text_index = true;
CREATE TABLE IF NOT EXISTS test_table
(
    message String,
    timestamp String,
    INDEX inv_idx(message) TYPE full_text(0) GRANULARITY 1
)
ENGINE = MergeTree()
ORDER BY tuple();
Elasticsearch
json
{
  "vector-2024.08.19": {
    "mappings": {
      "properties": {
        "message": {
          "type": "text",
          "fields": {
            "keyword": {
              "type": "keyword",
              "ignore_above": 256
            }
          }
        },
        "service": {
          "type": "text",
          "fields": {
            "keyword": {
              "type": "keyword",
              "ignore_above": 256
            }
          }
        },
        "source_type": {
          "type": "text",
          "fields": {
            "keyword": {
              "type": "keyword",
              "ignore_above": 256
            }
          }
        },
        "timestamp": {
          "type": "date"
        }
      }
    }
  }
}
About Greptime
Greptime offers industry-leading time series database products and solutions to empower IoT and Observability scenarios, enabling enterprises to uncover valuable insights from their data with less time, complexity, and cost.
GreptimeDB is an open-source, high-performance time-series database offering unified storage and analysis for metrics, logs, and events. Try it out instantly with GreptimeCloud, a fully-managed DBaaS solution—no deployment needed!
The Edge-Cloud Integrated Solution combines multimodal edge databases with cloud-based GreptimeDB to optimize IoT edge scenarios, cutting costs while boosting data performance.
Star us on GitHub or join GreptimeDB Community on Slack to get connected.


