On this page
JSONBench is an OLAP benchmark suite introduced by ClickHouse earlier this year. Unlike previous benchmarks, it focuses specifically on analytical queries over JSON documents. The benchmark utilizes 1 to 1000 million JSON documents exported from Bluesky and executes a set of carefully designed analytical queries. Initially, the benchmark includes databases such as ClickHouse, Elasticsearch, MongoDB, DuckDB, and Postgres, with VictoriaLogs added later.
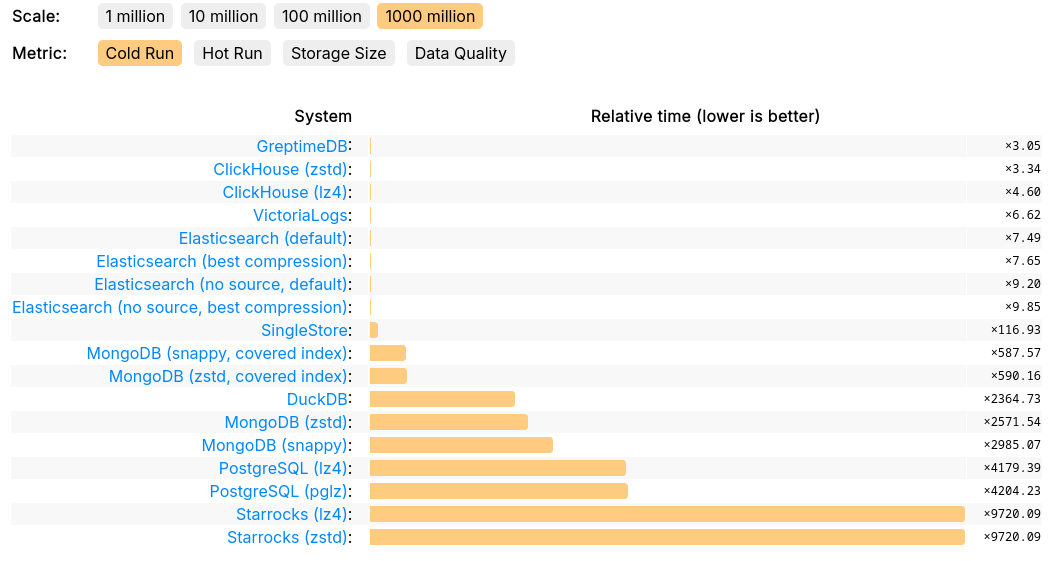
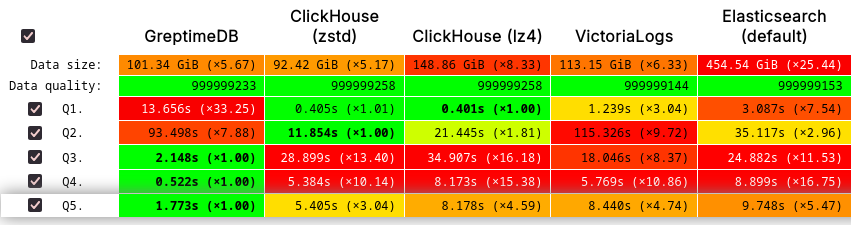
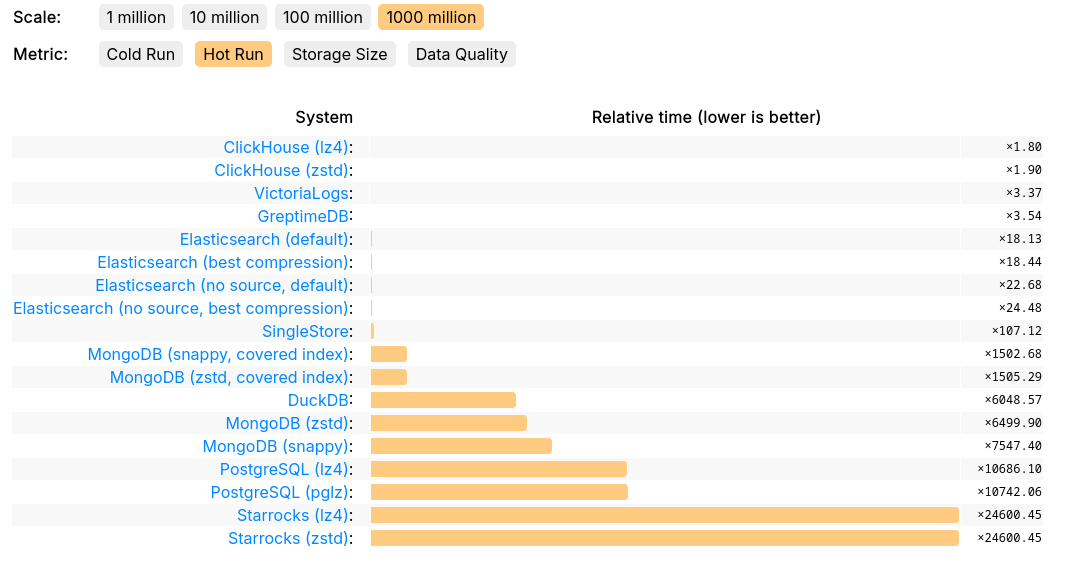
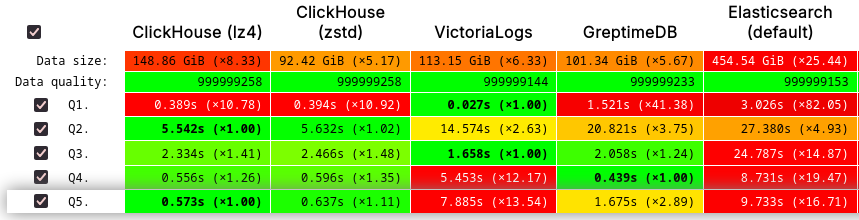
GreptimeDB's performance on JSONBench demonstrates its competitiveness in handling large-scale datasets, achieving results on par with ClickHouse and VictoriaLogs. In terms of query speed, GreptimeDB ranked No.1 in 1 billion cold run, and delivers improved or even top-tier performance for most queries, significantly outperforming solutions like ElasticSearch, DuckDB, StarRocks, and Postgres. Additionally, GreptimeDB excels in storage efficiency, consistently pushing the boundaries of modern storage data formats.
GreptimeDB is the next-generation real-time database designed to handle large-scale observability data. JSON documents have become a widely adopted format for collecting structured logs, and GreptimeDB addresses this trend with its built-in Pipeline (ETL) engine, which offers native support for JSON. Leveraging its cloud-native architecture, GreptimeDB fully utilizes object storage for primary data storage and Kubernetes for cluster management, significantly reducing costs and streamlining operations for real-world use cases.
In this blog, we’ll explore how GreptimeDB’s JSON capabilities perform in this benchmark. Additionally, we’ll dive into advanced features of GreptimeDB that go beyond the benchmark but offer substantial benefits for users.
Reproducing JSONBench on GreptimeDB
We’ll outline some essential aspects of reproducing GreptimeDB’s benchmark results. While you don’t need to follow these steps manually—they’re already automated in the scripts provided in the greptimedb folder of the JSONBench repository—it’s important to understand the process. Note that GreptimeDB v0.13.1 or later is required to run this benchmark.
In order to ingest JSON documents in GreptimeDB, we recommend using the log ingestion API. Although GreptimeDB has native JSON data type to store and query JSON data, for optimal performance and storage efficiency, we will extract specific metadata fields from JSON documents and use them as the primary key for data ordering, similar to how other databases process their data.
yaml
processors:
 - epoch:
   fields:
    - time_us
   resolution: microsecond
 - simple_extract:
   fields:
    - commit, commit_collection
   key: "collection"
   ignore_missing: true
 - simple_extract:
   fields:
    - commit, commit_operation
   key: "operation"
   ignore_missing: true

transform:
 - fields:
   - did
  type: string
 - fields:
   - kind
   - commit_collection
   - commit_operation
  type: string
  index: inverted
  tag: true
 - fields:
   - commit
  type: json
  on_failure: ignore
 - fields:
   - time_us
  type: epoch, us
  index: timestamp
In this pipeline definition, collection, operation and kind are extracted directly as tag (primary key). The final DDL of bluesky will be like. This table will be created automatically thanks to pipeline's data definition.
sql
CREATE TABLE IF NOT EXISTS "bluesky" (
 "did" STRING NULL,
 "kind" STRING NULL INVERTED INDEX,
 "commit_collection" STRING NULL INVERTED INDEX,
 "commit_operation" STRING NULL INVERTED INDEX,
 "commit" JSON NULL,
 "time_us" TIMESTAMP(6) NOT NULL,
 TIME INDEX ("time_us"),
 PRIMARY KEY ("kind", "commit_collection", "commit_operation")
)
ENGINE=mito
WITH(
  append_mode = 'true'
)
Next, we need to slightly adjust GreptimeDB's http options to allow ingesting large dataset in batch, and disable timeout for analytical query.
sql
export GREPTIMEDB_STANDALONE__HTTP__BODY_LIMIT=1GB
export GREPTIMEDB_STANDALONE__HTTP__TIMEOUT=0
All set. No additional configuration or tuning is needed. Call start.sh from the GreptimeDB folder to trigger tests. Note that the standard benchmark runs on AWS EC2 m6i.x8large, similar configuration is required to reproduce the results.
Practical GreptimeDB in Real World
Object Storage
One aspect not covered in this benchmark is GreptimeDB’s unique ability to fully leverage object storage as its primary data backend. Unlike other solutions, GreptimeDB requires local disks only for caching purposes. This design allows users to store virtually unlimited amounts of data without incurring high costs, making it an ideal choice for large-scale observability workloads.
To demonstrate this capability, we tested the benchmark with 100 million documents using GreptimeDB configured with object storage and a fixed 1GB local disk cache. The results show that performance remains robust, with only a slight slowdown during the first query on a cold run. Subsequent queries perform efficiently, highlighting GreptimeDB’s ability to balance cost-effectiveness with high performance.
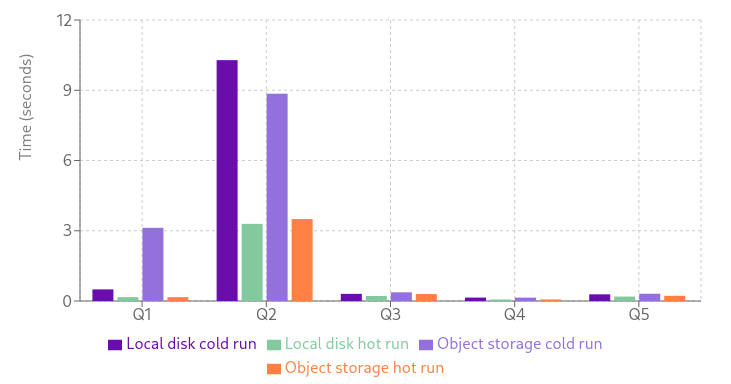
While the absolute value of Q1 may not be particularly meaningful—as it primarily reflects the time required to warm the cache—the rest of the data demonstrates that using object storage as the primary backend still delivers strong performance compared to local disk. In real-world scenarios, this translates to significant cost savings without compromising service quality.
In-Database Streaming
You may notice that for certain count queries, GreptimeDB performs slightly slower than top vendors. For these types of queries—or even more complex aggregations—GreptimeDB offers a built-in streaming engine to compute results incrementally. If you’re using such queries for dashboards or real-time analytics, we highly recommend leveraging our streaming engine to significantly improve performance. Take Q1 as an example: the query can be rewritten as a Flow task:
sql
CREATE FLOW live_count
SINK TO bluesky_count_by_event
AS
SELECT
  commit_collection AS event,
  count(1) AS cnt
FROM
  bluesky
GROUP BY event;
With this approach, results are automatically updated during data ingestion. In our tests using the 100-million-document suite with Flow configured, the count query becomes nearly O(1) in terms of data size. Retrieving the results takes only a few milliseconds, compared to 165ms when computing from scratch.
sql
public=> select event, cnt from bluesky_q1 order by cnt desc;
      event      |  cnt
----------------------------+----------
 app.bsky.feed.like     | 44994712
 app.bsky.graph.follow   | 36362556
 app.bsky.feed.post     | 8740921
 app.bsky.feed.repost    | 5625691
 app.bsky.graph.block    | 1433188
 app.bsky.actor.profile   | 1118161
 app.bsky.graph.listitem  |  913702
              |  603435
 app.bsky.graph.listblock  |  86211
 app.bsky.graph.list    |  35906
 app.bsky.graph.starterpack |  35656
 app.bsky.feed.threadgate  |  28676
 app.bsky.feed.postgate   |  12751
 app.bsky.feed.generator  |   7636
 app.top8.theme       |   246
 app.bsky.labeler.service  |    40
 app.kollective.catalog   |    23
 app.kollective.profile   |    3
(18 rows)

Time: 4.522 ms
The Conclusions of JSONBench Result
The JSONBench results demonstrate GreptimeDB’s exceptional capabilities in events and logs processing. We also extend our appreciation to ClickHouse for creating such a robust benchmark framework and methodology. Looking ahead, we plan to adapt this framework to additional observability scenarios, such as Prometheus-style queries. Stay tuned for more updates!
About Greptime
Greptime offers industry-leading time series database products and solutions to empower IoT and Observability scenarios, enabling enterprises to uncover valuable insights from their data with less time, complexity, and cost.
GreptimeDB is an open-source, high-performance time-series database offering unified storage and analysis for metrics, logs, and events. Try it out instantly with GreptimeCloud, a fully-managed DBaaS solution—no deployment needed!
The Edge-Cloud Integrated Solution combines multimodal edge databases with cloud-based GreptimeDB to optimize IoT edge scenarios, cutting costs while boosting data performance.
Star us on GitHub or join GreptimeDB Community on Slack to get connected.


