On this page
When debugging slow queries in a database, one of the most useful tools in an engineer's toolkit is EXPLAIN ANALYZE. It shows how a query is executed step by step, how long each part takes, and how much data is processed along the way.
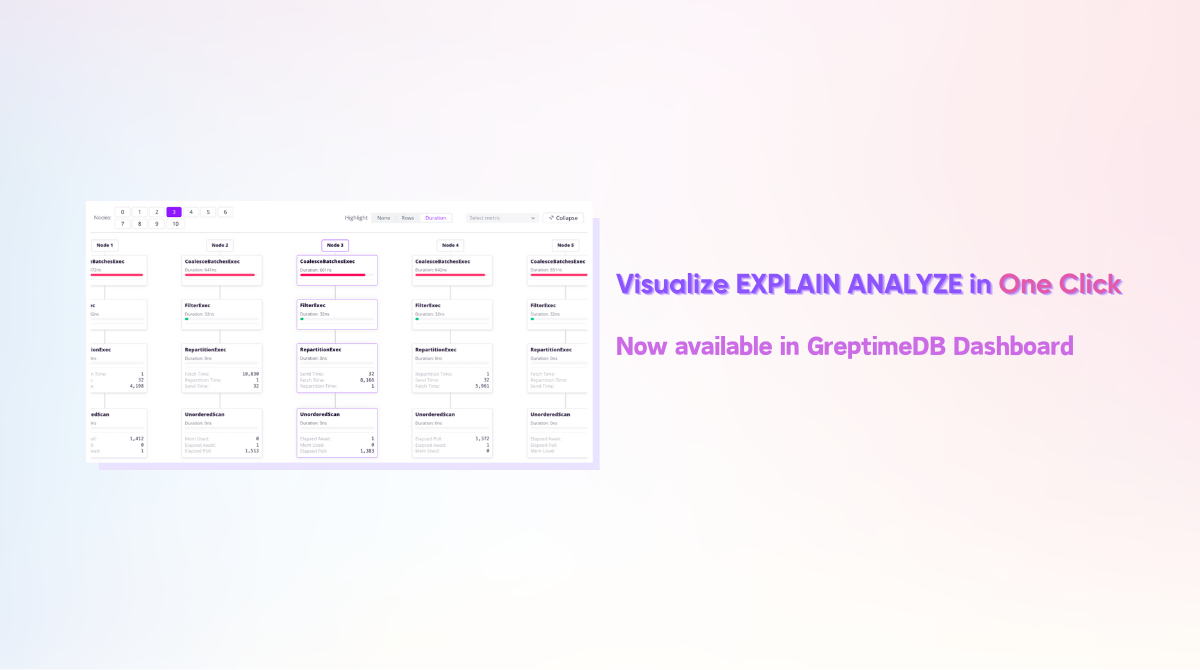
But let's face it—when a plan gets long and nested, even the best of us have to slow down and trace it line by line. To make things easier, we've released a brand-new visual EXPLAIN ANALYZE feature in the GreptimeDB Dashboard, turning those intricate plans into easy-to-read, interactive visualizations.
Why EXPLAIN ANALYZE Matters
When queries start slowing down, EXPLAIN ANALYZE is one of the most direct and powerful ways to investigate what’s going on. It tells you:
- How the database planned the query execution;
- The actual time taken by each step in execution;
- Output row counts, memory usage, I/O stats, and more.
In the PostgreSQL ecosystem, this has led to the creation of many excellent tools around EXPLAIN, including:
These tools inspired our own take on the feature — now available natively inside the GreptimeDB Dashboard.
EXPLAIN ANALYZE in GreptimeDB
Traditionally, GreptimeDB outputs query plans in a PostgreSQL-style indented tree, like this:
sql
SortPreservingMergeExec: [ts@0 DESC] metrics=[]
  WindowedSortExec: expr=ts@0 DESC num_ranges=1 fetch=100 metrics=[output_rows: 8, elapsed_compute: 1]
    PartSortExec: expr=ts@0 DESC num_ranges=1 limit=100 metrics=[output_rows: 16, elapsed_compute: 2530502, row_replacements: 8]
      UnorderedScan: region=4402341478400(1025, 0)... metrics=[output_rows: 8, mem_used: 1152, elapsed_await: 18584876, elapsed_poll: 19227585]
Each line represents a step in the execution plan. The indentation indicates hierarchy, and each node contains:
- An executor type (e.g.
SortPreservingMergeExec); - Configuration parameters;
- Runtime metrics such as execution time, row count, and memory usage.
This text format is compact and efficient—especially for experienced users—but when plans get longer or more complex, it becomes harder to quickly spot bottlenecks or compare stages.
That’s why we added support for EXPLAIN ANALYZE FORMAT JSON, and built a complete visual interface around it in the Dashboard.
One-Click Visualization in the Dashboard
Now, simply write your query in the Dashboard and click 'Explain Query #1'. Once the query finishes executing, you’ll get an instant, intuitive view of the execution plan—no need to manually parse JSON.
We currently offer three different views for analyzing the plan:
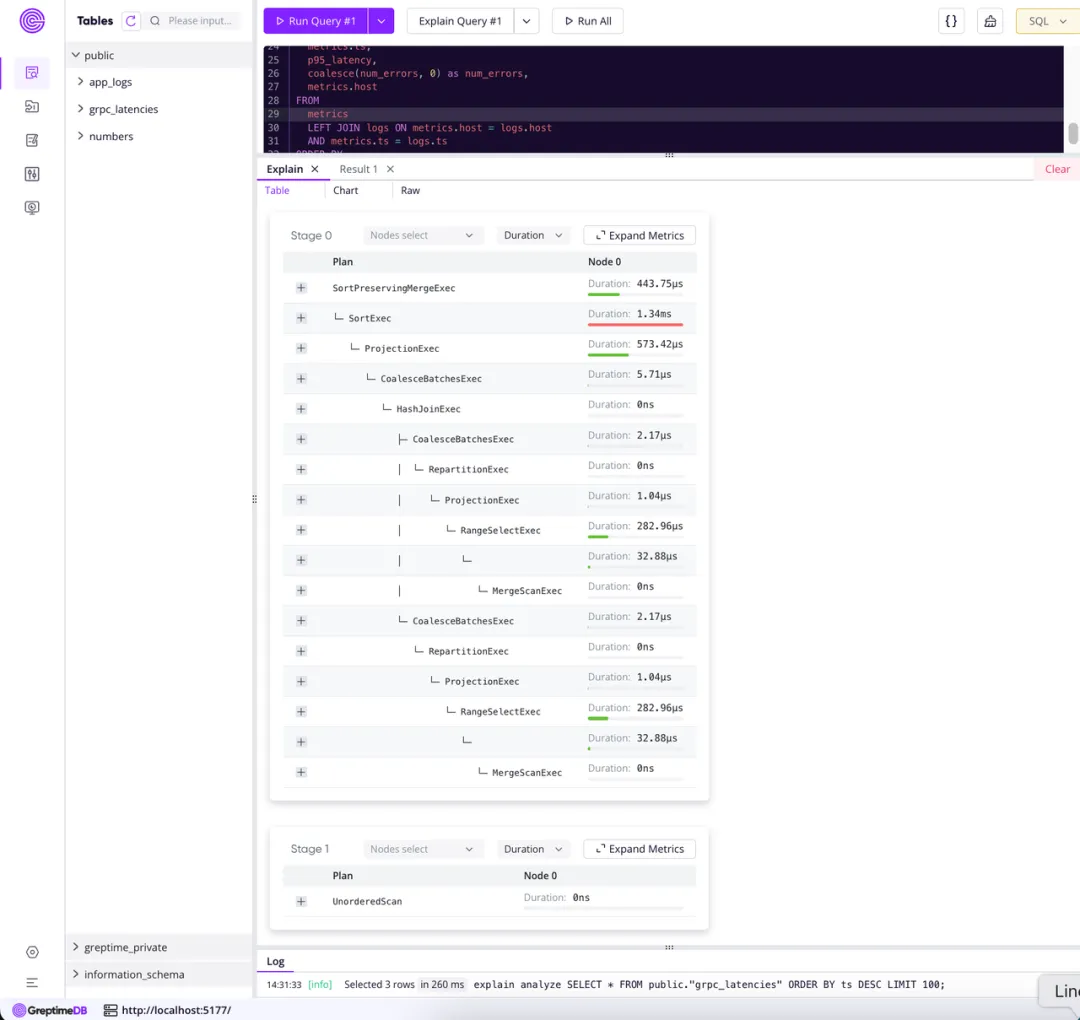
📊 Table View
This view splits the plan into two execution stages, displaying them as expandable trees. Each node shows:
- Elapsed time (
elapsed_compute); - Output row count (
output_rows); - Other engine-specific metrics.
The horizontal colored bars use different colors to visually highlight performance hotspots—making it easy to spot which step is the most expensive. You can also expand each node to see all metrics.
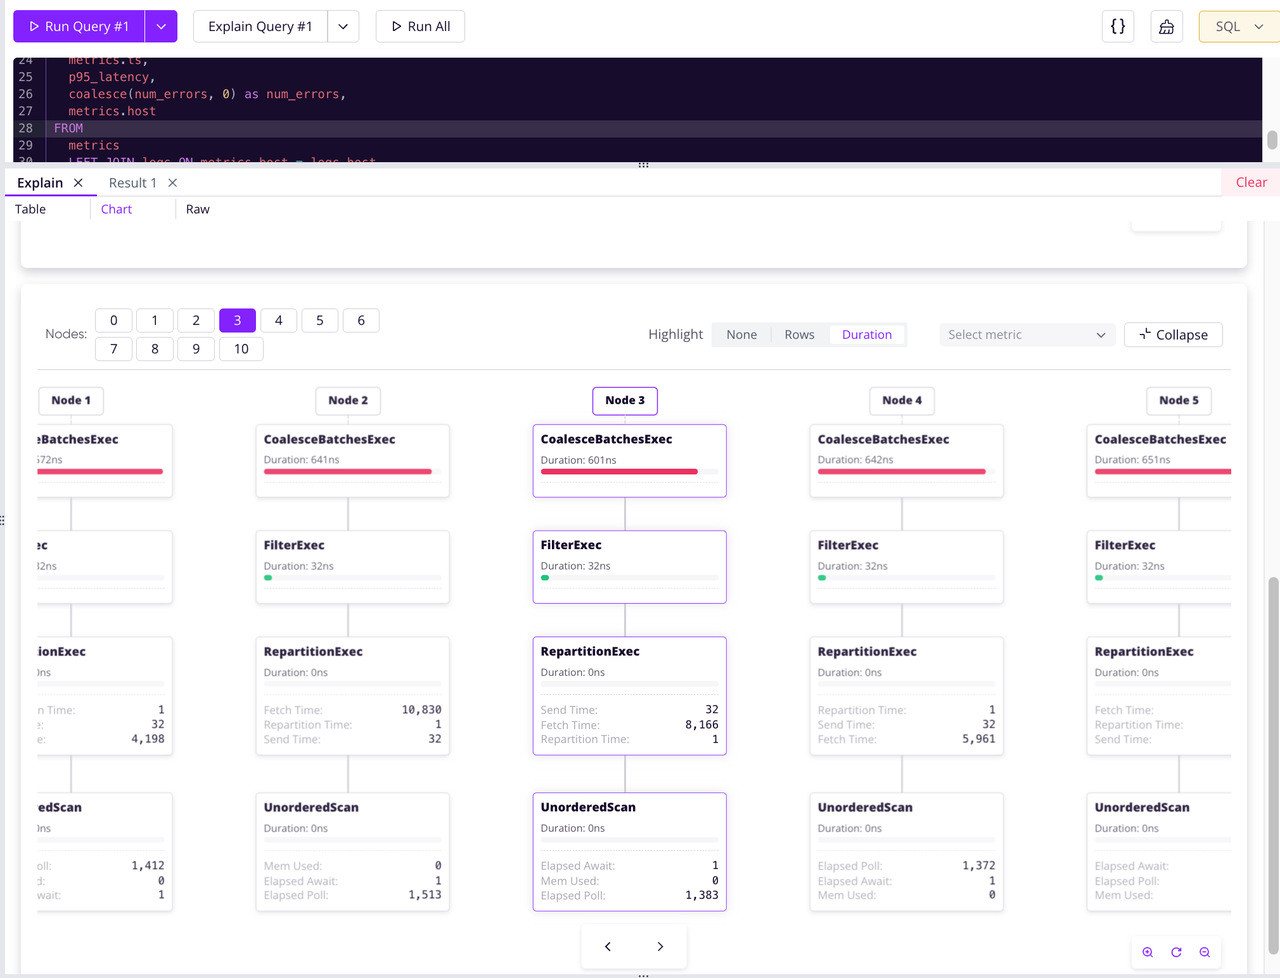
🕸️ Chart View
Prefer a more visual structure? The chart view renders the plan as a tree graph using D3. You can navigate through different nodes to explore how the plan is constructed, and get a clear overview of the structure and hierarchy.
Here’s a sample visualization of a plan with 11 nodes:
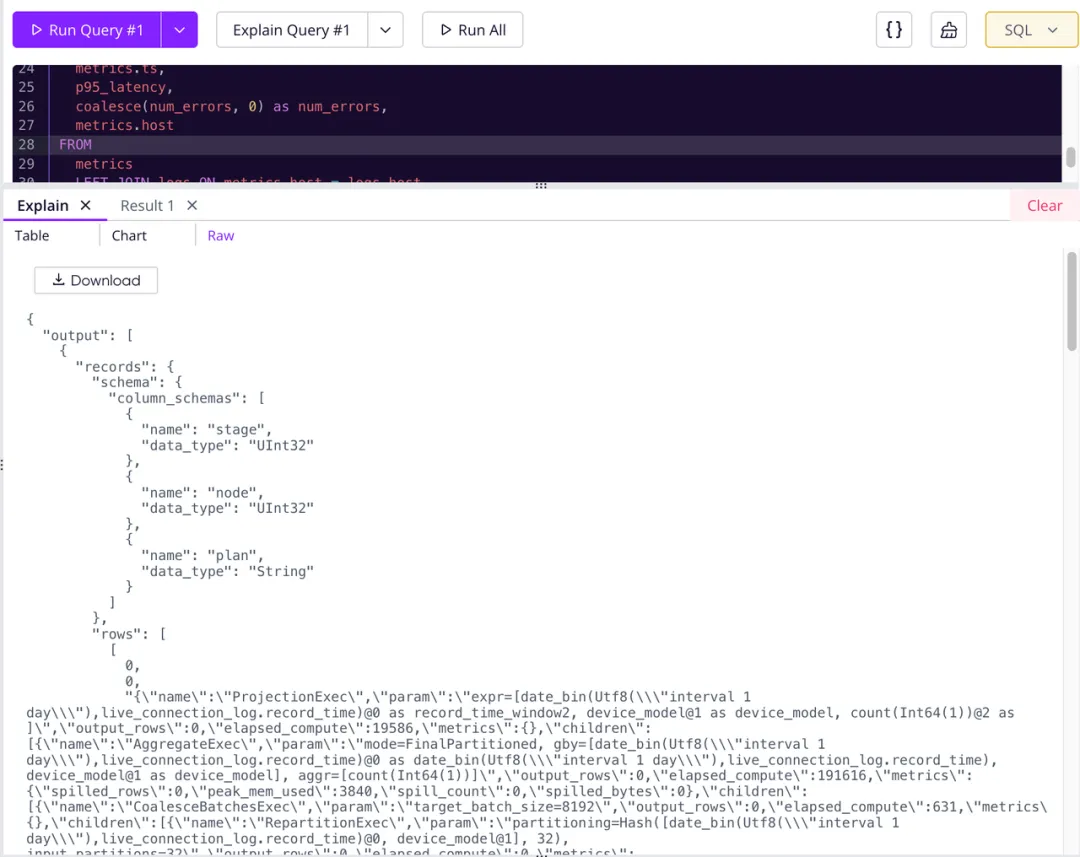
🧾 Raw JSON View
Prefer raw data? The Raw JSON View shows the untouched JSON output from EXPLAIN ANALYZE FORMAT JSON. You can download the file for further offline analysis or share it with others.
🔄 Import and Reuse Existing EXPLAIN Results
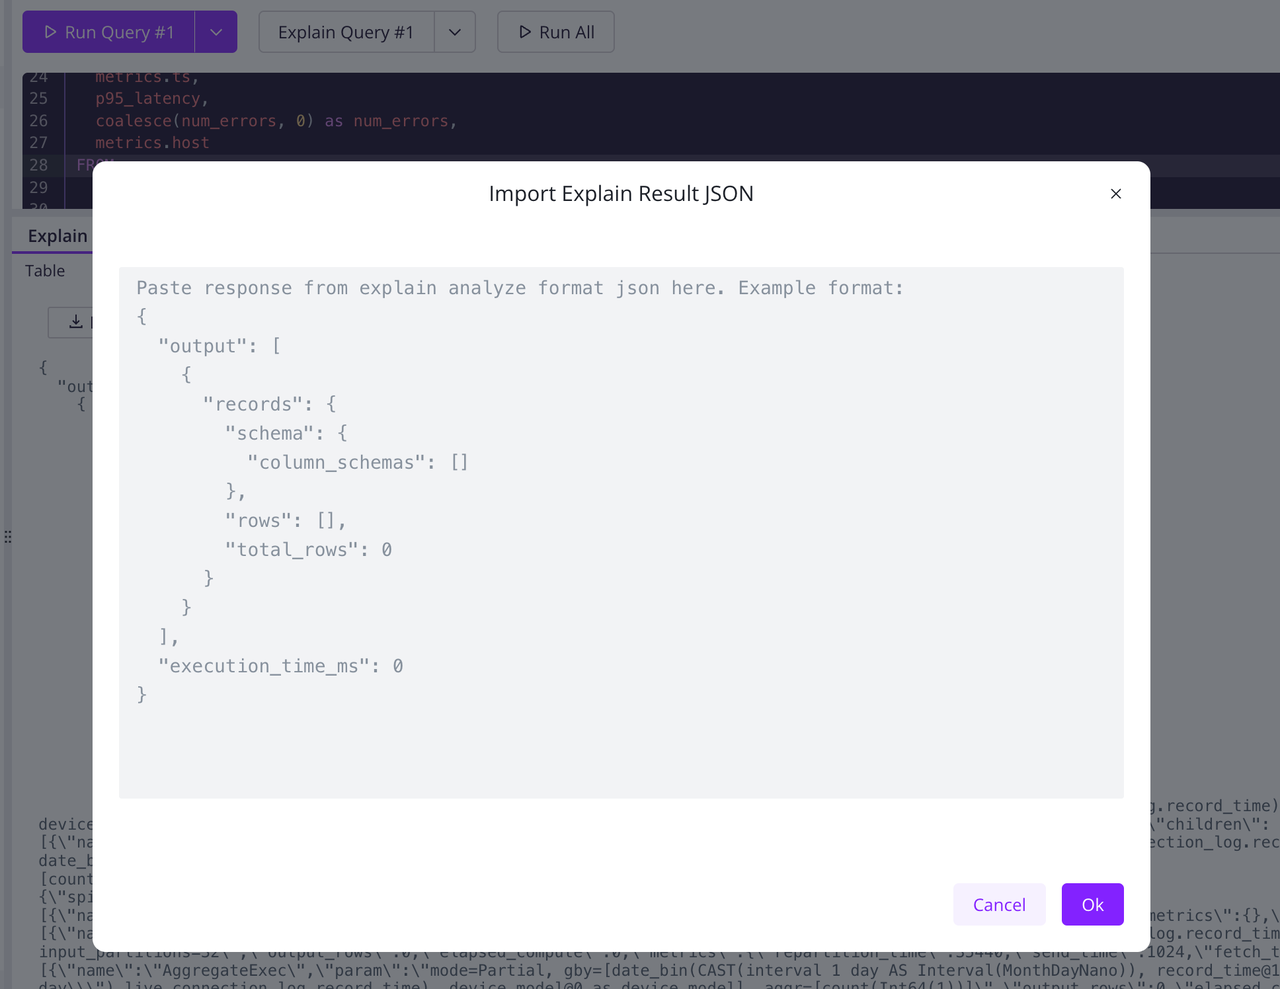
Already have a JSON execution plan from another environment or earlier run?
You can paste it directly into the Dashboard using the 'Import Result JSON' feature. The imported result can be viewed in any of the three modes: Table, Chart, or Raw JSON.
This is especially useful when debugging production queries or collaborating across teams:
In Summary
This feature is built on our EXPLAIN ANALYZE support and takes it to the next level. With visualization tools to explore execution plans, developers can now identify bottlenecks faster, understand query behavior more clearly, and collaborate more effectively.
It's available now in the Dashboard—give it a try!
👉 Related PR: dashboard#506
About Greptime
GreptimeDB is an open-source, cloud-native database purpose-built for real-time observability. Built in Rust and optimized for cloud-native environments, it provides unified storage and processing for metrics, logs, and traces—delivering sub-second insights from edge to cloud —at any scale.
GreptimeDB OSS – The open-sourced database for small to medium-scale observability and IoT use cases, ideal for personal projects or dev/test environments.
GreptimeDB Enterprise – A robust observability database with enhanced security, high availability, and enterprise-grade support.
GreptimeCloud – A fully managed, serverless DBaaS with elastic scaling and zero operational overhead. Built for teams that need speed, flexibility, and ease of use out of the box.
🚀 We’re open to contributors—get started with issues labeled good first issue and connect with our community.


