On this page
ELK Overview
Back in the days when options were limited, Elasticsearch became the preferred solution for log storage and query due to its excellent full-text search capabilities. Later on, elastic.co built the ELK ecosystem around Elasticsearch, providing a complete collection, storage, and analysis ecosystem. The later addition of the beats components further improved the shortcomings in data collection, making data collection more flexible and lightweight. As a result, ELK has become the de facto answer for log collection solutions.
As we enter 2025, various new programming methods and deployment paradigms are being widely adopted. Compared to more modern solutions, Elasticsearch's relatively old technical and architectural design gradually reveals some drawbacks:
1. Soaring Storage Costs: The More Logs, The Higher the Cost
With the increasing complexity of software systems, the volume of logs produced by applications is growing exponentially. To troubleshoot root causes, we often need to retain all logs as long as possible. However, Elasticsearch builds an index upon each line of logs to speed up full-text search, which means HUGE storage overhead.
Our tests found that ingesting 10GB of log data resulted in Elasticsearch generating more than 10GB of storage files. Long-term storage size of log data has made storage costs the primary reason for replacing ELK.
2. Coupled Storage and Computation, Severe Resource Waste
As a system born before cloud computing, Elasticsearch naturally uses local disk storage and has a built-in data replication mechanism. Combined with the large amount of data mentioned above, this means a rising dependence on high-performance SSDs.
What's worse is that storage and computing resources are bound together: if we want to scale out the CPU to handle high concurrency, we scale out the disk as well; and vice versa. The result is that we pay for resources we don't use.
3. Thirst for Resources and Prone to OOM
Running on the JVM, Elasticsearch is thirsty for hardware resources, especially memory. Discussions about "OOM being killed" are common in various forums. In production environments, Elasticsearch generally requires very high-spec machines to run.
Comparing multiple log databases, we found that Elasticsearch's hardware resource consumption is the highest under the same write request pressure (assuming it can handle the volume without crashing).
4. Complex Maintenance, Cloud-Native Un-Friendly
Elasticsearch is also notorious for its high maintenance difficulty. Starting a single node might be easy, but when we face scenarios like upgrades, scaling out, fault recovery, and backups, every step can be daunting. Trying to automate Elasticsearch clusters with Kubernetes is almost impossible.
Although ELK was once popular and is still the choice for many users' log monitoring solutions, the above analysis clearly shows that ELK is gradually falling behind in meeting the needs of high ingestion volumes and long-term storage for real-time log monitoring and data analysis.
We need a more modern, low-cost, and easy-to-operate log monitoring solution.
GreptimeDB as the Log Monitoring Storage Solution
GreptimeDB is a cloud-native database designed for observability data, making it well-suited for metric collection, log storage, and real-time monitoring. Its architecture is optimized for high-frequency time-stamped data ingestion and querying, such as metrics, logs and events.
As a cloud-native database, GreptimeDB employs a storage-compute separation architecture. Native on Kubernetes, it enables seamless elastic scaling, making it ideal for cloud environments. Independent resource scaling ensures cost efficiency and stable performance under high-demand workloads—requiring minimal manual intervention.
Compared to traditional solutions, GreptimeDB's storage-compute separation architecture and cloud-native design make it a highly suitable modern time-series database for log storage. Here are its core advantages in actual use:
1. High Compression Rate, Saving Storage Means Saving Money
GreptimeDB is a columnar database that achieves high data compression using methods such as run-length encoding and dictionary encoding.
Our tests found that under the same log ingestion volume, GreptimeDB's storage file size is about 1/10 of Elasticsearch's—store more, occupy less.
2. Compute-Storage Separation, Further Reducing Storage Costs
GreptimeDB adopts the storage-compute separation architecture from the start, storing data in object storage, which is both cost-effective and reliable:
- In cloud services like AWS, the price of object storage is usually less than half of block storage.
- Storage reliability is guaranteed by the underlying object storage, preventing the complexity of the database itself for implementing data replication and backup.
- No capacity limit, and no coupled resources. No need to scale up the disk when scaling up the CPU, avoiding resource waste.
3. Lightweight, Less Hardware Requirements
Written in Rust, GreptimeDB consumes fewer system resources and runs stably, even on low-end hardware.
In our tests, under the same ingestion volume, Elasticsearch's CPU and memory usage are several times that of GreptimeDB. For log systems, this means fewer OOMs and better stability.
4. Cloud-Native Operations
Thanks to its cloud-native architecture, GreptimeDB's deployment and maintenance experience on Kubernetes is very smooth and simple. Once deployed, it automates maintenance operations such as rolling updates, shutdowns, restarts, resource changes, and load balancing, ensuring stable operation with minimal to no technician intervention. For ops teams, this provides genuine convenience and ease of use.
5. Multiple Indexing Mechanisms for Accelerating Query
GreptimeDB provides various index types to adapt to different query needs:
- For low cardinality data (such as
k8s_pod_ip), an inverted index can be used to speed up filtering operations. - For high cardinality text (such as
trace_id), a skipping index can be set to improve the efficiency of precise queries. - For fuzzy text searches, a full-text index can be set to support flexible search.
By flexibly combining indexes, query speed is significantly improved while reducing the overhead of building and storing indexes. More detailed index introductions can be found in this document.
Using Vector + GreptimeDB as a Log Monitoring Solution
Next, we will demonstrate how to quickly build a log collection and storage solution using Vector and GreptimeDB.
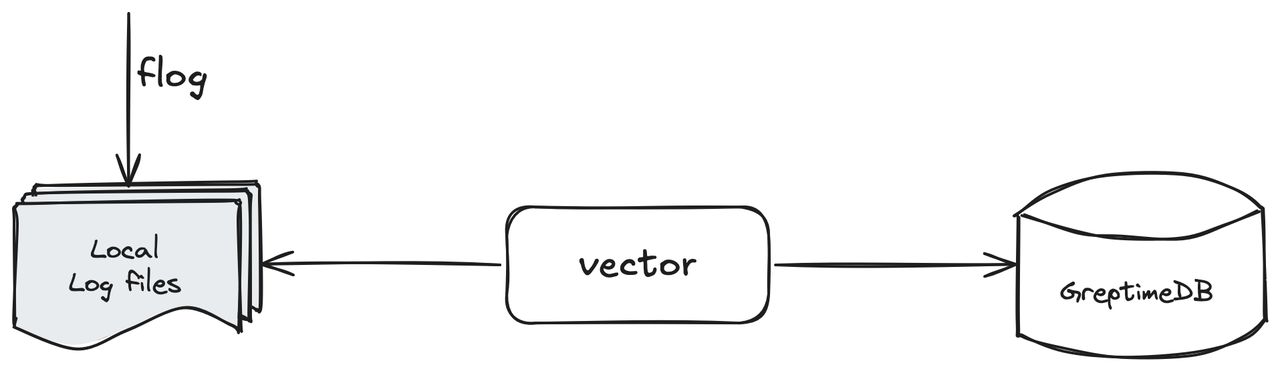
In this simple solution introduction, we use:
- Use Flog to mock local log files;
- Use Vector to collect local log files and ingest them into the GreptimeDB instance;
- Use GreptimeDB's built-in logview or other tools to view the ingested log rows.
Mock Log Files
We use flog to mock generating a continuously outputting log file. The following command can quickly generate a log file log.txt that writes one line of logs per second:
In production environments, applications will use the logging library to print logs to log files. Log files may have time suffixes and may be automatically split and rotated according to rules. For some popular middlewares, Vector also integrates log collection components, such as kubernetes logs:
Execute head -1 log.txt to view a sample of the log data:
shell
17.61.197.240 - nikolaus3107 [14/Apr/2025:21:11:44 +0800] "HEAD /envisioneer/efficient HTTP/1.0" 406 5946Deploy GreptimeDB Instance
We need to deploy a GreptimeDB instance. Although this article uses a standalone instance as an example, the data ingestion API is the same for both standalone and cluster instances. In production environments, cluster deployment is preferred, which can be referred to in this document.
Installing GreptimeDB is relatively simple, and different installation methods can be referred to in this document. To facilitate reproduction in various environments, we use Docker to start the GreptimeDB database:
shell
docker run -p 127.0.0.1:4000-4003:4000-4003 \
  --name greptime --rm \
  greptime/greptimedb:v0.14.0-nightly-20250407 standalone start \
  --http-addr 0.0.0.0:4000 \
  --rpc-bind-addr 0.0.0.0:4001 \
  --mysql-addr 0.0.0.0:4002 \
  --postgres-addr 0.0.0.0:4003
Then verify that the database has been successfully started by executing curl 127.0.0.1:4000/health; we can also use the MySQL-compatible client to connect to the database for confirmation by executing mysql -h127.0.0.1 -P4002.
Collect Logs Using Vector
We need to install Vector first, which can be referred to in this official document. It is recommended to use the system's package manager to install for convenience. After installation, we can verify the installation by running vector --version. In this article, we will collect log data by starting Vector locally. For Vector deployment in production environments, we can refer to this blog.
Vector Configuration Introduction
Next, we need to write the Vector configuration required for collecting logs. The example is as follows:
toml
# config.toml
[sources.file_input]
type = "file"
include = [ "<path_to_log_dir>/log.txt" ]
data_dir = "<data_dir>"

[sinks.greptime_sink]
type = "greptimedb_logs"
inputs = [ "file_input" ]
compression = "gzip"
dbname = "public"
endpoint = "http://127.0.0.1:4000"
pipeline_name = "greptime_identity"
table = "app_log"
Let's take a closer look at this configuration:
toml
[sources.file_input]
type = "file"
include = [ "<path_to_log_dir>/log.txt" ]
data_dir = "<data_dir>"
ignore_checkpoints = true
This is Vector's file source. Source is Vector's data input, which can collect data from various adapted sources. We specify using File Source through type = "file", and the include option is used to configure the file location (include can use wildcards to configure multiple log files, see the document). Finally, we need to configure data_dir to specify a metadata directory. Vector's default path for data_dir is /var/lib/vector/:
toml
[sinks.greptime_sink]
type = "greptimedb_logs"
inputs = [ "file_input" ]
compression = "gzip"
dbname = "public"
endpoint = "http://127.0.0.1:4000"
pipeline_name = "greptime_identity"
table = "app_log"
This is the GreptimeDB logs sink. Sink is Vector's data output, sending data to the adapted output end. We specify using GreptimeDB log output through type = "greptimedb_logs", and the inputs specify using the above file source. The configuration here merely specifies the connection parameters of GreptimeDB:
compressionspecifies the compression option for sending data;dbnamespecifies the database to ingest to; here we ingest to the defaultpublicdatabase;endpointspecifies the HTTP address of the GreptimeDB instance. In the above, we started the GreptimeDB instance usingdockerand bound the database's 4000 port to the127.0.0.1;pipeline_namespecifies the pipeline for log ingestion. Pipeline is a built-in mechanism of GreptimeDB for preprocessing text data. Here we usegreptime_identity, which does not process the raw data and directly stores the input JSON data in separate columns in the database;tablespecifies which database table to ingest the data to. If this table does not exist, it will be automatically created.
Ingest Logs to GreptimeDB
After configuration, we can ingest the log data from the file to GreptimeDB. Run the following command to start Vector using the configuration:
shell
vector -c <path_to_config_file>If we see the following log and do not see any ERROR, we can confirm that Vector has started ingesting data to GreptimeDB:
shell
2025-04-15T06:53:17.864603Z INFO vector::topology::builder: Healthcheck passed.Query Data in GreptimeDB
Next, we can verify the data has been ingested by querying GreptimeDB. Use the MySQL-compatible client to connect to the database by running mysql -h127.0.0.1 -P4002.
First, execute show tables to check whether the table was successfully created:
shell
+---------+
| Tables  |
+---------+
| app_log |
| numbers |
+---------+
2 rows in set (0.018 sec)
Then execute select * from app_log limit 2; to observe the data:
shell
+----------------------------+------------------------+-----------+------------------------------------------------------------------------------------------------------------------+-------------+--------------------------------+
| greptime_timestamp         | file                   | host      | message                                                                                                          | source_type | timestamp                      |
+----------------------------+------------------------+-----------+------------------------------------------------------------------------------------------------------------------+-------------+--------------------------------+
| 2025-04-15 07:02:37.136667 | <path_to_file>/log.txt | some_host | 17.61.197.240 - nikolaus3107 [14/Apr/2025:21:11:44 +0800] "HEAD /envisioneer/efficient HTTP/1.0" 406 5946        | file        | 2025-04-15T07:02:36.116847265Z |
| 2025-04-15 07:02:37.136674 | <path_to_file>/log.txt | some_host | 56.87.252.7 - - [14/Apr/2025:21:11:45 +0800] "PATCH /bricks-and-clicks/transition/interfaces HTTP/1.1" 416 15579 | file        | 2025-04-15T07:02:36.116864203Z |
+----------------------------+------------------------+-----------+------------------------------------------------------------------------------------------------------------------+-------------+--------------------------------+
2 rows in set (0.032 sec)
we can see that in addition to the message column storing the mocked logs, there are several additional columns:
greptime_timestamp: Since we usedgreptime_identityand did not specify a time index column (we can manually specify the index column ingreptime_identitymode, see the document), GreptimeDB uses the timestamp the log reaches the server and sets it as the time index column. Usually, we prefer the time index to be set to the actual log generation time to more accurately restore the event sequence;file,host,source_type,timestamp: Careful readers may have noticed that these are runtime context information automatically attached by Vector. If not manually deleted, Vector includes this context information by default when outputting.
View Data Through log-query
GreptimeDB comes with a dashboard console that allows we to quickly execute data queries and operations. Enter http://127.0.0.1:4000/dashboard/#/dashboard/log-query in the browser to quickly open the log-query page:
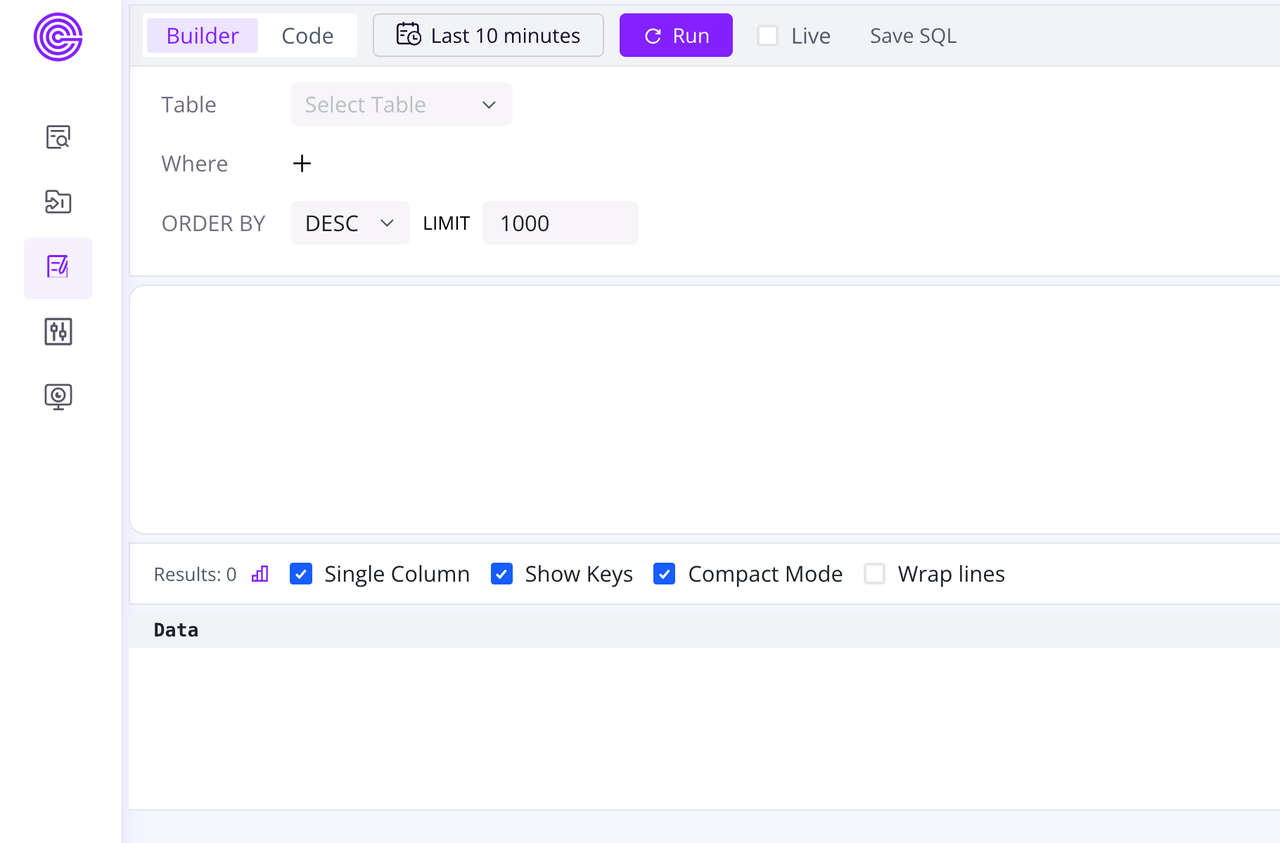
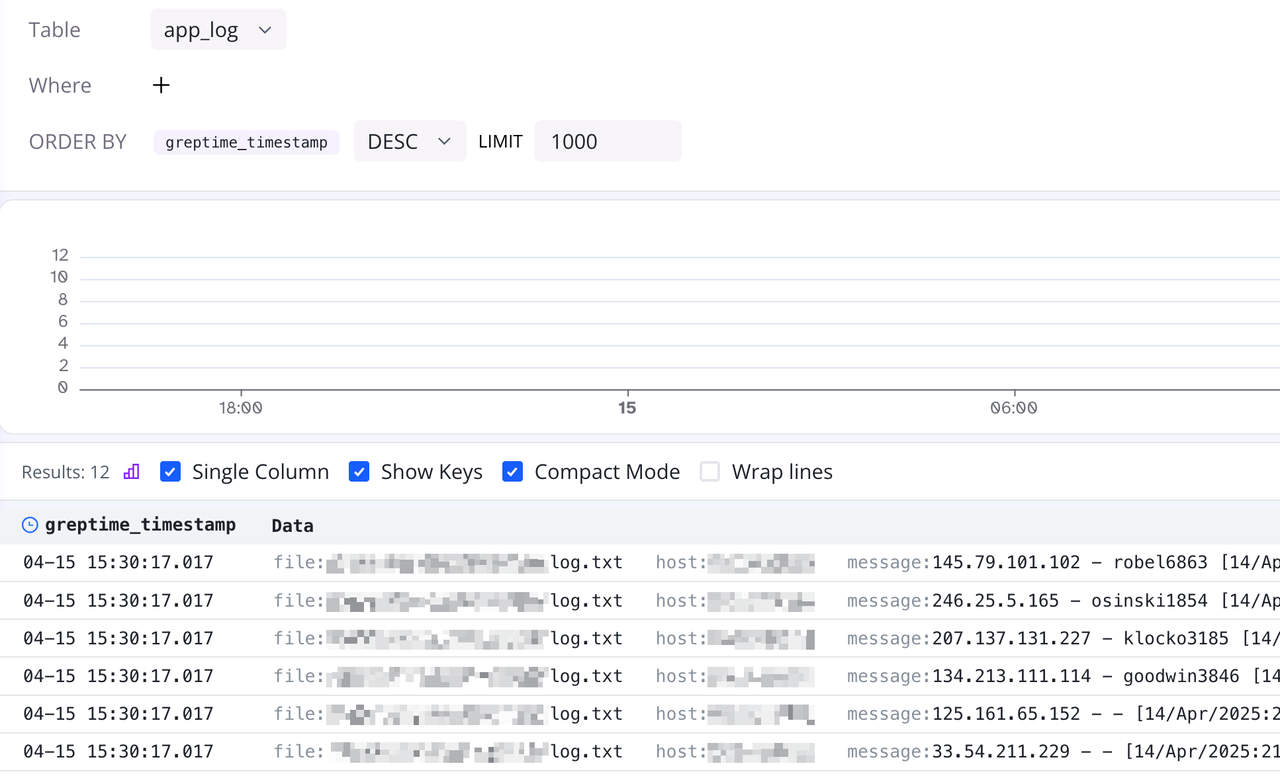
Click the Table dropdown menu, and we can see the app_log table just created. Click to select the app_log table, then click the run button above to view the log data just ingested in log-query:
Parse Logs Using Pipeline
In the previous section, we successfully ran Vector to collect log data from the file and ingest it into GreptimeDB. However, we ingested the entire log row as a single column in the database. In this way, if we need to filter a certain type of log, we can only rely on LIKE fuzzy queries, which is not only inefficient but also not conducive to subsequent analysis.
In production environments, logs are generally preprocessed through ETL steps, breaking down the text into structured fields before entering the database. The above-mentioned GreptimeDB built-in Pipeline mechanism is here to help.
Next, we will demonstrate how to parse log text through the Pipeline to improve log usage efficiency.
Pipeline Configuration
First, before using Pipeline, we need to write the configuration and save it to the database for GreptimeDB to invoke at runtime. Pipeline is written based on the input text data. Taking the input mock log text as an example, the following Pipeline configuration is written:
yaml
# pipeline.yaml
processors:
  - dissect:
      fields:
        - message
      patterns:
        - '%{client_ip} - %{user_identifier} [%{timestamp}] "%{http_method} %{request_uri} %{http_version}" %{status_code} %{response_size}'
      ignore_missing: true

  - date:
      fields:
        - timestamp
      formats:
        - '%d/%b/%Y:%H:%M:%S %z'
      timezone: 'Asia/Shanghai'
      ignore_missing: true

transform:
  - fields:
      - client_ip
      - user_identifier
    type: string
    index: skipping

  - fields:
      - http_method
      - http_version
    type: string
    index: inverted

  - fields:
      - request_uri
    type: string
    index: fulltext

  - fields:
      - status_code
    type: int32
  - fields:
      - response_size
    type: int64

  - fields:
      - timestamp
    type: time
    index: timestamp
Pipeline mainly consists of processors and transform. The former processes the data, and the latter converts the processed fields into data types recognized by the database. Below we introduce each part of the Pipeline configuration:
yaml
processors:
  - dissect:
      fields:
        - message
      patterns:
        - '%{client_ip} - %{user_identifier} [%{timestamp}] "%{http_method} %{request_uri} %{http_version}" %{status_code} %{response_size}'
      ignore_missing: true
  - date:
      fields:
        - timestamp
      formats:
        - '%d/%b/%Y:%H:%M:%S %z'
      timezone: 'Asia/Shanghai'
      ignore_missing: true
First, use the dissect processor to extract fields from the long text. Fields such as client_ip and user_identifier can be extracted based on spaces. Then use the date processor to convert the time text into timestamp data type, using a parsing format and timezone:
yaml
transform:
  - fields:
      - client_ip
      - user_identifier
    type: string
    index: skipping

  - fields:
      - http_method
      - http_version
    type: string
    index: inverted

  - fields:
      - request_uri
    type: string
    index: fulltext

  - fields:
      - status_code
    type: int32
  - fields:
      - response_size
    type: int64

  - fields:
      - timestamp
    type: time
    index: timestamp
Next, use transform to save the parsed fields to the database.
- The syntax of
transformis straightforward, just combining the corresponding fields and types;- Note that we add indexes to each field through
index:;- Similarly, specify
index: timestampon thetimestampfield, meaning this field is set as the time index column.
We use the following command to upload the Pipeline configuration to the database, name it app_log, and save it:
shell
curl -s -XPOST 'http://127.0.0.1:4000/v1/events/pipelines/app_log' -F '[email protected]'After successful execution, the following HTTP response will be returned:
json
{
  "pipelines": [
    {
      "name": "app_log",
      "version": "2025-04-15 07:53:51.914557113"
    }
  ],
  "execution_time_ms": 8
}
We can also confirm by executing select name from greptime_private.pipelines; in the MySQL-compatible client:
More detailed Pipeline configuration options can be found in the official document.
Note:
- GreptimeDB dashboard also provides a Pipeline online debugging tool, and we can use this page to test and debug.
- We can also try to leverage AI with Pipeline configuration 😛 (the above Pipeline configuration was generated by AI)
Update Vector Write Configuration
To use our custom Pipeline configuration, we need to slightly modify the Vector configuration:
toml
# config.toml
[sources.file_input]
type = "file"
include = [ "<path_to_log_dir>/log.txt" ]
data_dir = "<data_dir>"
ignore_checkpoints = true

[sinks.greptime_sink]
type = "greptimedb_logs"
inputs = [ "file_input" ]
compression = "gzip"
dbname = "public"
endpoint = "http://127.0.0.1:4000"
pipeline_name = "app_log"
table = "app_log_2"- Add
ignore_checkpoints = truein the File Source to allow Vector to re-read the same file each time it runs (this is just for debugging examples); - Modify
pipeline_name = "app_log"to use the Pipeline configuration we just uploaded; - Modify
table = "app_log_2"to save the new log data to another table, avoiding conflicts with the previousapp_log table.
Then run vector -c <path_to_config_file> to rewrite the log data.
Query Data in GreptimeDB
Run show tables in the MySQL-compatible client to see that the app_log_2 table has been successfully created:
toml
+-----------+
| Tables    |
+-----------+
| app_log   |
| app_log_2 |
| numbers   |
+-----------+
3 rows in set (0.008 sec)
We can run show index from app_log_2 to observe the fields and indexes:
sql
+-----------+------------+----------------+--------------+-----------------+-----------+-------------+----------+--------+------+----------------------------+---------+---------------+---------+------------+
| Table     | Non_unique | Key_name       | Seq_in_index | Column_name     | Collation | Cardinality | Sub_part | Packed | Null | Index_type                 | Comment | Index_comment | Visible | Expression |
+-----------+------------+----------------+--------------+-----------------+-----------+-------------+----------+--------+------+----------------------------+---------+---------------+---------+------------+
| app_log_2 |          1 | SKIPPING INDEX |            1 | client_ip       | A         |        NULL |     NULL |   NULL | YES  | greptime-bloom-filter-v1   |         |               | YES     |       NULL |
| app_log_2 |          1 | INVERTED INDEX |            3 | http_method     | A         |        NULL |     NULL |   NULL | YES  | greptime-inverted-index-v1 |         |               | YES     |       NULL |
| app_log_2 |          1 | INVERTED INDEX |            4 | http_version    | A         |        NULL |     NULL |   NULL | YES  | greptime-inverted-index-v1 |         |               | YES     |       NULL |
| app_log_2 |          1 | FULLTEXT INDEX |            5 | request_uri     | A         |        NULL |     NULL |   NULL | YES  | greptime-fulltext-index-v1 |         |               | YES     |       NULL |
| app_log_2 |          1 | TIME INDEX     |            1 | timestamp       | A         |        NULL |     NULL |   NULL | NO   |                            |         |               | YES     |       NULL |
| app_log_2 |          1 | SKIPPING INDEX |            2 | user_identifier | A         |        NULL |     NULL |   NULL | YES  | greptime-bloom-filter-v1   |         |               | YES     |       NULL |
+-----------+------------+----------------+--------------+-----------------+-----------+-------------+----------+--------+------+----------------------------+---------+---------------+---------+------------+
6 rows in set (0.05 sec)
We can see that the indexes for each field have also been correctly created.
Then use select * from app_log_2 limit 2 to see the following results:
toml
+---------------+-----------------+-------------+------------------------------------------+--------------+-------------+---------------+---------------------+
| client_ip     | user_identifier | http_method | request_uri                              | http_version | status_code | response_size | timestamp           |
+---------------+-----------------+-------------+------------------------------------------+--------------+-------------+---------------+---------------------+
| 17.61.197.240 | nikolaus3107    | HEAD        | /envisioneer/efficient                   | HTTP/1.0     |         406 |          5946 | 2025-04-14 13:11:44 |
| 56.87.252.7   | -               | PATCH       | /bricks-and-clicks/transition/interfaces | HTTP/1.1     |         416 |         15579 | 2025-04-14 13:11:45 |
+---------------+-----------------+-------------+------------------------------------------+--------------+-------------+---------------+---------------------+
2 rows in set (0.008 sec)
As shown here, compared to the original log line being a single column, the logs are now split into different fields, saved as separate columns with semantic data types. Now we can perform more precise searching queries on logs through conditions like where client_id = '17.61.197.240', which not only improves query accuracy but also query efficiency.
View Data Through log-query
Similarly, we can view the data in the app_log_2 table at http://127.0.0.1:4000/dashboard/#/dashboard/log-query, as shown below:
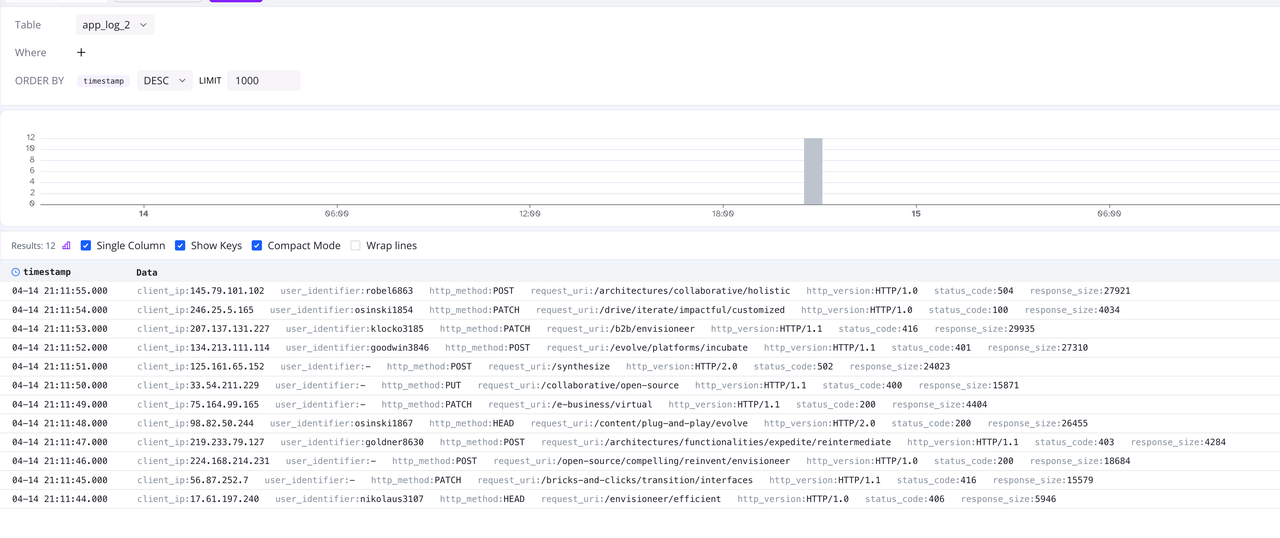
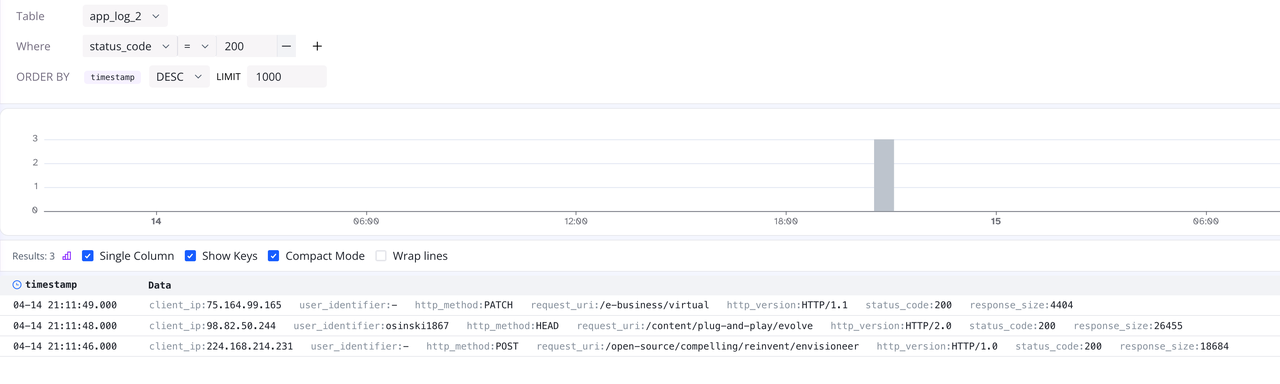
Now that the fields are split, we can quickly filter data through the Where condition in log-query, for example:
Summary
This article explores log storage solutions, explaining the drawbacks of the ELK stack in current situations, and introducing GreptimeDB as a next-gen log storage solution with its advantages in architecture and user experience. Through the combination of Vector + GreptimeDB, we demonstrated the complete process from log collection to storage, parsing, and querying.
In the query section, we demonstrated data retrieval using the MySQL-compatible client and GreptimeDB's built-in log-query tool. As an open-source, highly compatible time-series database, GreptimeDB also supports seamless integration with visualization tools like Grafana, enabling users to easily visualize and analyze their data.
If you are interested in log processing and storage, feel free to modify the configuration provided in this article to explore more flexible and efficient log storage solutions.
About Greptime
GreptimeDB is an open-source, cloud-native database purpose-built for real-time observability. Built in Rust and optimized for cloud-native environments, it provides unified storage and processing for metrics, logs, and traces—delivering sub-second insights from edge to cloud —at any scale.
GreptimeDB OSS – The open-sourced database for small to medium-scale observability and IoT use cases, ideal for personal projects or dev/test environments.
GreptimeDB Enterprise – A robust observability database with enhanced security, high availability, and enterprise-grade support.
GreptimeCloud – A fully managed, serverless DBaaS with elastic scaling and zero operational overhead. Built for teams that need speed, flexibility, and ease of use out of the box.
🚀 We’re open to contributors—get started with issues labeled good first issue and connect with our community.


