On this page
Introduction
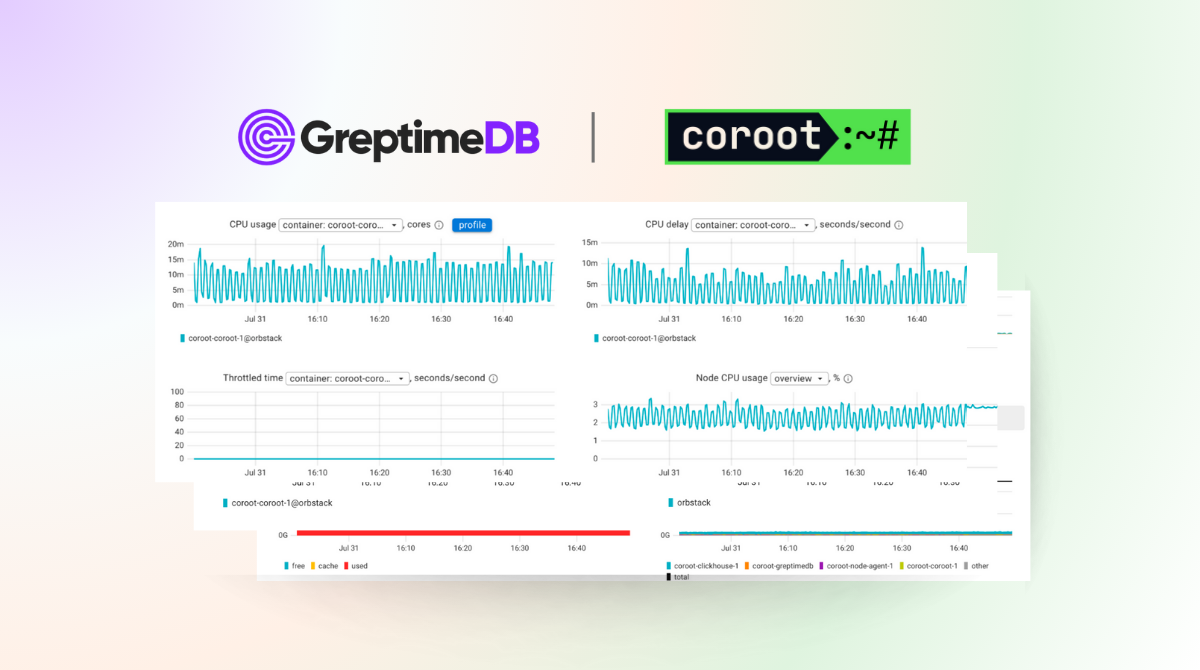
GreptimeDB is an open-source observability database specifically engineered for wide events and Observability 2.0 practices. It is designed to use one database to natively accept incoming data across metrics, logs, and traces, while providing multiple query interfaces to achieve real-time insights from the edge to the cloud.
During our development journey to deliver a developer-friendly, feature-rich experience, we discovered Coroot—an open-source APM & Observability tool with predefined dashboards and inspections. GreptimeDB can be used as a Prometheus-compatible data lake in Coroot, enabling organizations to store and analyze large volumes of telemetry data efficiently, helping developers create advanced application performance monitoring and root cause analysis.
Why Choose Coroot as Data Monitoring Dashboard
Coroot is an open-source APM observability platform that automatically collects metrics, logs, traces, and profiling data with eBPF — no code changes or manual setup. It maps every service and dependency to give you a complete picture of your system, with no blind spots. Its AI-driven data analysis identifies the most likely causes of incidents in seconds and providing the full evidence behind each hypothesis so you can verify the findings with confidence.
By integrating GreptimeDB as Coroot's Prometheus-compatible data source, developers need only configure the Prometheus URL to gain immediate access to comprehensive visualization capabilities for monitoring their applications and infrastructure, making the process both efficient and straightforward.
Why Choose GreptimeDB for Prometheus Data Lake
Seamless Integration and High-Throughput Real-Time Data Ingestion
GreptimeDB supports Prometheus remote write and HTTP API with PromQL query capabilities, allowing developers to easily integrate it into their existing observability stack or migrate from existing Prometheus deployments. This compatibility ensures a smooth transition without requiring significant changes to existing workflows or tooling.
With support for concurrent writing of billions of index points per second, GreptimeDB can handle high-throughput data ingestion with exceptional performance.
Flexible Data Analysis with Low Storage Cost and High Performance
GreptimeDB employs a columnar data model to store Prometheus metrics, which extends database capabilities to process time-series data and enables advanced analytical features. This architecture allows developers to perform complex queries and analyses on their telemetry data, leveraging both SQL and PromQL query languages.
- Real-time computation: Materialized views and transformation engines streamline complex data workflows, accelerating insights and enhancing developer productivity.
- Flexible alerting rules: Like Prometheus alert rules, GreptimeDB's rule engine and trigger mechanisms enable proactive alerting and automated responses.
- Low-cost storage: GreptimeDB's scalable object storage ensures reliable, cost-effective data persistence.
- Storage and computing isolation: Real-time query APIs and read replicas ensure efficient data access while isolating analytical workloads from operational systems.
Unified Observability Through Combined Metrics, Logs, and Traces
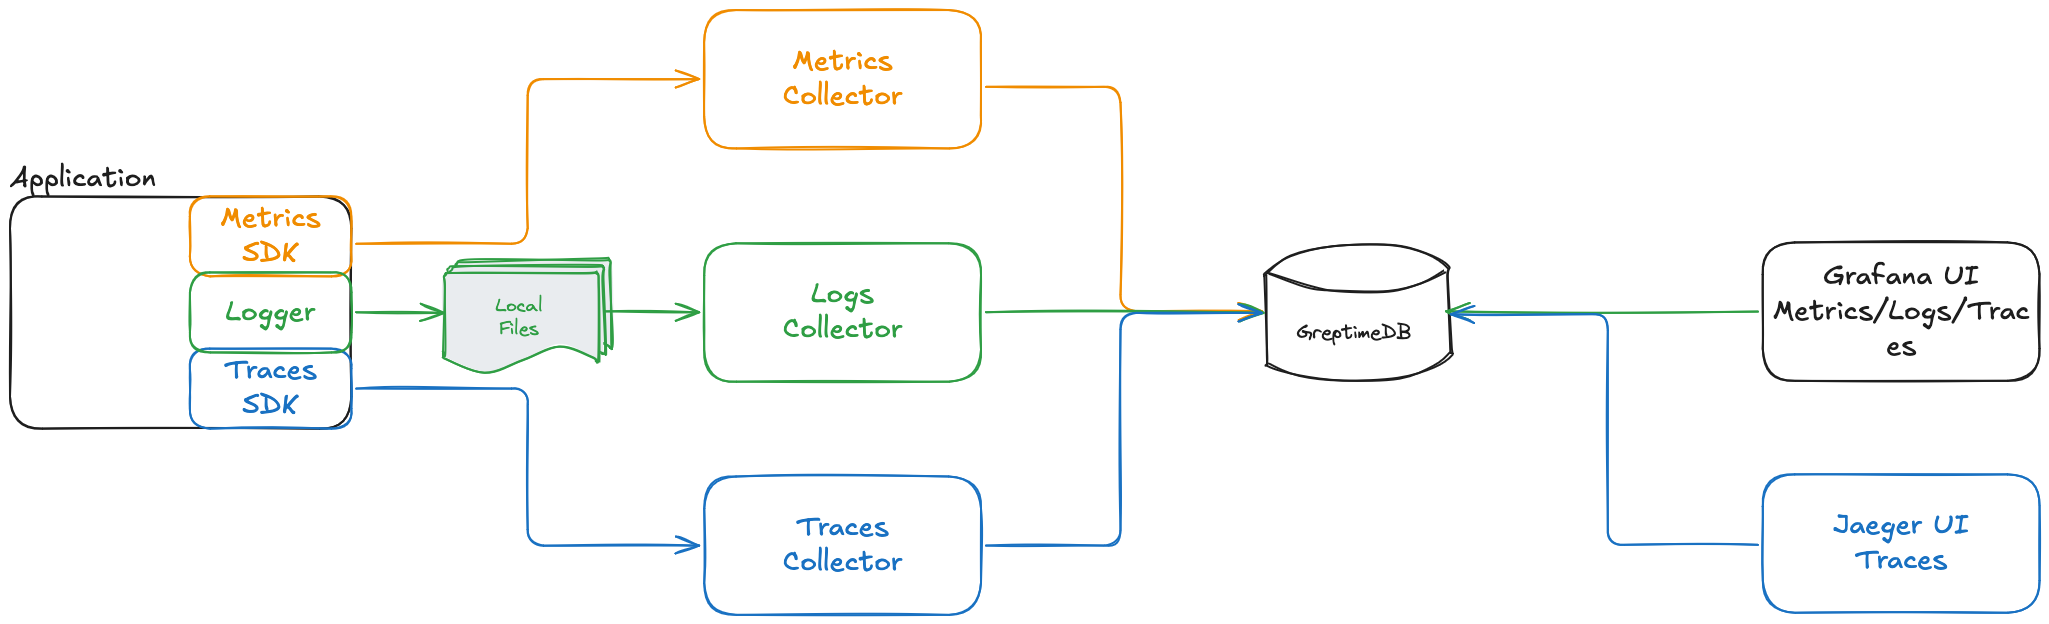
Beyond Prometheus metrics, GreptimeDB can store logs and traces, enabling a comprehensive unified observability solution. This integration allows developers to correlate metrics, logs, and traces seamlessly, providing a holistic view of application performance and system health across the entire technology stack.
Integration Guide: GreptimeDB and Coroot
To integrate GreptimeDB with Coroot:
- In the Coroot Dashboard, navigate to
Settingsand select thePrometheusconfiguration. - If your GreptimeDB instance is running on
localhostwith port4000(HTTP service), authentication enabled, and using the defaultpublicdatabase, configure as follows:
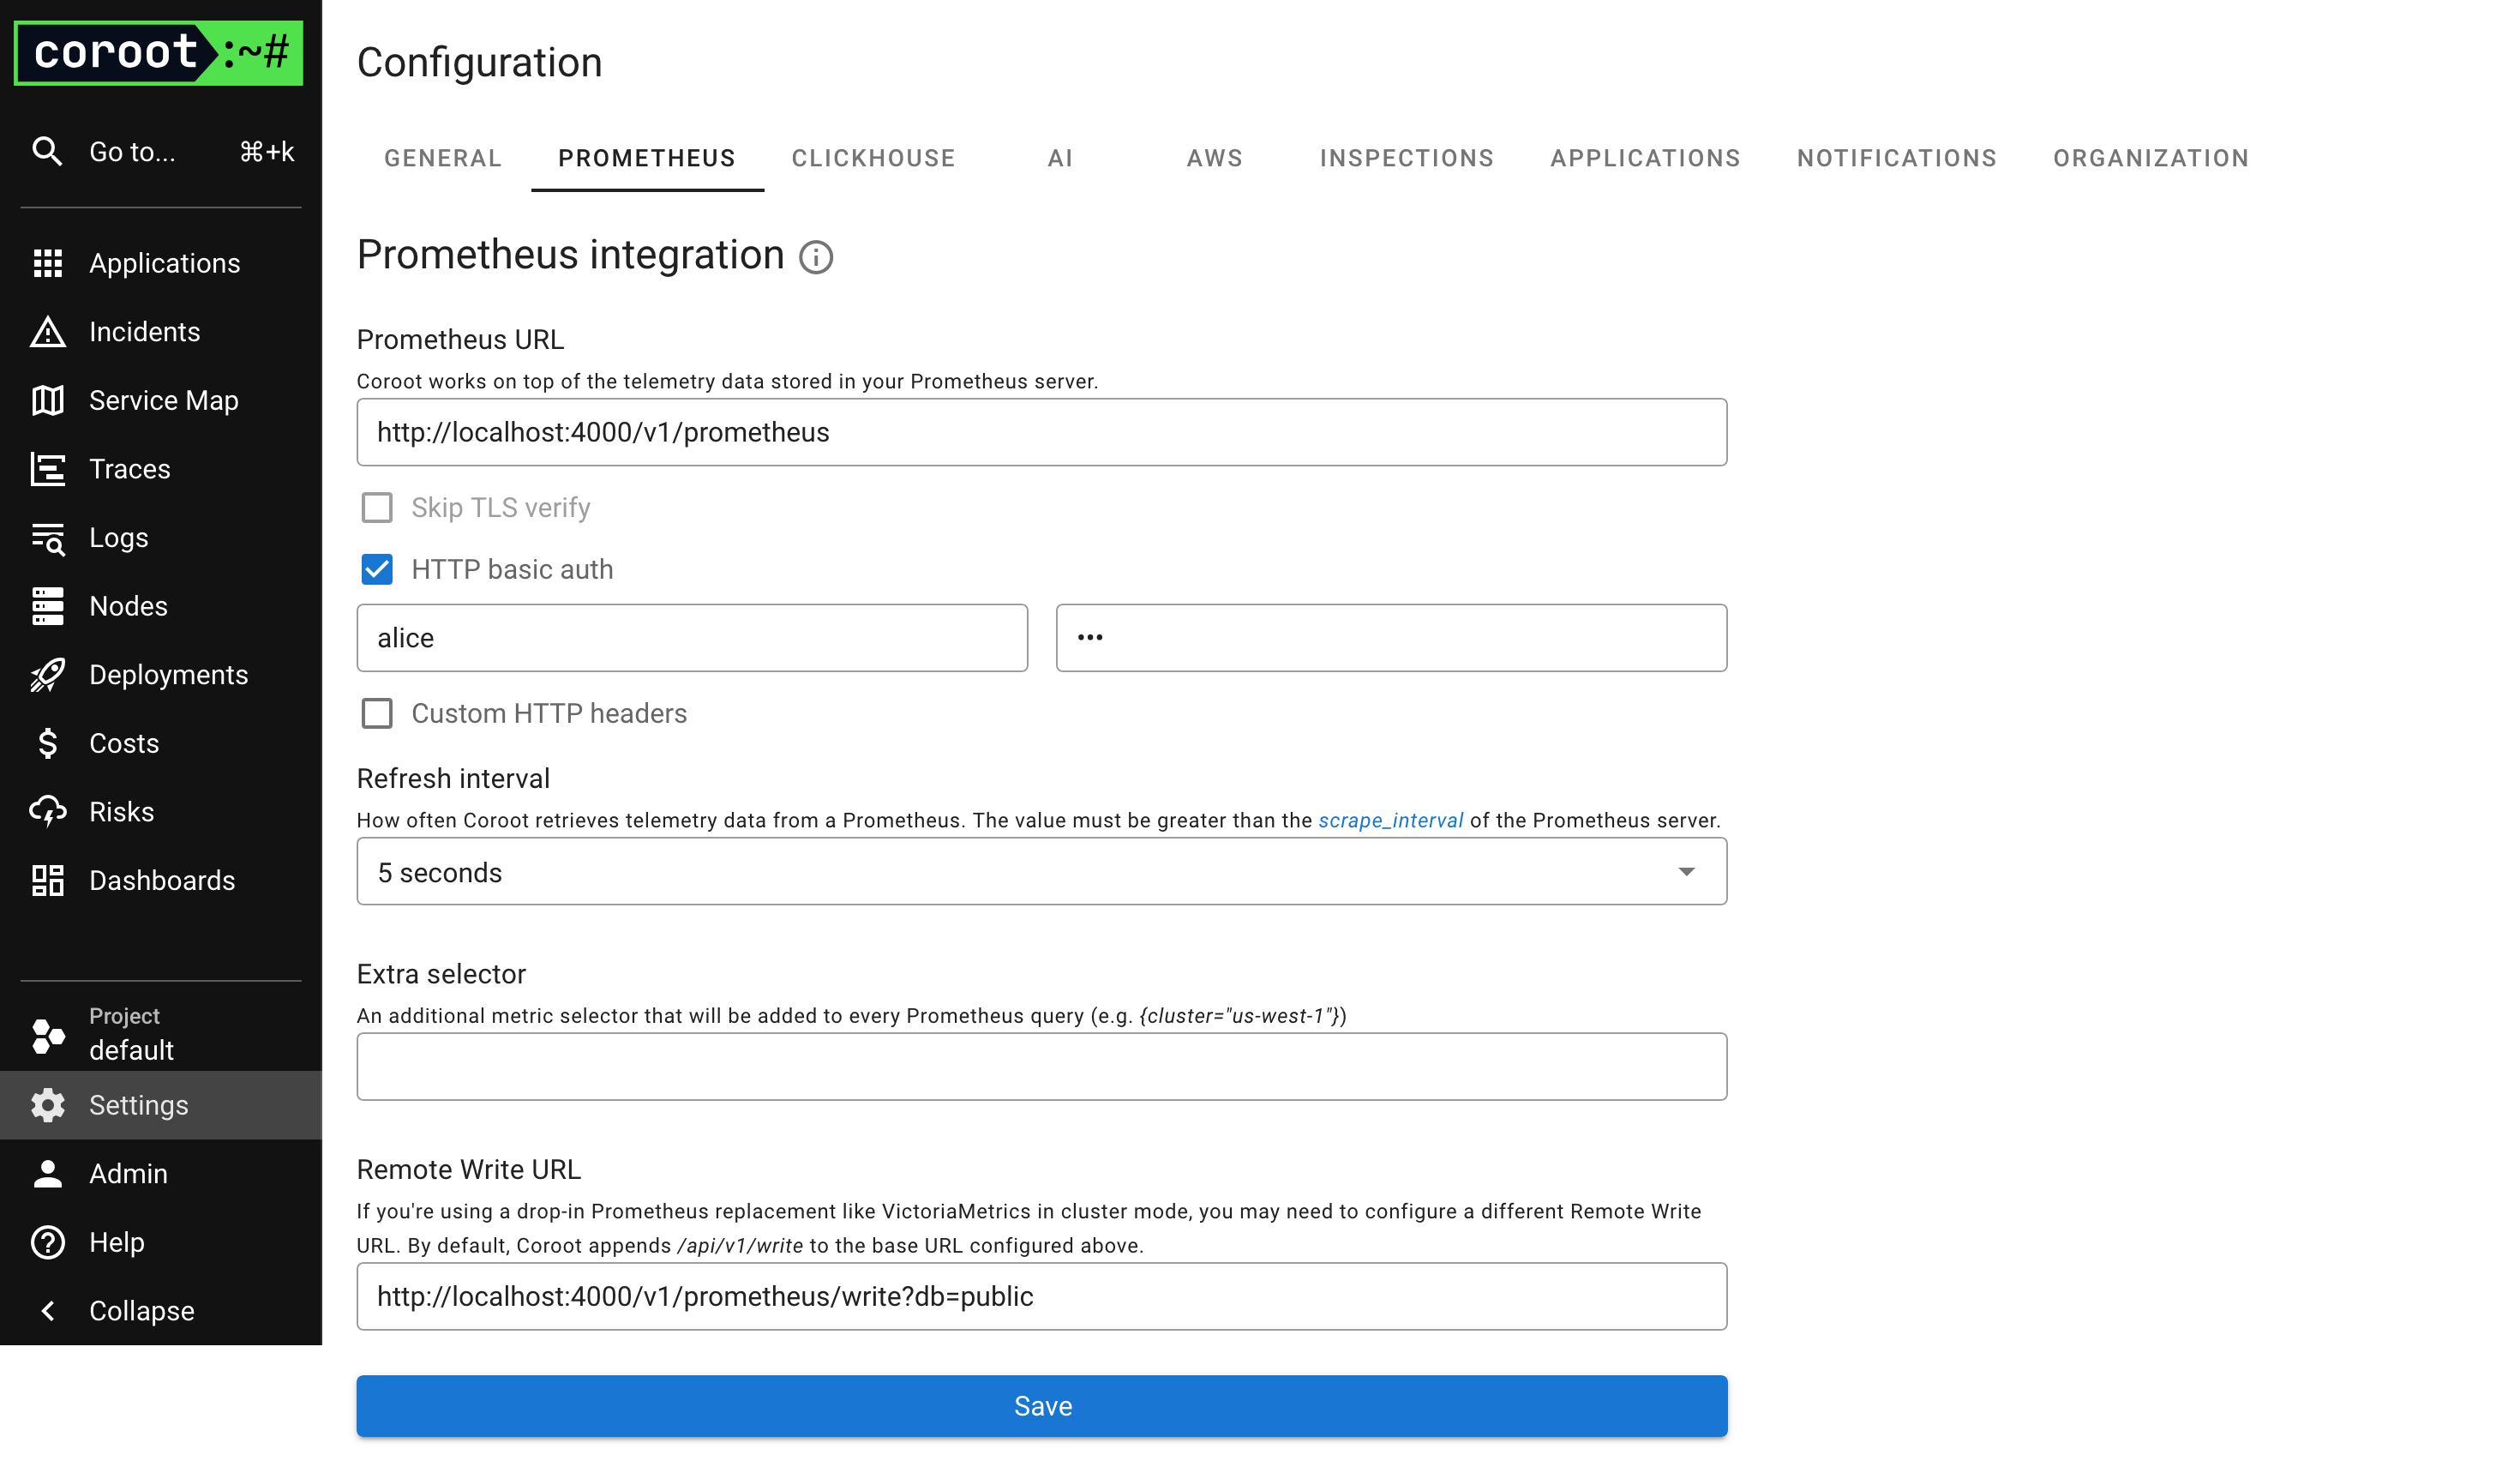
- Prometheus URL:
http://localhost:4000/v1/prometheus - Authentication: Enable HTTP basic auth and enter your GreptimeDB username and password.
- Remote Write URL:
http://localhost:4000/v1/prometheus/write?db=public
The following image illustrates the Coroot configuration:
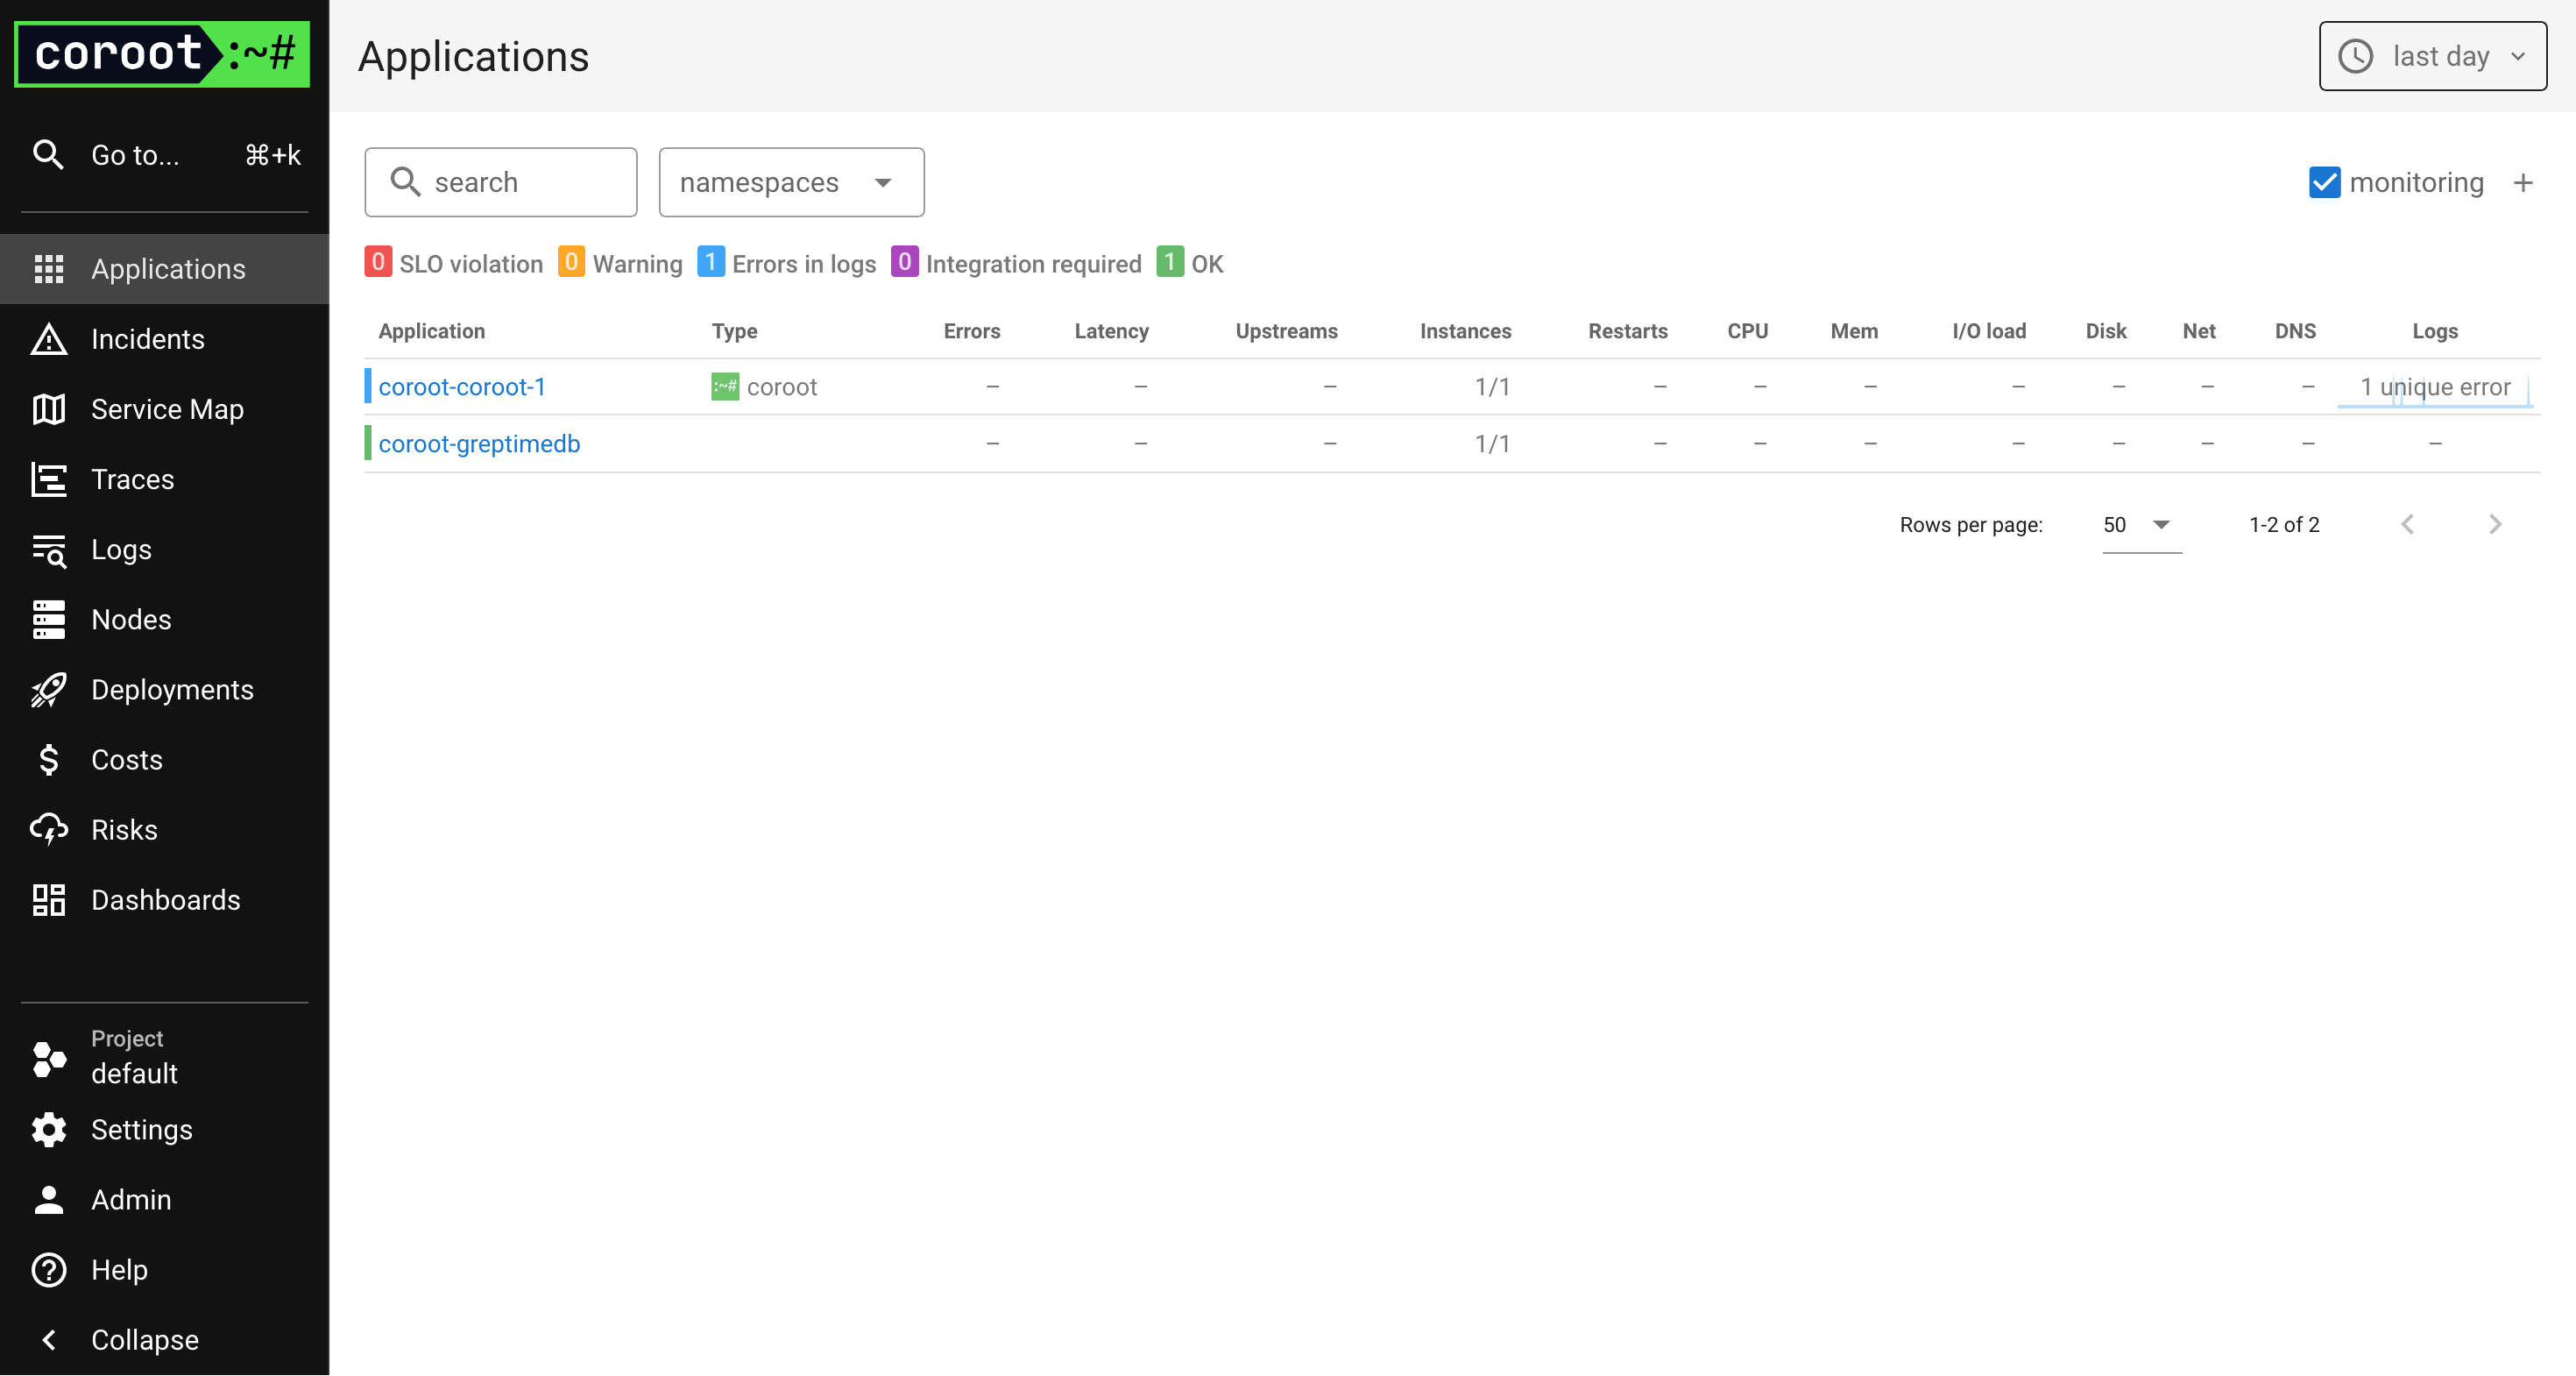
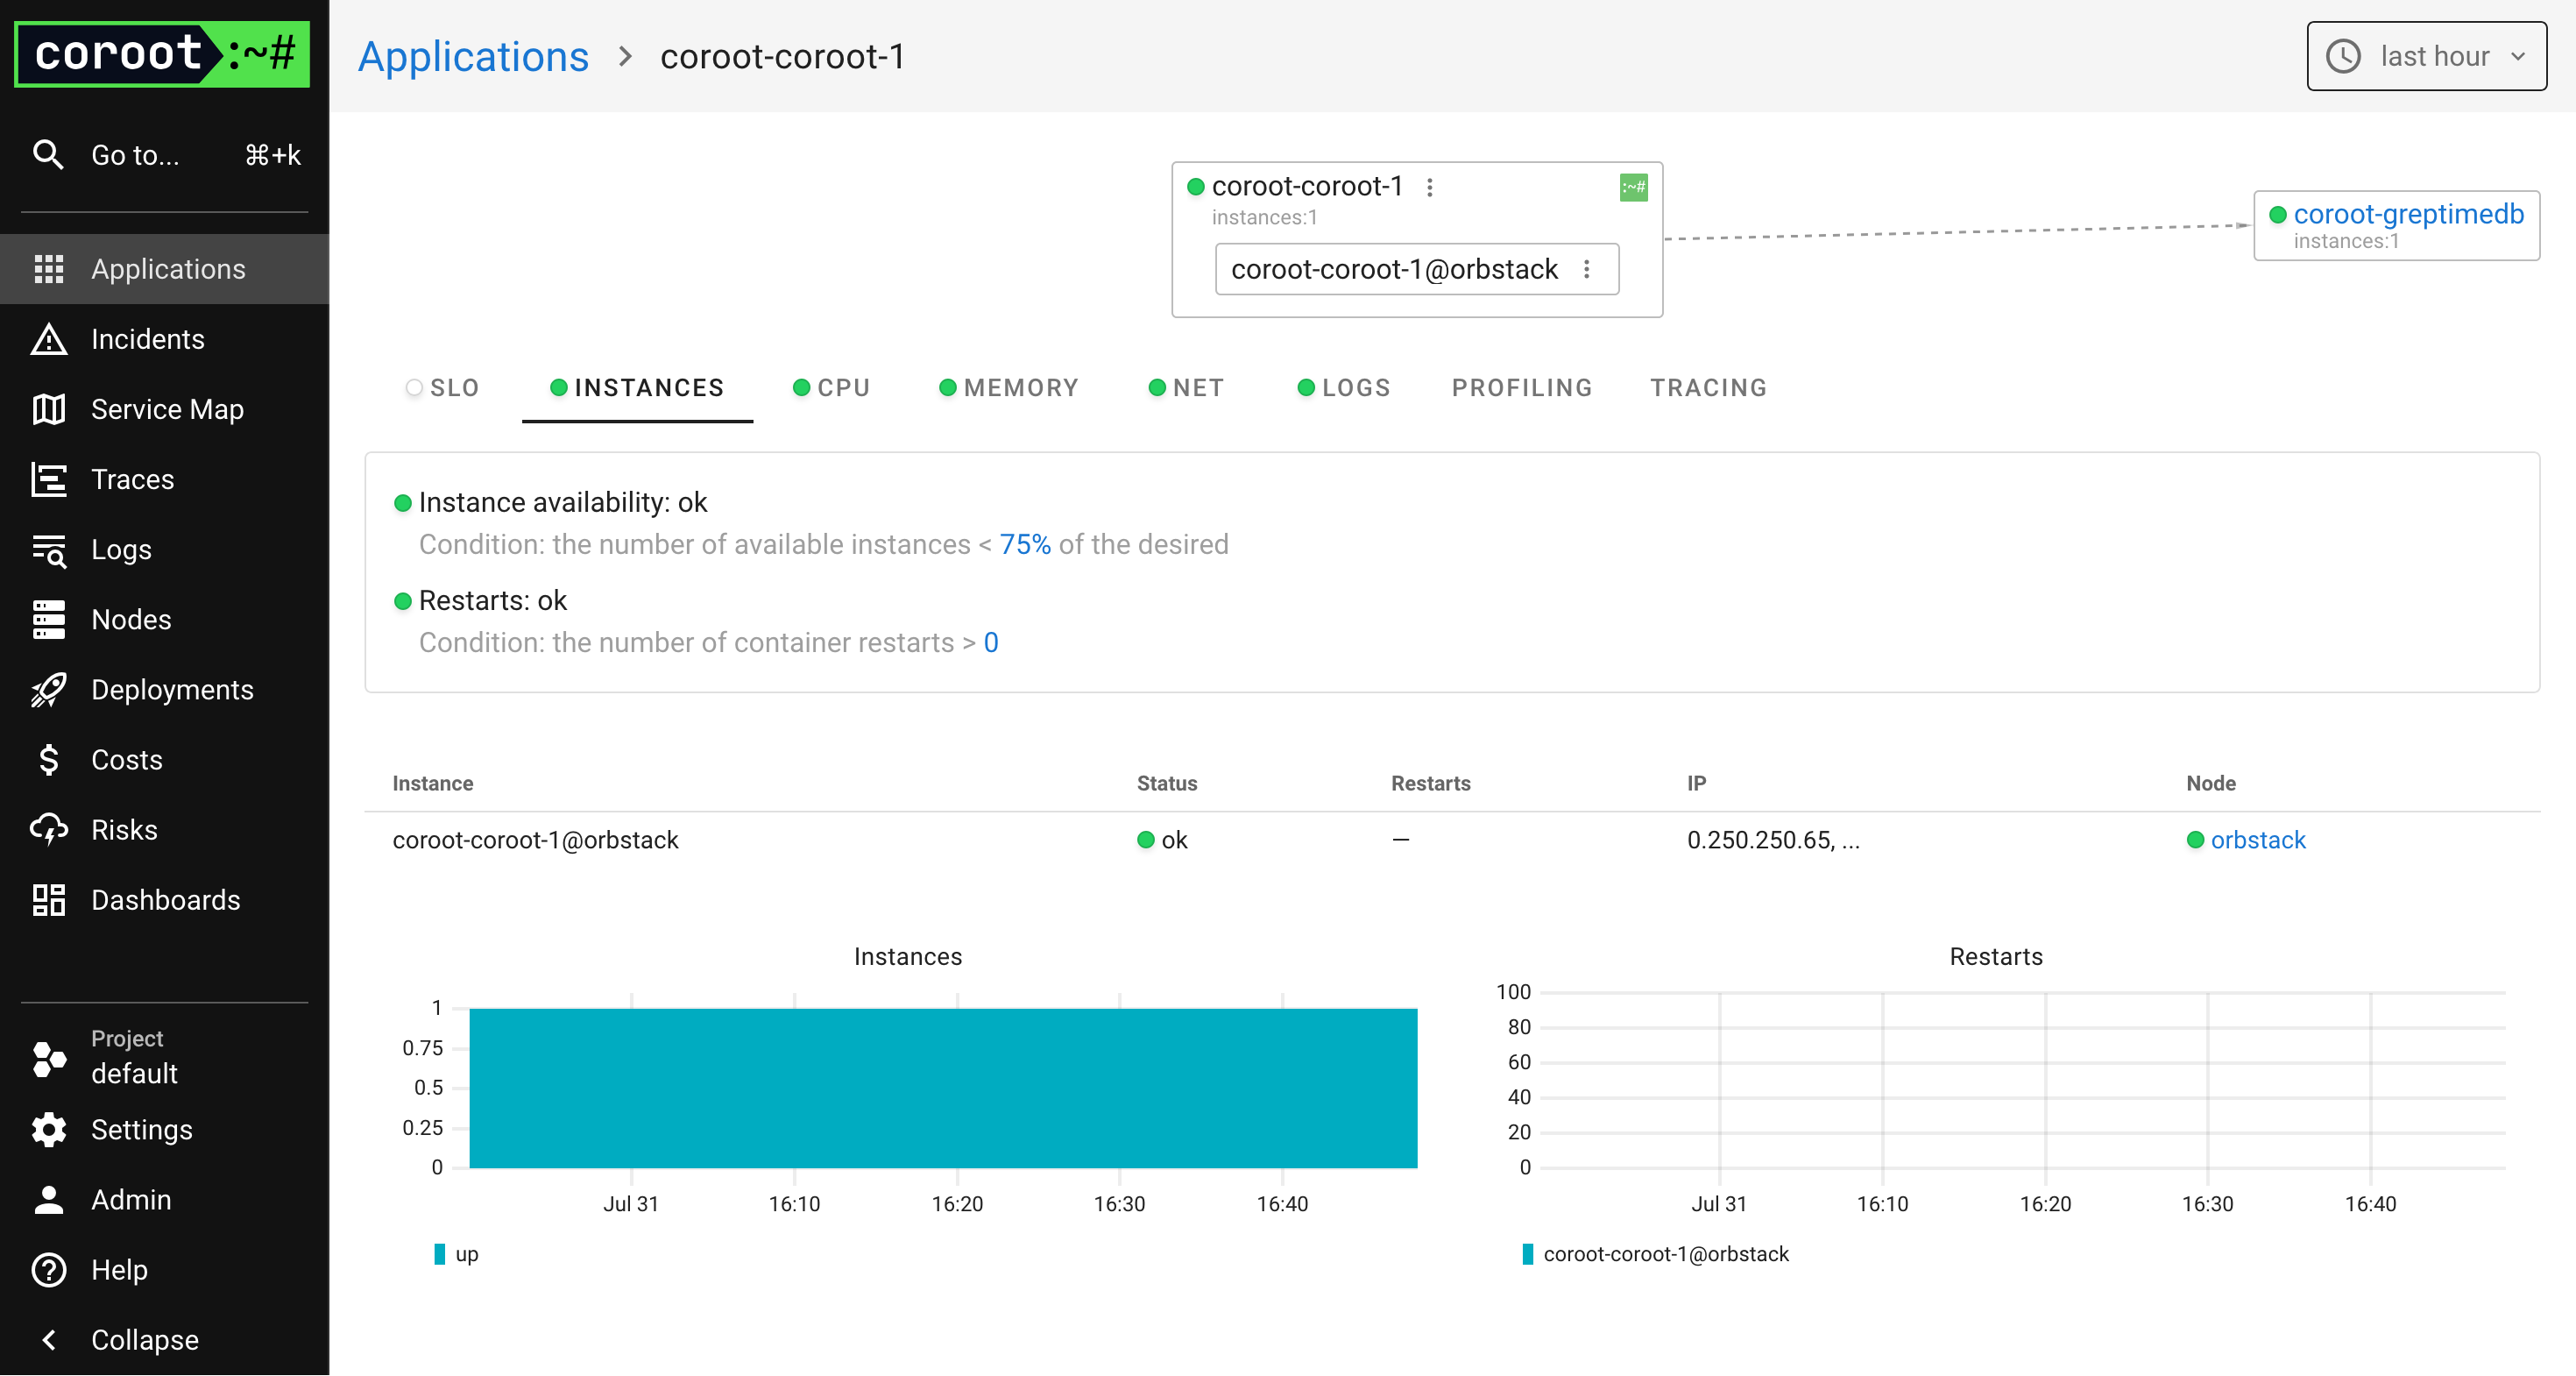
Once configured, Coroot will begin collecting and visualizing data from GreptimeDB. You can view the metrics already displayed in the Coroot dashboard.
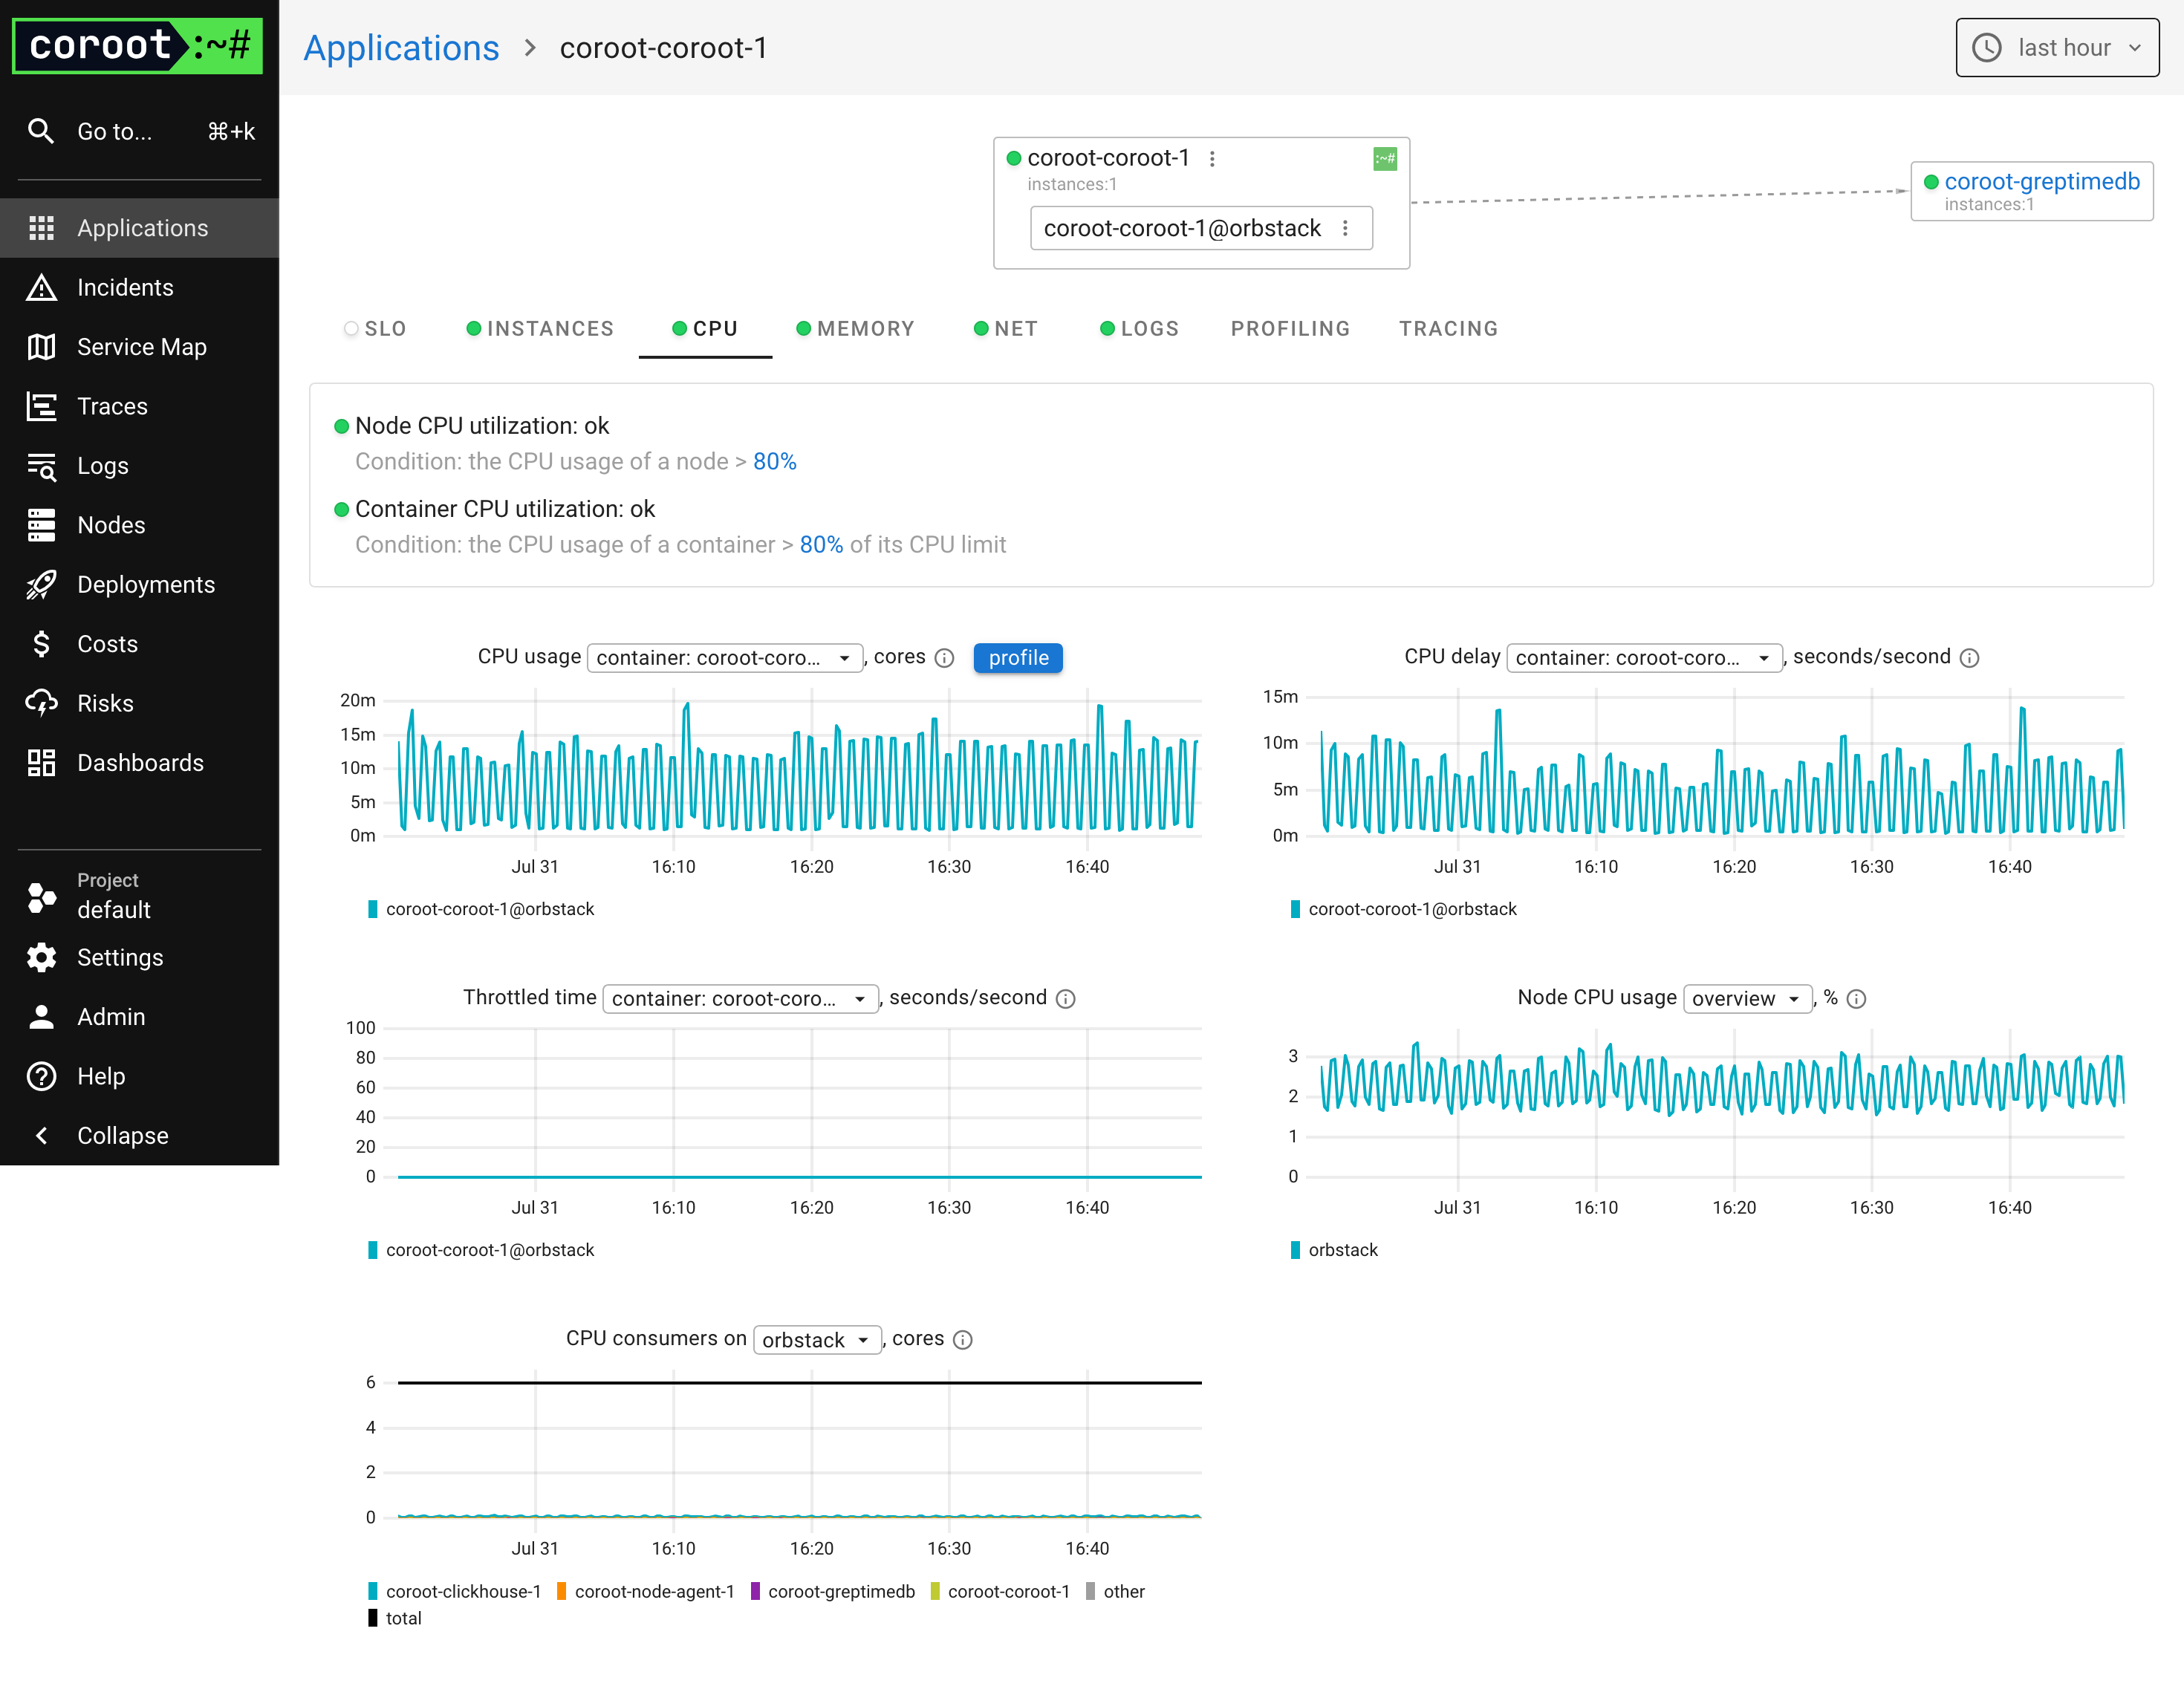
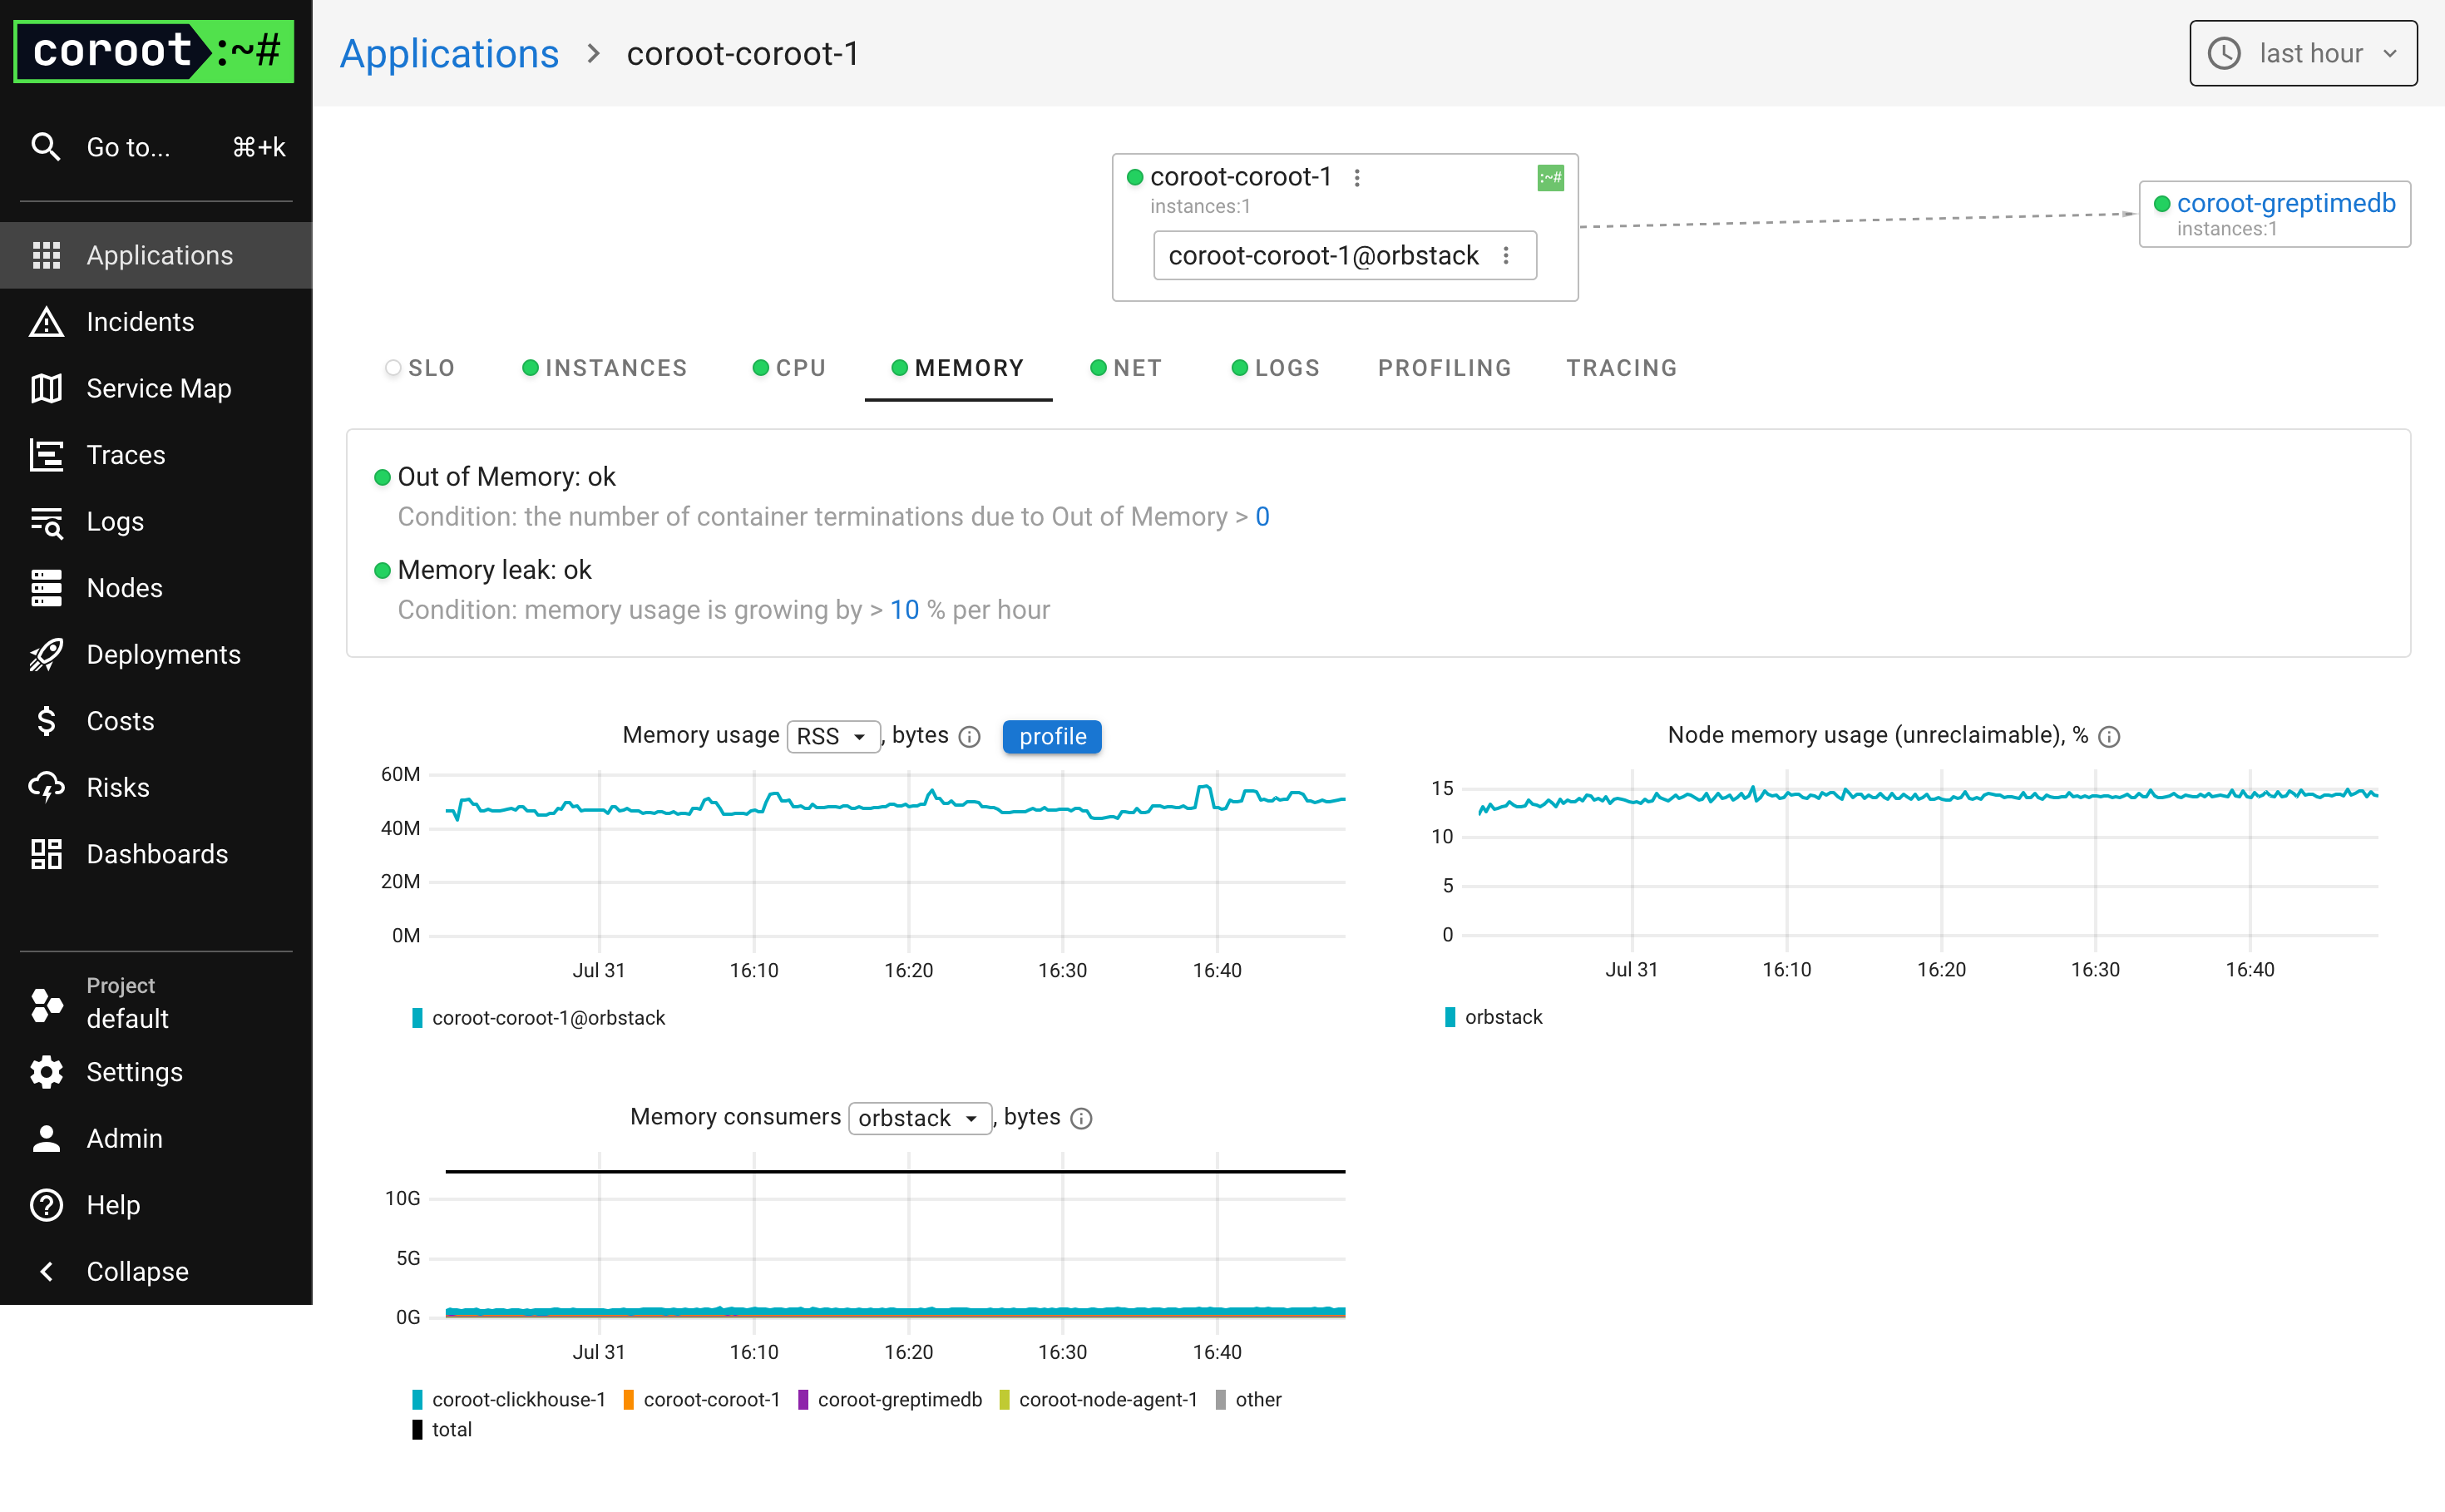
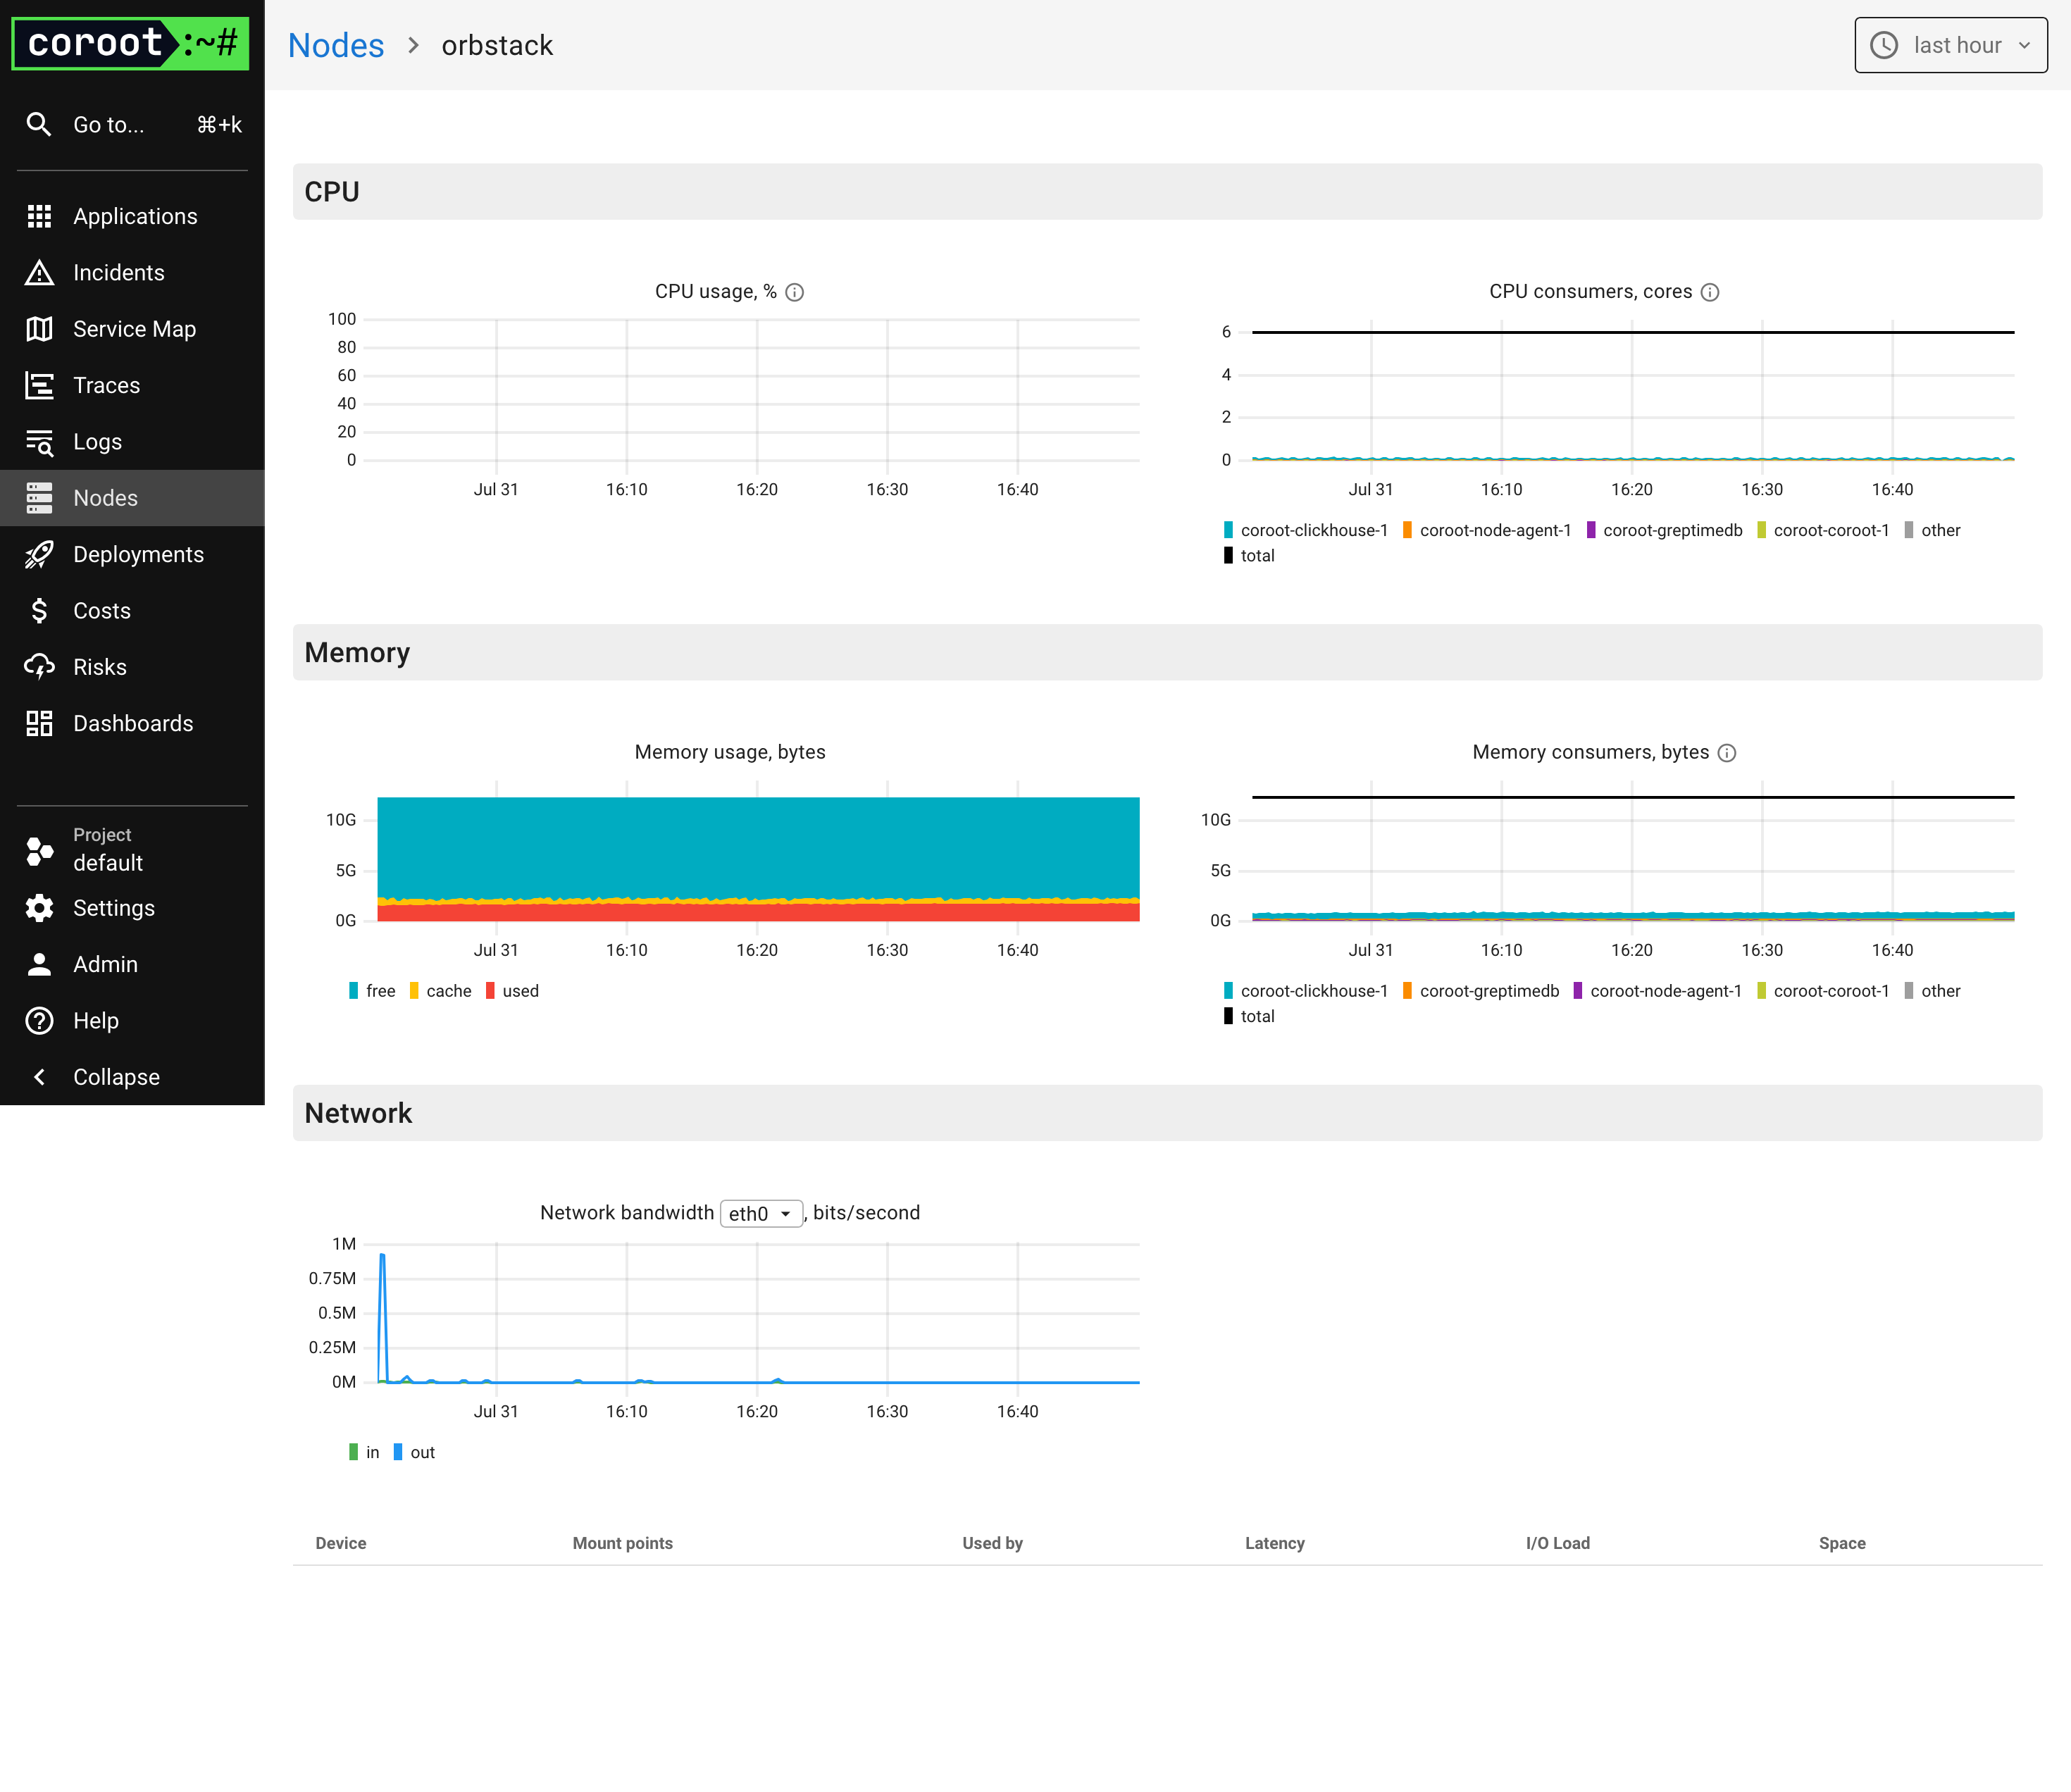
The following images show examples of Coroot dashboard visualizations. You can view instance statuses on the Application page and click through to detailed pages to examine CPU, memory, network, and other metrics:
Conclusion
The integration of GreptimeDB and Coroot creates a powerful, intelligent, and user-friendly observability solution:
- GreptimeDB delivers high-throughput metric ingestion, cost-effective storage, and robust data management capabilities.
- Coroot transforms this data into actionable visual insights, enabling developers to quickly diagnose issues and optimize system performance.
Beyond Prometheus compatibility, GreptimeDB seamlessly integrates with distributed tracing tools like Jaeger, creating a comprehensive observability ecosystem by unifying metrics, logs, and trace data storage. We look forward to deepening our collaboration with Coroot to deliver even more comprehensive and powerful solutions for developers.


