On this page
🎥 Watch the full talk: Observability Data Lake: Motivation and Methodology – MDI Summit 2025
Observability is new Big Data
Over the last few years, observability has become the new big data in terms of volume, and applications. Developer collects all types of data from their application and runtime, as input of devops loop.
Observability is a fairly crowded space. There’re lots of services, protocols, formats and databases. We introduce this 'V Model' for demonstrating the data flow in observability data pipeline, from the data source to data application.
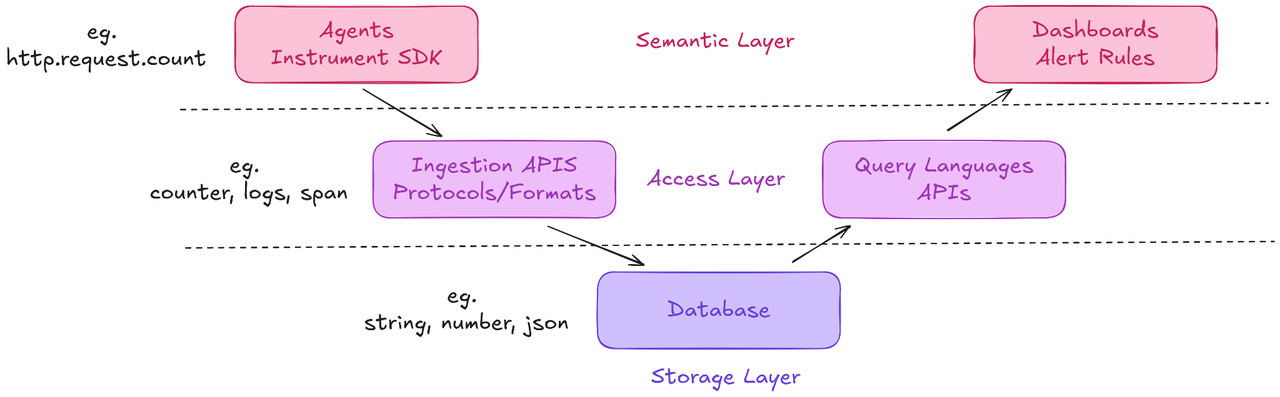
The left wing is about data ingestion, from the application or agents, to api, all the way to the database. The right wing is data retrieval from database, using query languages then displayed data applications.
We have another dimension that divides the stack into 3 layers:
- The semantic layer: This layer defines what data we are collecting and how we will make use of it. There are end-to-end O11y services using this layer as the user interface, such as DataDog.
- The data access layer: This layer is about how to ingest and retrieve data, serving as a bridge between application and underlying database. Popular standards like OpenTelemetry is mostly working on this layer.
- The storage layer: The underlying database. There are multiple databases, either general-purpose, analytical or specialized key-value, metric stores available at this layer, including GreptimeDB.
The Motivation
The current O11y data pipeline follows how the original monitoring data way. It is divided into 3 major types every developer knows about: metrics, logs and traces. Each of the data types has its own pipeline for all the three layers in our 'V Model'.
This separation creates several challenges:
- Data silo
- Lack of original data
- Static instrument
These 3 issues stop us from effectively managing and making full use of observability data.
The O11y Data Lake is more than a Data Lake itself
Simply replacing the underlying database into a object storage based, compute-storage separated solution is not the whole answer to the data lake approach, although the capability of a scalable data lake is the foundation.
In order to address the 3 major issues of the traditional o11y data approach, we will:
Collect raw data as much as possible from the application, using data pipeline to generate metrics and traces from the raw data, store them in the data lake
Aggregation is postponed to database instead of application memory. This will simplify the data structure of data that sits in database. We can also reorganize aggregations, part of them can be done at query time.
Because aggregation is shifted right in the process, we can update aggregation rules by
A. Update database materialized view rules
B. Update database queries
C. The feedback loop is shortened from a few days to a few seconds
As we explored in the talk, the Observability Data Lake represents a new way of thinking about O11y data — not just as metrics, logs, and traces, but as a unified, evolving dataset that empowers faster iteration, better insights, and AI-ready infrastructure. It’s not only about where we store data, but how we transform, query, and learn from it in real time.
Conclusion
A fully featured O11y data lake practice is about
Using data lake infrastructure for:
a. Capability for holding and querying large scale raw data
b. Affordable permanent storage on Object Storage
c. Elastic, Scalable and Flexible Architecture
Collecting Context-rich Raw Data at data source
3-Pillars (metrics, logs and traces) become views
Faster Feedback with Exploratory Data Analysis for Unknown-unknown
Providing Higher-Quality Data for AI


