On this page
Overview
GreptimeDB Trigger embeds alerting directly in the database: define rules with SQL, automatically manage alert states (pending → firing → inactive), and send notifications via Webhook. GreptimeDB evaluates these rules periodically and fires notifications when conditions are met.
Key Features
- SQL-native: Define trigger rules in SQL, reusing GreptimeDB's built-in functions without a learning curve
- Multi-stage state management: Built-in pending / firing / inactive state machine prevents flapping and duplicate notifications
- Rich context: Custom labels and annotations with automatic injection of query result fields to pinpoint root causes
- Ecosystem-friendly: Alert payload fully compatible with Prometheus Alertmanager—use its grouping, inhibition, silencing, and routing without glue code
Quick Start
This guide walks through an end-to-end alerting scenario: monitor system load (load1) and fire alerts when load exceeds a threshold.
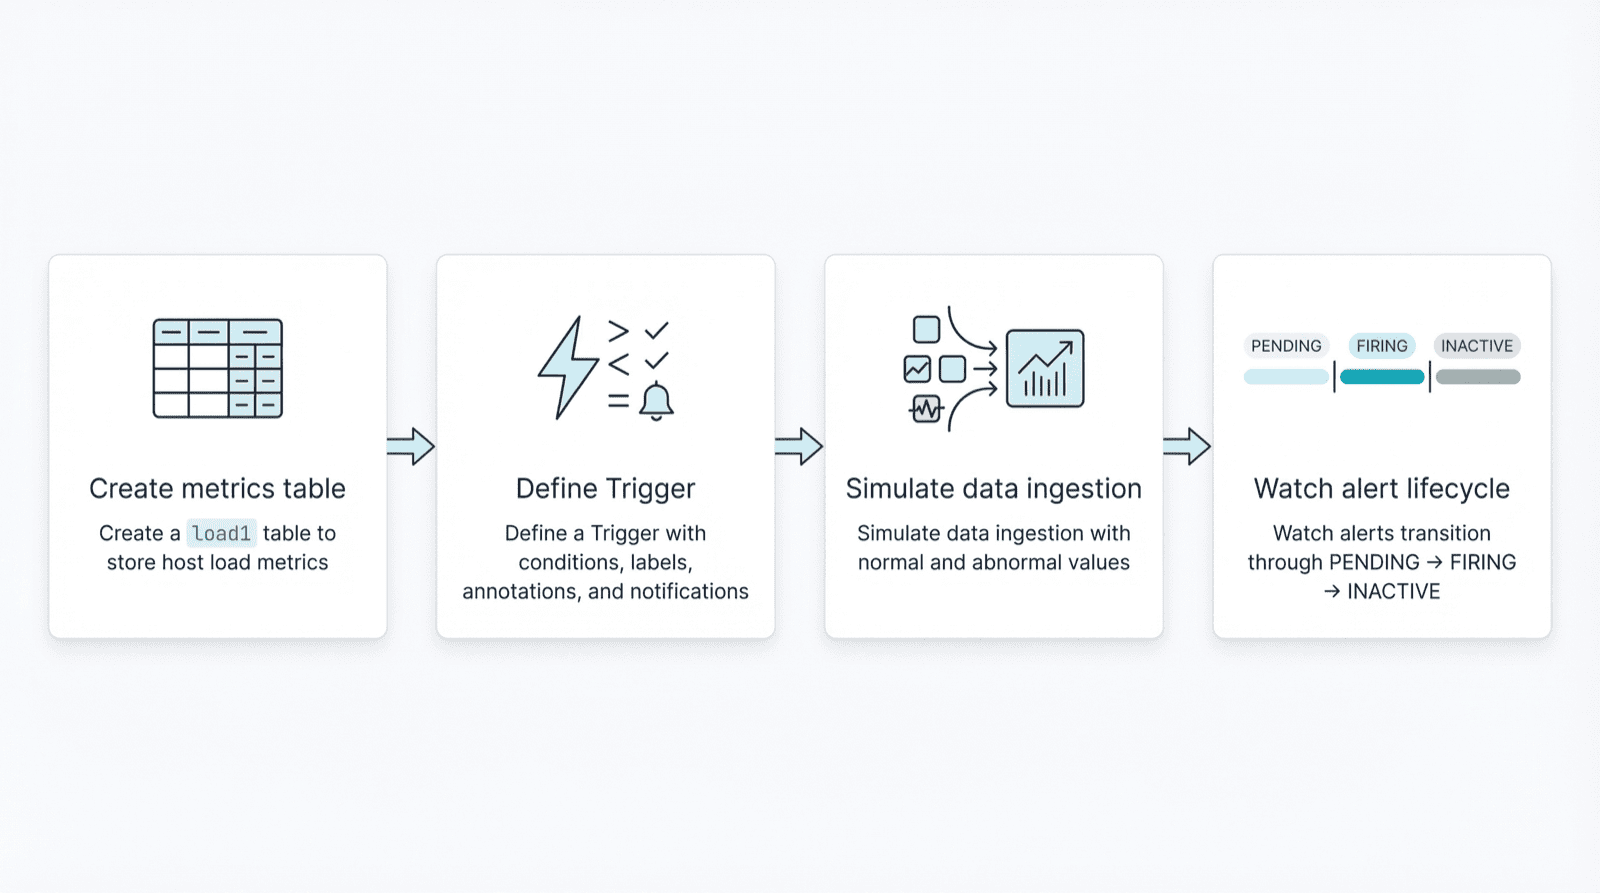
We'll cover:
- Create a
load1table to store host load metrics - Define a Trigger with conditions, labels, annotations, and notifications
- Simulate data ingestion with normal and abnormal values
- Watch alerts transition through PENDING → FIRING → INACTIVE
1. Create the Data Table
Connect to GreptimeDB with a MySQL client and create the load1 table:
sql
CREATE TABLE `load1` (
    host            STRING,
    load1           FLOAT32,
    ts              TIMESTAMP TIME INDEX
) WITH ('append_mode'='true');
2. Create the Trigger
sql
CREATE TRIGGER IF NOT EXISTS `load1_monitor`
    ON (
        SELECT
            host          AS label_host,
            avg(load1)    AS avg_load1,
            max(ts)       AS ts
        FROM public.load1
        WHERE ts >= NOW() - '1 minutes'::INTERVAL
        GROUP BY host
        HAVING avg(load1) > 10
    ) EVERY '1 minutes'::INTERVAL
    FOR '3 minutes'::INTERVAL
    KEEP FIRING FOR '3 minutes'::INTERVAL
    LABELS (severity=warning)
    ANNOTATIONS (comment='Your computer is smoking, should take a break.')
    NOTIFY(
        WEBHOOK alert_manager URL 'http://localhost:9093' WITH (timeout='1m')
    );
This Trigger runs every minute, computes average load per host over the last 60 seconds, and generates alerts for hosts where avg(load1) > 10.
Key parameters:
FOR: Condition must persist for 3 minutes before the alert enters firing stateKEEP FIRING FOR: Once firing, the alert stays firing for 3 minutes even if the condition clears
See the official documentation for full syntax.
3. Check Trigger Status
List all Triggers:
sql
SHOW TRIGGERS;View the creation statement:
sql
SHOW CREATE TRIGGER `load1_monitor`\GQuery detailed information:
sql
SELECT * FROM information_schema.triggers\GExample output:
   trigger_name: load1_monitor
     trigger_id: 1024
        raw_sql: (SELECT host AS label_host, avg(load1) AS avg_load1, ...)
       interval: 60
         labels: {"severity":"warning"}
    annotations: {"comment":"Your computer is smoking, should take a break."}
            for: 180
keep_firing_for: 180
       channels: [{"channel_type":{"Webhook":{...}},"name":"alert_manager"}]
View alert instances:
sql
SELECT * FROM information_schema.alerts;With no data written yet, this returns an empty set.
4. Write Data and Observe Alert States
This script simulates data ingestion: normal values for the first minute, high values for 6 minutes to trigger alerts, then back to normal.
bash
#!/usr/bin/env bash

MYSQL="mysql -h 127.0.0.1 -P 4002"

insert_normal() {
  $MYSQL -e "INSERT INTO load1 (host, load1, ts) VALUES
    ('newyork1', 1.2, now()),
    ('newyork2', 1.1, now()),
    ('newyork3', 1.3, now());"
}

insert_high() {
  $MYSQL -e "INSERT INTO load1 (host, load1, ts) VALUES
    ('newyork1', 1.2, now()),
    ('newyork2', 12.1, now()),
    ('newyork3', 11.5, now());"
}

# First minute: normal data
for i in {1..4}; do insert_normal; sleep 15; done

# Next 6 minutes: high values
for i in {1..24}; do insert_high; sleep 15; done

# After: back to normal
while true; do insert_normal; sleep 15; done
In another terminal, query alert status:
sql
SELECT * FROM information_schema.alerts\GState Transitions
Phase 1: No alerts
Empty setPhase 2: PENDING (condition met, FOR duration not reached)
*************************** 1. row ***************************
  trigger_id: 1024
trigger_name: load1_monitor
      labels: {"alert_name":"load1_monitor","host":"newyork2","severity":"warning"}
 annotations: {"avg_load1":"12.100000381469727","comment":"Your computer is smoking, should take a break.","ts":"1765718116619"}
      status: PENDING
   active_at: 2025-12-14 13:15:29.064475
    fired_at: NULL
 resolved_at: NULL
last_sent_at: NULL
*************************** 2. row ***************************
  trigger_id: 1024
trigger_name: load1_monitor
      labels: {"alert_name":"load1_monitor","host":"newyork3","severity":"warning"}
 annotations: {"avg_load1":"11.5","comment":"Your computer is smoking, should take a break.","ts":"1765718116619"}
      status: PENDING
   active_at: 2025-12-14 13:15:29.064475
    fired_at: NULL
 resolved_at: NULL
last_sent_at: NULL
2 rows in set (0.008 sec)
Phase 3: FIRING (FOR satisfied, notifications sent)
      status: FIRING
    fired_at: 2025-12-14 13:19:29
last_sent_at: 2025-12-14 13:19:29
Phase 4: INACTIVE (condition cleared + KEEP FIRING FOR expired, recovery sent)
      status: INACTIVE
 resolved_at: 2025-12-14 13:22:29
5. Alertmanager Integration (Optional)
If you have Prometheus Alertmanager deployed, GreptimeDB automatically pushes firing and inactive alerts to it.
After each evaluation, the Trigger injects query result fields into labels and annotations. In this example, avg_load1 appears in annotations—reference it in Alertmanager notification templates to include hostname, load values, and other context.
Since the payload is Alertmanager-compatible, you can use grouping, inhibition, silencing, and routing without adapters.
Summary
This guide covered the basic Trigger workflow: SQL-defined rules, automatic state management, and Prometheus ecosystem integration. Whether you're prototyping or building production alerting, Trigger simplifies the path.


