
On this page

Overview
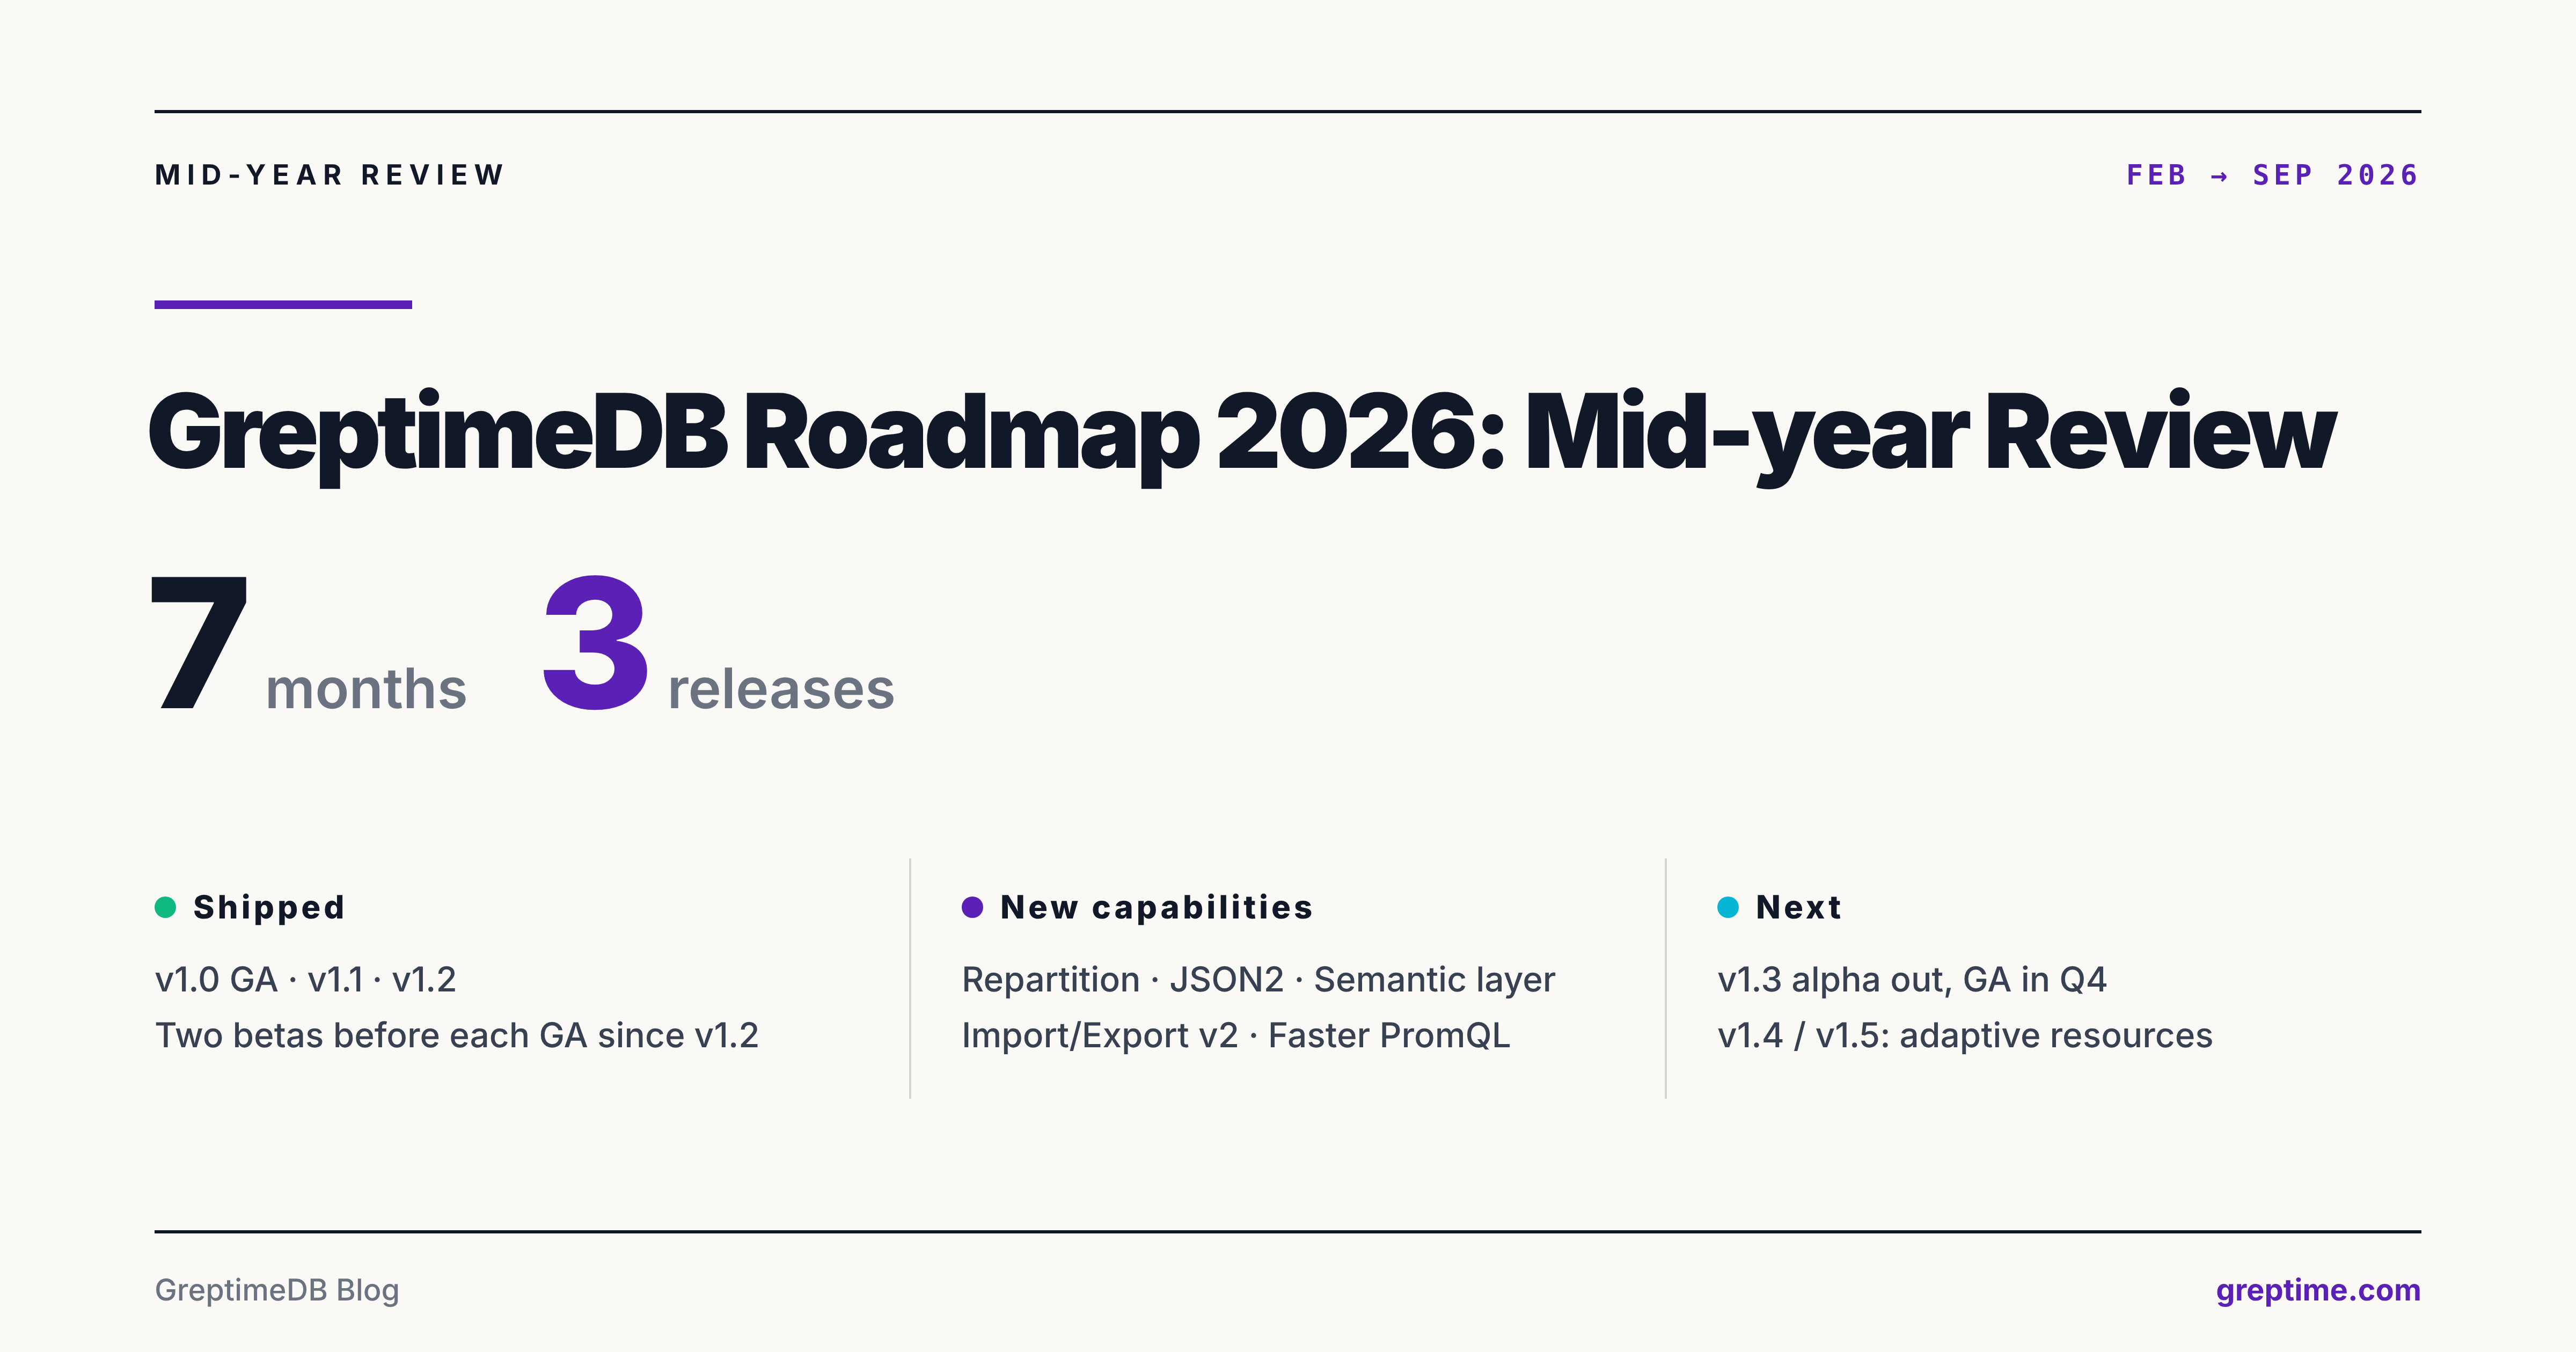
We published the GreptimeDB Roadmap 2026 in February. Seven months in, this is where things stand as of mid-September.
We released v1.0 GA, v1.1, and v1.2, adding online repartitioning, the JSON2 type, Import/Export v2, an experimental semantic layer for tables, and a number of query and write optimizations. Two items from the original plan, adaptive resource management and moving Remote Compaction/Indexing from prototype to production, have moved to v1.4 and v1.5.
Milestones
| Version | February plan | Current status and revised plan |
|---|---|---|
| v1.0 GA | End of March | Released April 8 |
| v1.1 | Q2: Remote Compaction/Indexing to production, Metric Engine optimization, Vector Index and AI Functions, Import/Export v2, JSON2 type | Released June 14, v1.1.1 on June 18. Actual contents: online repartitioning, table semantic layer, query performance improvements |
| v1.2 | Q3: adaptive resource management phase 1, Auto Rollup, Flow Engine enhancements, Major Compaction | beta.1 on August 1, beta.2 on August 21, GA on September 8, v1.2.1 on September 16. Focus shifted to the JSON2 type and Import/Export v2 |
| v1.3 | Q4: adaptive resource management phase 2, Pandas DataFrame SQL, Log Context Search, open table format compatibility | alpha.1 on September 3, GA targeted for September. Focus shifted to Metric Engine and compaction optimization |
| v1.4 | — | Planned for Q4: adaptive resource management phase 1, Auto Rollup, Flow Engine enhancements, Major Compaction |
| v1.5 | — | Planned for late Q4: adaptive resource management phase 2, Remote Compaction/Indexing to production, Log Context Search, open table format compatibility |
Why the plan changed
When we wrote the roadmap, the plan was a release every month or two, and we kept to that through the first half of the year. But every release was followed by one or two fix releases. Monthly releases plus large changes like the flat format, the JSON2 type, and native histograms meant some compatibility issues did not surface until users hit them. Starting with v1.2, we ship two betas first and release the GA once neither shows serious problems.
Conversations with users and the community, plus requirements raised in PoCs, led us to reorder priorities. Query and write optimization, security hardening, and the semantic layer moved in. Vector Index, AI Functions, and Pandas DataFrame SQL were dropped, freeing up effort for querying and storing telemetry data.
Major unplanned deliveries
The work that took the most effort over these seven months was not on the February roadmap.
Semantic layer (in progress, experimental): keeps semantic information from OTLP, such as type, unit, and temporality, alongside the data. Introduced in v1.1; v1.3 adds metric type and unit from Prometheus Remote Write v2. On top of this, v1.3 will ship an experimental entity relationship graph that derives service-to-service call relationships, along with call volume, errors, and latency, directly from telemetry data, without maintaining a separate service catalog (#8609). The MCP Server already uses this information to give AI assistants context.
Query performance: in v1.1 benchmarks, average PromQL query latency dropped 20% to 40%, and the TSBS
cpu-max-all-8query ran 4.5x faster. This round included optimizations to range functions such asrateandincrease, and fewer SST reads through the page index. Later versions continued with filter pushdown (v1.1.3) and dictionary encoding of series keys (v1.2). These are benchmark results; actual gains depend on data and workload.Write performance: v1.0 added batching for Prometheus Remote Write. v1.2 gave each region its own write buffer limit, so write pressure on one region no longer affects the others. Cross-protocol batch writes, in progress for v1.3, will extend this batching to the HTTP write endpoints.
Query engine: DataFusion was upgraded from 52 in v1.0 to 55 in v1.3, bringing in upstream planning and execution improvements.
Storage format: flat SST became the default format (v1.0, can be reverted); sparse primary key encoding became the default (v1.2).
Dashboard: the Perses panels in v1.1 show trace lists and a Gantt view of a single trace; v1.2 added query snapshots, a command palette, and full-screen results.
Ecosystem and protocols: Splunk HEC ingestion, gRPC-Web, MySQL as an object store backend, and
COPY FROMsupport for skipping bad rows and headerless CSV.
Progress by area
This section follows the categories of the February roadmap.
High availability and reliability
Remote Compaction/Indexing to production: moved to v1.5.
Hot configuration reload: not started.
Unplanned: object storage WAL (in progress, experimental). The WAL writes directly to object storage, removing the cluster's dependency on Kafka. Not yet in a released version.
Database operability
Import/Export Tool v2: delivered. Started in v1.0; v1.2 added parallel chunking and resumable transfers.
Major Compaction: moved to v1.4.
Several unplanned operational capabilities also landed. Online repartitioning was completed in v1.1, and unpartitioned tables can now be split directly. v1.2 added
ADMIN discard_unflushed: when bad data blocks a flush, you can discard only the in-memory data and keep what is already on disk. Event records andSHOW FLOW STATUSmake DDL, cluster, and Flow issues easier to troubleshoot. StreamingEXPLAIN ANALYZEchanges from experimental to a regular feature in v1.3.Security: hashed password storage (v1.1); SQL local file access sandbox, table-level permissions, Postgres SCRAM authentication, and a separate API port (v1.2); HTTP Bearer Token authentication (v1.3). The local file access sandbox is a breaking change; local import/export paths from older versions need to be adjusted as described in the release notes.
Adaptive resource management
The two delivery phases moved from v1.2 / v1.3 to v1.4 / v1.5 because priorities changed: query and write optimization, security, and the semantic layer came first. The existing per-component limits for writes, queries, and compaction are sufficient under current workloads, so unified adaptive management is not the most urgent need. Memory limits and scheduling are partially done but not yet unified, and some pieces are still experimental features that are off by default.
Fine-grained memory tracking and control: in progress. Writes, queries, and compaction each have their own memory limits, and each region has its own write buffer limit. Unified memory management is not finished (#7094).
Cost-based adaptive scheduling: in progress. Scans are already metered by output bytes. Weighted scheduling between queries and writes is still an experimental feature, off by default, and compaction and flush are not yet connected (#8736).
Zero-tuning adaptive spill: in progress. For now there is an experimental spill configuration for the temp file path, space limit, and compression, and it can be disabled (#8884).
Load-aware compaction scheduling: in progress. The number of task-picking threads and the size of the blocking thread pool are now limited, and the task-picking strategy was adjusted per #8575.
Adaptive cache management, resource quotas, and admission control: not started.
Metric Engine optimization
Write optimization: bulk ingestion for OSS: delivered (v1.0).
Compaction optimization: partially done; the rest goes into v1.3.
Prometheus Remote Write 2.0: v1.2 supports the new protocol, plus ingestion, validation, and storage of native histograms, with ingestion off by default. v1.3 alpha adds querying: the data can be aggregated and read through the Prometheus query API, and quantiles can be computed for classic and native histograms separately within the same query, for example how long 95% of requests take to complete (P95). It also accepts OpenTelemetry's cumulative distribution statistics (cumulative exponential histograms).
Metadata management optimization (high-cardinality scenarios) and automatic multi-value optimization: not started.
Unplanned: series index (in progress). A query first finds the matching time series by tag, then uses the range index on SSTs to locate the corresponding data, reducing scans of irrelevant data. The two-phase series scan can also distribute these series across multiple output partitions for parallel reads.
Flow Engine
Extended time windows and aggregate functions: in progress. Delta merge for incremental aggregation has been merged; the rest is scheduled for v1.4.
Unplanned: v1.1 added experimental incremental reads. Previously every computation rescanned all source data; now it reads only what was added since the last run.
Logs and traces
JSON2: v1.2 delivers the new JSON type, with the new storage layout enabled in the GA release. It expands JSON paths up to a configured limit; anything beyond the limit is still kept, and the full JSON can be reconstructed at query time. Field-level indexing has not started. Tables using the old JSON type have known compatibility issues when upgrading to v1.2; see the release notes for the migration path. v1.2.1 also fixed a JSON2 data loss issue during compaction, so we recommend going straight to v1.2.1.
Log Context Search: moved to v1.5.
Unplanned: on the trace side, v1.1 supports custom partition rules for trace tables and a trace type allowlist. v1.3 is working on trace v2 ingestion, with attributes stored as JSON2.
New features
Vector Index and AI Functions: dropped. v1.4 plans to remove the existing Vector Index implementation.
Auto Rollup: moved to v1.4.
Pandas DataFrame SQL: dropped. Query optimization work such as a cost-based optimizer (CBO) will follow instead.
Open table format compatibility (Iceberg/DeltaLake): Iceberg is implemented in the Enterprise edition; the DeltaLake implementation is postponed.
What's next
With v1.2 out, the focus is v1.3: more PromQL and compaction optimizations. Adaptive resource management continues, split across v1.4 and v1.5.
v1.4 and v1.5 are both scheduled for Q4; in practice some of their features may ship in a single release.
Release dates are estimates and will be adjusted based on actual progress.
See the roadmap issue #7685 for discussion.
Get involved
Items with a tracking issue can be discussed directly in that issue. For anything else, comment on the roadmap issue, start a GitHub Discussion, or join the GreptimeDB Slack.


