
On this page


At a glance
- Industry: Commercial space (satellite communications, radar, terminal equipment)
- Challenge: Dozens to more than a hundred data experiments, with up to 3+ billion rows each. On InfluxDB 2.x, queries ran out of memory, the open-source edition could not scale out, and bucket count and Flux slowed the team down.
- Solution: Self-hosted GreptimeDB, fed by a customized Vector over gRPC. Satellite business metrics and logs are stored in GreptimeDB, and historical InfluxDB data has been migrated.
- Results: Experiment data is split into databases as needed; temporary experiments create tables and columns on write; metrics and logs share one SQL interface; the open-source edition can grow from a single node to a cluster.
Background
A commercial space company builds products and solutions for satellite communications, radar, and terminal equipment. Every stage of its satellite R&D produces timestamped data: device state, simulation results, test and trial data, plus the metrics and logs of the R&D platform itself. Satellite R&D can involve dozens to more than a hundred data experiments, and a single experiment can involve more than 3 billion rows.
The company originally stored this data in InfluxDB 2.x. As data volume and the number of experiments grew, queries frequently ran out of memory (OOM), and the single-node edition could not scale out. Bucket count, Flux, and the lack of vendor support added friction, and clustering and high availability required a commercial license. After evaluating ClickHouse, VictoriaMetrics, and GreptimeDB, the company chose GreptimeDB. GreptimeDB now runs as a self-hosted deployment, satellite business metrics and logs are written to it, and historical data from InfluxDB has been migrated.
After the migration, InfluxDB's limits no longer shape the platform design. Experiment data can be split into databases as needed, without worrying about bucket count. Metrics and logs both live in GreptimeDB and can be analyzed together with the same SQL. As data keeps growing, the deployment can scale from a single node to a cluster, since the open-source edition of GreptimeDB supports distributed deployment.
InfluxDB's limits
InfluxDB served the company well in early R&D. Data could be written first and the schema worked out later, which suited satellite R&D: data comes from different models, experiments, and test environments, and the early stages produce a lot of temporary data whose fields are hard to define in advance.
The problems below appeared as experiments grew to billions of rows each:
- Out-of-memory queries and no way to scale out. A single experiment can hold more than 3 billion rows, and queries often failed for lack of memory. The open-source edition of InfluxDB runs on a single node only; clustering and high availability require a commercial edition. Once the node's resources were used up, there was no room to grow.
- Bucket count. InfluxDB 2.x uses buckets as the unit for organizing data and setting retention. The company partitions data by experiment with separate retention periods, so dozens to a hundred-plus experiments meant dozens to a hundred-plus buckets. InfluxDB's documentation states that a single open-source instance supports approximately 20 buckets actively being written to or queried, and that more can hurt performance.
- Flux. The people who query data include software developers, test engineers, algorithm engineers, simulation engineers, and platform engineers, and most of them know SQL. Having to learn Flux means fewer people can analyze data on their own.
- Vendor support. The company ran the open-source edition, which comes without vendor support, so problems had to be debugged in-house.
- Limits in InfluxDB 3 Core. The newer InfluxDB 3 Core has hard limits: at most 5 databases, 2,000 tables across all databases, and 500 columns per table. These conflict with a design that uses one database per experiment and one wide table per object.
Ingestion layer: Vector and field-prefix conventions
Data is ingested through a modified Vector. When OpenTelemetry metrics are written to InfluxDB, each metric name becomes its own measurement by default, so data spreads across a large number of measurements. In satellite R&D, a single object often reports many parameters at the same moment, and the platform team wanted those parameters in one wide table per object. They implemented schema-mapping rules in Vector:
- Fields prefixed with
tag_map to tags; fields prefixed withfield_map to fields. - Data under the same measurement name is merged into the same physical wide table.
text
tag_satellite_id
tag_experiment_id
field_temperature
field_voltage
field_current
Engineers send data that follows the convention and do not need to know how the database organizes it. This approach also became a selection criterion: the database had to let the platform enforce schema governance while still accepting free-form writes during R&D.
Evaluation
ClickHouse is fast and widely adopted, but it usually requires designing the table schema, sort key, and partitioning before data is written. The company has a lot of temporary experiment data; some experiments last only a few days, and their fields keep changing. Defining a schema and creating tables before every experiment would add a step to the experiment workflow.
VictoriaMetrics is focused on metrics. Besides satellite business metrics, the company wants logs, traces, and R&D process data on the same infrastructure, without maintaining a separate system for each data type.
GreptimeDB met the key requirements:
- Built for time-series workloads, with metrics, logs, and traces in one database.
- The open-source edition scales from a single node to a distributed cluster.
- SQL support, so engineers do not need to learn a new query language.
- Governed data follows platform-defined table schemas, while temporary data creates tables and adds columns automatically on write.
- Open source under Apache 2.0, with direct access to the Greptime engineering team when problems come up and an enterprise edition available as an upgrade path.
How it works today
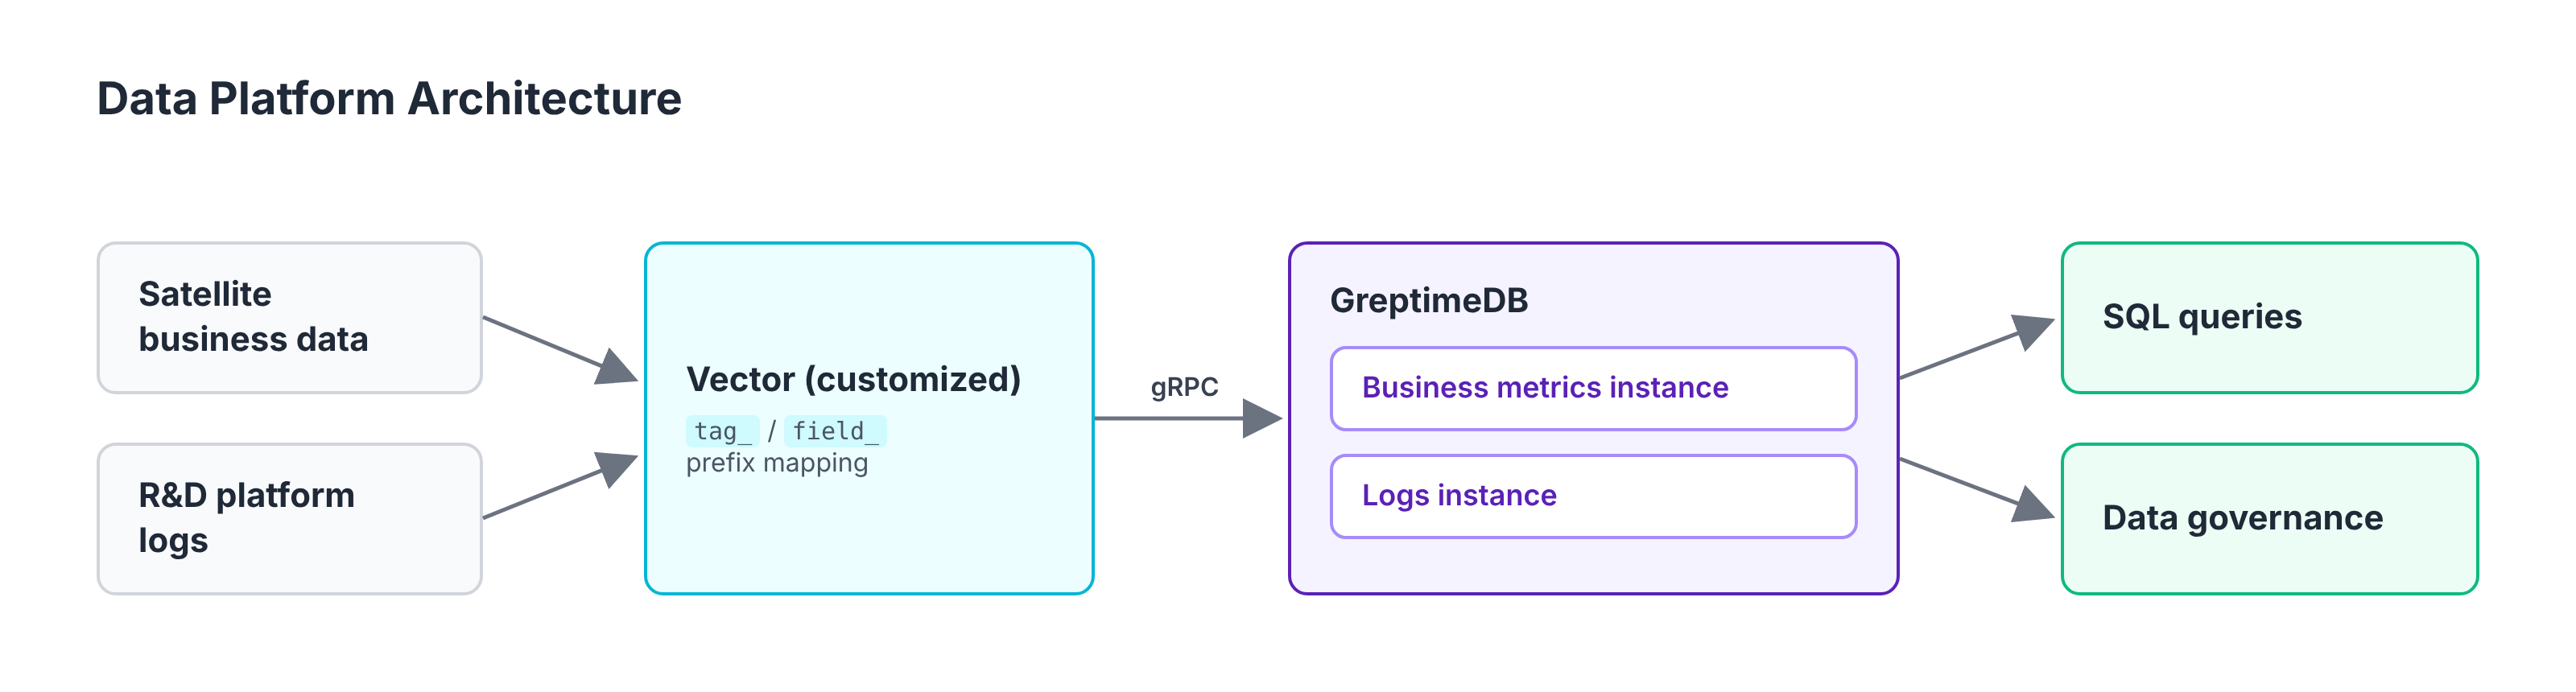
The modified Vector writes to GreptimeDB over the GreptimeDB gRPC protocol. Data is organized by database, and tables within a database share the same TTL. Data isolation and retention, previously handled by buckets, are now handled by databases plus TTL.
Data falls into two categories. Governed data kept for the long term, such as satellite business metrics and experiment results, is written to standardized tables according to platform-defined data contracts and schemas. For temporary experiment data, the sender specifies the table name; GreptimeDB creates the table on first write and adds columns when new fields appear. Fields such as temperature, voltage, and current reported by the same object end up in one time-indexed wide table. Adding a field does not require a table-creation request or waiting for the platform team to change the schema.
Queries use plain SQL:
sql
SELECT *
FROM experiment_xxx
WHERE ts BETWEEN '<start_time>' AND '<end_time>'
ORDER BY ts;
Engineers only need to know which table holds the data; they no longer need to understand measurements, buckets, or Flux.
On top of GreptimeDB, the platform team built a data governance layer that handles field naming conventions, tag/field identification, type validation, high-cardinality field control, data contracts, schema change records, data lineage, and data quality checks. GreptimeDB handles storage and queries; governance logic stays in the platform layer.
What's next
Satellite business metrics and logs currently sit in two separate instances. Once a shared correlation ID is added to both datasets, satellite state can be analyzed together with the corresponding logs. Application and infrastructure metrics, CI/CD metrics, traces, and simulation and test data will be onboarded over time, so that higher-level platforms for observability, experiment data, and data quality share the same storage and governance foundation.
The company's approach is to govern data whose shape is known and leave room to explore data whose shape is not. Since moving to GreptimeDB, engineers write data directly and query it with SQL, and the platform team spends its time on data standards and data quality instead of maintaining databases for individual projects.
This article is based on interviews with the company's product and engineering team. We thank them for their time.
Running into similar limits on InfluxDB?
GreptimeDB accepts writes in InfluxDB line protocol through both v1- and v2-compatible endpoints, so existing Telegraf agents and InfluxDB client libraries can write to GreptimeDB after a configuration change. The migration docs cover the steps, including exporting and importing historical data.
Further reading
- GreptimeDB vs. InfluxDB - Read and Write Performance Benchmark in Time-Series Databases: against InfluxDB v2, GreptimeDB delivers more than 2x write throughput and up to 11x faster heavy queries; at 1.1 billion rows, InfluxDB failed with
cache-max-memory-size exceededand could not complete ingestion. - GreptimeDB v1.2 vs InfluxDB 3.11: Read/Write Performance and Storage Footprint: GreptimeDB's write throughput is 1.49x InfluxDB 3.11 Core and 1.31x Enterprise; InfluxDB 3 Core ran out of memory on the groupby-orderby-limit and lastpoint queries.
- Migrating from InfluxDB to GreptimeDB: A Practical Guide


