Databases for Logs, Metrics & Traces in 2026: The Options Compared
Why the Storage Layer Decides Your Observability Stack
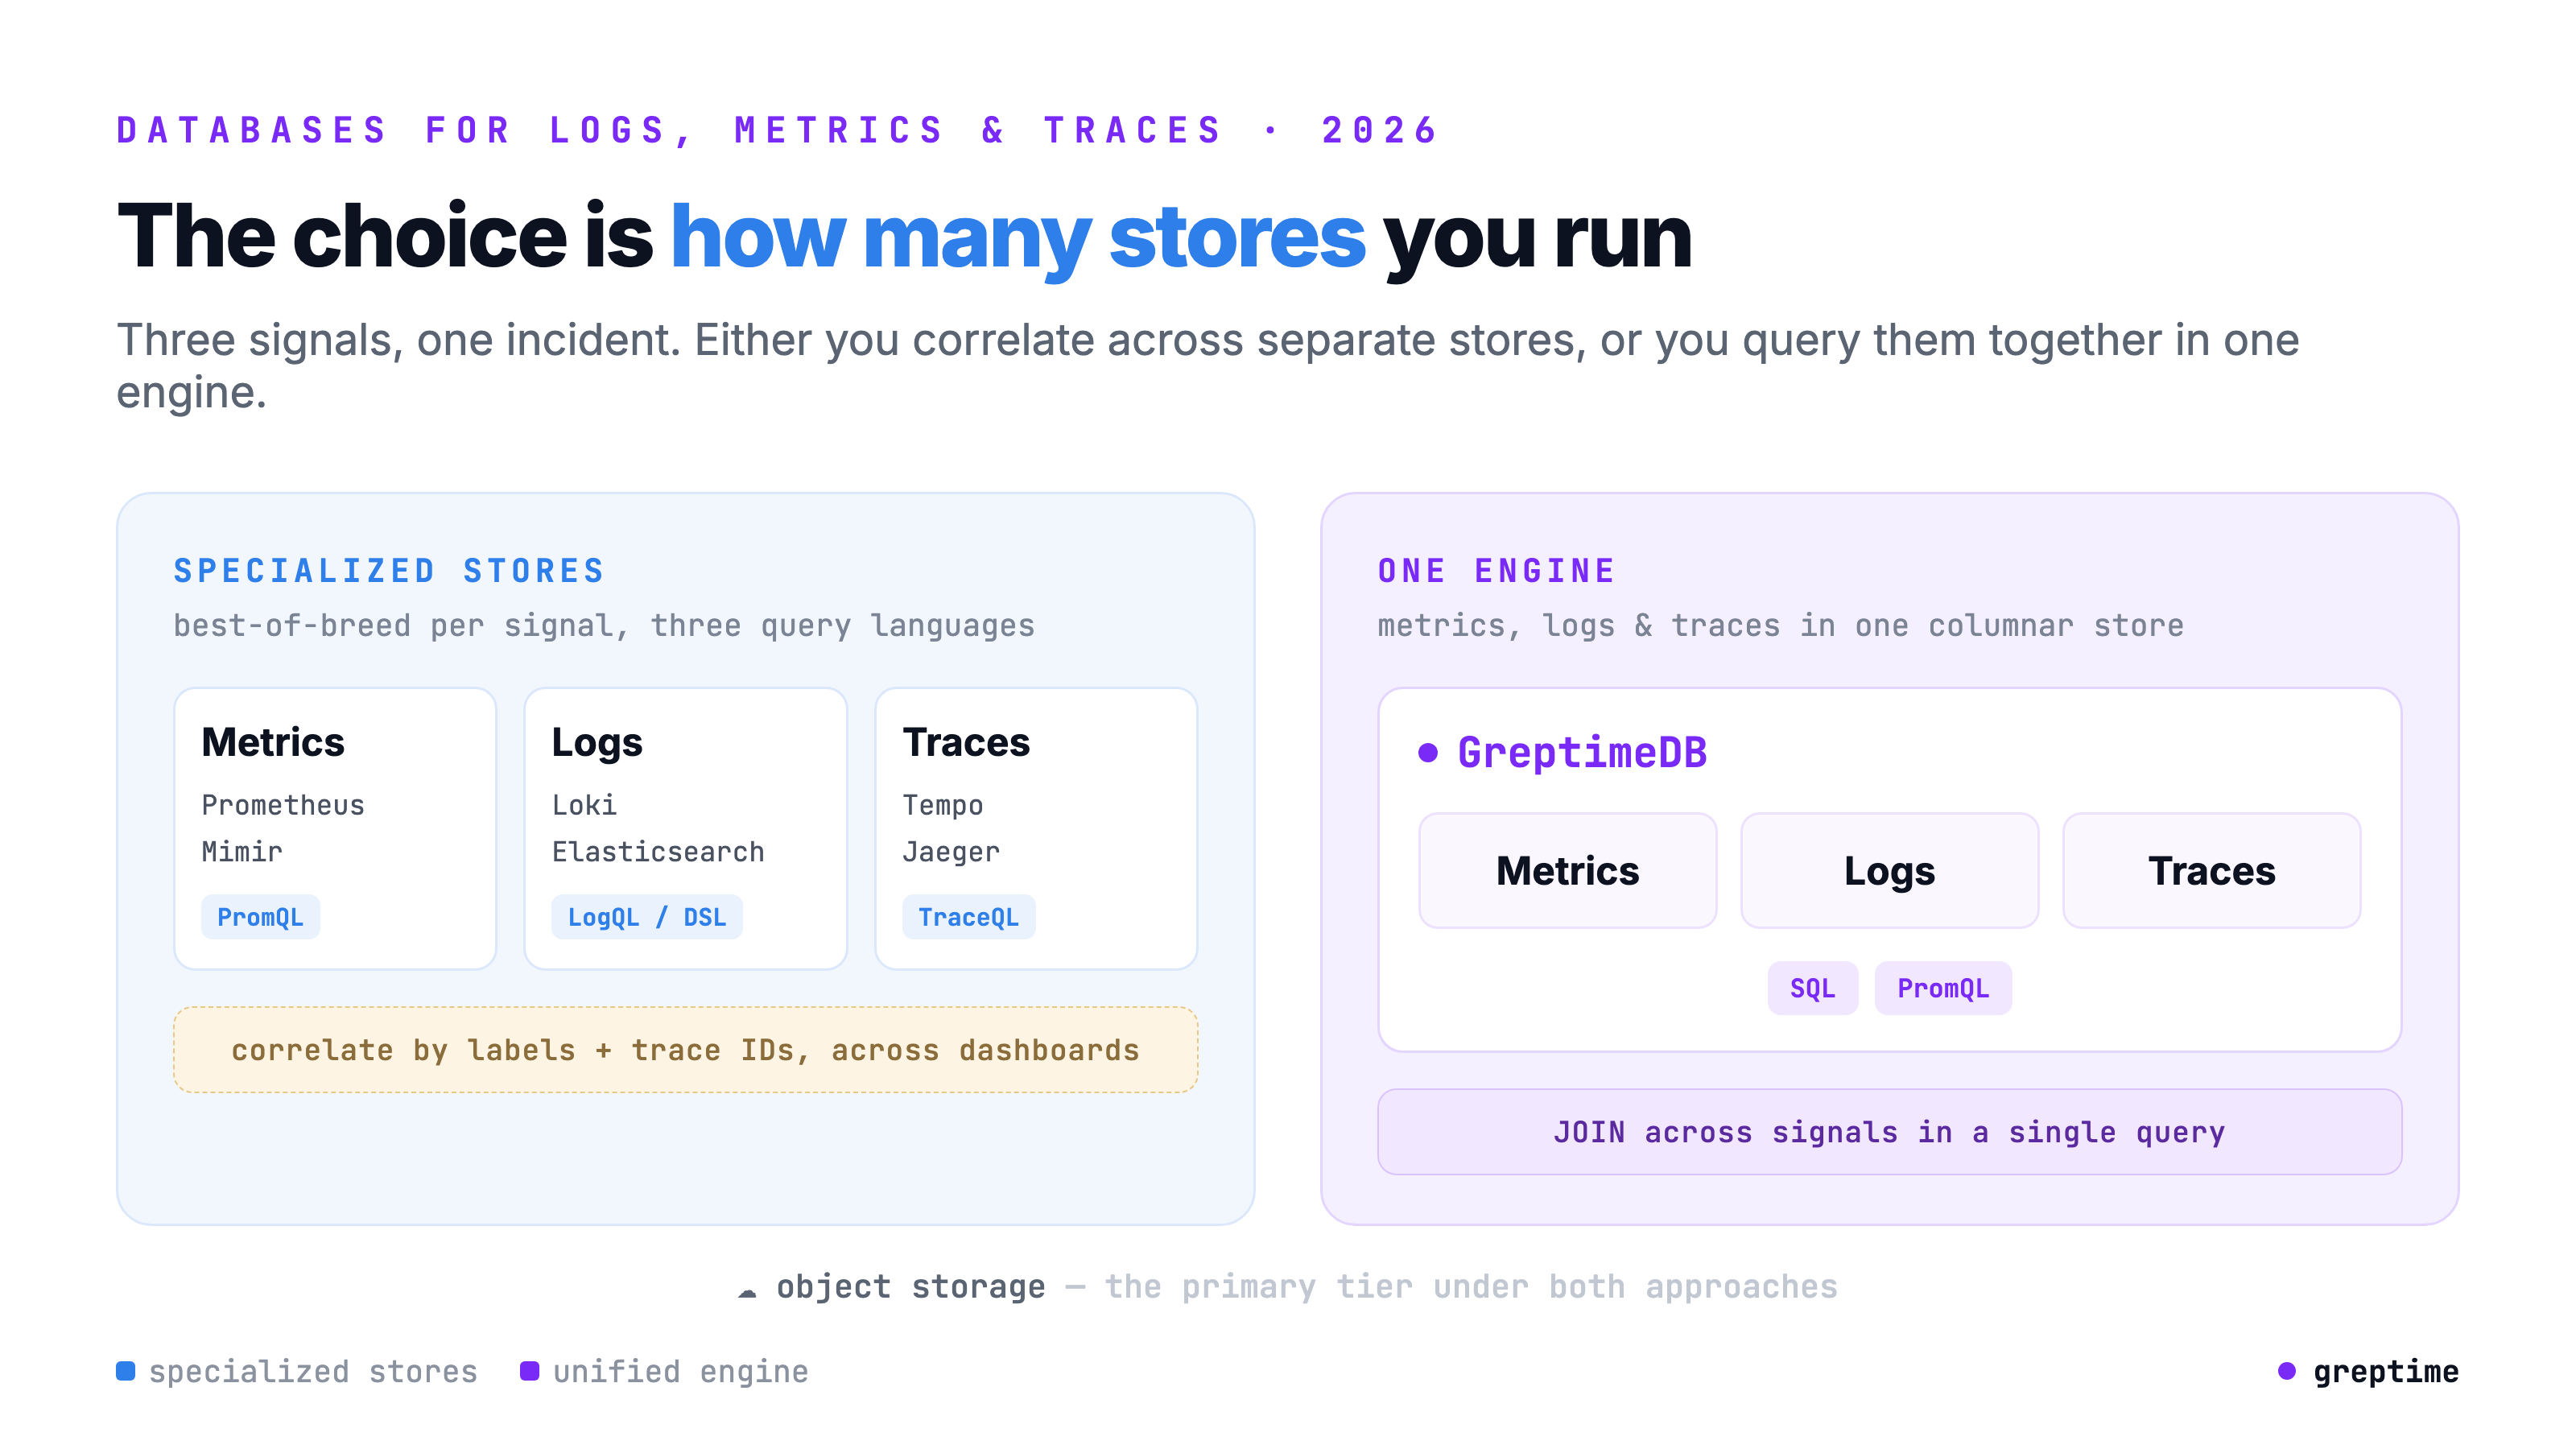
Logs, metrics, and traces are the three signals of observability, and for years the default was a separate database for each: Prometheus for metrics, Loki or Elasticsearch for logs, Tempo or Jaeger for traces. Each store has its own data model, its own query language, and its own scaling behavior. It works, but you end up running three systems, paying for three storage tiers, and correlating across them by copy-pasting timestamps and trace IDs between dashboards.
By 2026 the pressure to consolidate is real. A single incident spans all three signals: a latency spike (metric) leads to a slow span (trace) that points at an error (log). The value is in the correlation, not the isolated signal, and the database layer is where that correlation is either cheap or impossible. If the three signals live in one engine you can join them; if they live in three stores you can only line them up by eye.
This article compares the databases teams actually reach for when they want to store some or all three signals. GreptimeDB is our own project, so treat its spot at the top of the list as a stake in the ground, not a verdict. Every comparison below is factual, the numbers appear only where they trace to a published benchmark, and the "how to choose" section names the cases where the other options are the better call. This isn't a sponsored ranking.
What to Look For in an Observability Database
The criteria that separate these options:
- Unified vs. specialized. One engine for all three signals, or a best-of-breed store per signal? Unified cuts operational surface and enables cross-signal joins; specialized can be deeper in a single signal.
- Query languages. PromQL for existing dashboards and alerts, SQL for analytical queries, a trace API for span lookups. How many of your existing queries port over unchanged?
- Cardinality. Metrics and wide events explode the number of distinct series. Can the engine index and query millions of series without falling over?
- Full-text and structured logs. Logs need keyword search and structured filtering. Is there a real index, or a full scan?
- Scale-up vs scale-out. Growth past one node should be a scale-out, not a forklift. Does the engine add capacity by joining nodes to a cluster, or are you mostly buying a bigger box, and how painful is rebalancing when you do scale out?
- Object storage economics. S3/GCS/Azure as the primary tier is structurally cheaper than provisioned block storage, especially for high-volume logs and traces where retention cost dominates. Replication multiplies this: engines that store on local disk keep a full copy per replica, so retention cost scales with the replication factor, while object-storage-primary engines keep one shared copy and get durability from the object store.
- Ingestion compatibility. OpenTelemetry OTLP, Prometheus Remote Write, Loki push, Elasticsearch bulk, Jaeger. The more native protocols an engine speaks, the less of your collection pipeline you rewrite.
- Operational surface. How many components, data models, and failure modes are you signing up to run?
1. GreptimeDB
GreptimeDB is an open-source, cloud-native observability database written in Rust that stores metrics, logs, and traces in one engine. It ingests through OpenTelemetry OTLP, Prometheus Remote Write, Loki push, and Elasticsearch bulk, exposes the Jaeger query API for trace visualization, and lets you query data with SQL or PromQL.
Architecturally it disaggregates compute and storage: a stateless frontend handles ingest and query routing, datanodes handle region storage and execution, and data lands as Parquet on S3, GCS, Azure Blob, OSS, or MinIO with a multi-tier cache for hot reads. Because all three signals share one columnar engine, a single query can join metrics against logs without ETL between systems. Scaling out means adding stateless frontends and datanodes over the same object store, growing query and storage capacity independently rather than resizing one box; regions rebalance across datanodes automatically, and you can split or merge partitions online as data grows, so resharding isn't a forklift.
Pros
- One database replaces the metrics + logs + traces stack. OceanBase Cloud runs 80+ GreptimeDB clusters carrying 300 TB+ of logs and audit data, with storage cost down over 60% after migrating off Grafana Loki.
- Object storage as the primary tier. The product page cites up to 50× cost reduction versus typical multi-component observability stacks, driven by S3-class storage and columnar compression. The economics matter most when long retention meets high-volume logs or traces.
- Real log performance, not metrics-with-strings: against Loki on the same dataset, GreptimeDB delivers 1.5× higher ingestion (121k rows/s), 40–80× faster keyword search, and 50% less storage, holding 102k rows/s even when the backend is object storage.
- Built for high cardinality: the v1.0 default flat SST format delivers 4× write throughput and up to 10× faster queries on millions of series versus the previous layout in published tests.
- SQL and PromQL, now almost 100% compliant with upstream, so Prometheus dashboards and alerts keep working while SQL covers the analytical queries PromQL was never meant for.
Cons
- Younger than Elasticsearch or the Grafana stack, with a smaller ecosystem of third-party tooling and war stories.
- PromQL is highly compatible but not identical: the
@modifier is unsupported and computation runs at millisecond precision, so validate edge-case queries. - It's a storage and query engine, not a full observability UI. You bring Grafana or the built-in dashboard rather than a packaged APM product.
Best for: teams tired of running three stores who want one engine for all three signals, cross-signal joins in SQL, and object-storage cost, especially when trace volume is making the per-signal stack expensive.
2. ClickHouse
ClickHouse is a columnar OLAP database, not an observability product, but it has become a popular engine underneath observability platforms like SigNoz and Uptrace. It genuinely stores all three signals as wide columnar tables, with excellent compression and very high ingest throughput, queried in SQL.
Pros
- Mature, battle-tested columnar engine with strong compression and fast analytical scans over huge datasets.
- One SQL engine can hold metrics, logs, and traces as wide tables, and there's a real ecosystem (SigNoz, ClickStack) that packages an observability experience on top.
- Excellent for high-volume log and event analytics where SQL is the query model you want.
Cons
- No native PromQL, so Prometheus dashboards and alert rules don't port directly; you either adopt a platform that translates or rewrite in SQL.
- You engineer the observability layer yourself (schemas, materialized views, TTLs) unless you adopt SigNoz/ClickStack, and merge/part tuning is a real operational skill.
- Metrics ergonomics (native series model, PromQL semantics) are bolted on rather than first-class.
- High-cardinality metrics need careful primary-key and partition modeling to stay fast; it's tuning you own, not a default.
- Scaling out is manual: adding a shard doesn't rebalance existing data, so you move parts yourself or accept skew, and HA means running ReplicatedMergeTree with Keeper/ZooKeeper.
- In open-source ClickHouse each replica keeps a full copy on local disk, so retention cost scales with the replication factor; the fully compute-storage-separated engine (SharedMergeTree, with one shared copy on object storage) is ClickHouse Cloud only, and zero-copy replication in OSS is still experimental.
Best for: teams that already run ClickHouse for analytics, are comfortable in SQL, and either adopt SigNoz/ClickStack or are willing to build the observability layer themselves.
3. Elasticsearch
Elasticsearch is the search engine at the heart of the ELK stack, dominant for log search and strong for traces via Elastic APM. Its inverted index makes full-text search over logs excellent, and Kibana is a mature exploration UI.
Pros
- Best-in-class full-text log search and a huge, established ecosystem (Beats, Logstash, Kibana, APM).
- Traces are first-class through Elastic APM, so logs and traces live in one platform.
- Rich aggregations and a query language (ES|QL, Query DSL) many teams already know.
Cons
- The inverted index is storage-heavy and RAM-hungry; metrics at high cardinality are expensive, and cluster cost climbs fast at scale.
- Metrics are still less natural than logs and traces in the Elastic model: the documented query surface is Elastic's own stack (ES|QL, Query DSL, Kibana), not a Prometheus-compatible TSDB query path that lets existing PromQL dashboards and rules carry over directly.
- Operating a large Elasticsearch cluster (shards, heap, rebalancing) is a dedicated discipline; primary shard counts are fixed at index creation, so resharding means a
_split/_shrinkor a reindex, not a config change.
Best for: teams whose dominant workload is log search and who live in Kibana, with metrics handled elsewhere.
4. The Grafana Stack (Loki, Mimir, Tempo)
The Grafana LGTM stack is the best-of-breed answer: Loki for logs, Mimir for metrics, Tempo for traces, all visualized in Grafana. Each is object-storage-backed and purpose-built for its signal, with correlation through shared labels and exemplars.
Pros
- Each component is deep in its own signal and backed by object storage.
- Native, first-class integration with Grafana and label-and-exemplar correlation across signals in the UI.
- Loki's label-based indexing keeps log ingest cheap for high-volume, low-query workloads.
Cons
- Three separate systems, three data models, three sets of scaling and failure modes to operate.
- Correlation is by labels and links in Grafana, not database joins, so you can't
JOINa log against a metric in one query. - Loki's label-first index trades away flexible full-text query; metric-heavy Mimir is a microservices deployment of its own.
Best for: teams all-in on Grafana that want best-of-breed per signal and have the operational capacity to run three object-storage-backed systems.
5. InfluxDB
InfluxDB is a metrics-native time-series database. InfluxDB 3, rebuilt on Rust, Apache Arrow, Parquet, and DataFusion, moved to object storage and SQL alongside InfluxQL, and is broadening beyond pure metrics toward events.
Pros
- Mature, widely adopted TSDB with a strong metrics and IoT heritage and the line-protocol ecosystem (Telegraf).
- InfluxDB 3's Arrow/Parquet/object-storage foundation modernized the storage and query engine, though the open-source v3 Core build is single-node and tuned for recent data — clustering and unlimited historical retention are in the Enterprise/Cloud tiers.
- SQL support in v3 opens up analytical queries beyond the older InfluxQL/Flux models.
Cons
- Primarily metrics and events; logs and traces are not first-class signals the way they are in a unified observability engine.
- Ecosystem fragmentation across 1.x, 2.x, and 3.x, with Flux deprecated, complicates version choices and migrations.
- No native PromQL; existing Prometheus dashboards don't carry over directly.
- The open-source edition runs single-node; horizontal clustering and high availability are commercial (Enterprise/Cloud) features.
Best for: metrics- and IoT-centric teams with existing line-protocol/InfluxQL investment who don't need logs and traces in the same database.
6. Victoria Stack
The Victoria stack centers on VictoriaMetrics, a purpose-built time-series database known for efficiency and a low resource footprint, extended by VictoriaLogs and VictoriaTraces into a per-signal family. Metrics use MetricsQL, logs use LogsQL.
Pros
- Very efficient ingest and compression with a light resource footprint; a single-binary option makes the metrics tier simple to start.
- Handles high-cardinality metrics well and is straightforward to operate at modest scale.
- The cluster scales out cleanly: vmselect aggregates across all vmstorage nodes at query time, so adding a node needs no data reshuffle — new data spreads to include it and old data ages out under retention.
- The ecosystem now spans all three signals as separate, focused products.
Cons
- Three products with three query languages (MetricsQL, LogsQL, and traces on top) rather than one engine and one language.
- MetricsQL is close to PromQL but not identical, and the open-source cluster stores on local block storage rather than object storage as the primary tier. The local-disk design is a deliberate choice for very-low-latency hot queries, not a missing feature, but it means retention cost tracks provisioned disk (and its replication factor) rather than object-storage pricing.
- VictoriaTraces is the newest and least mature piece of the set.
Best for: efficiency-focused, metrics-primary teams that want a light footprint and are fine running separate products per signal.
Quick Comparison
| Database | Signals | Model | Query languages | Primary storage | Scaling | Cross-signal join |
|---|---|---|---|---|---|---|
| GreptimeDB | Metrics, logs, traces | One engine | PromQL + SQL | Object storage | Out, online repartition | Yes (SQL) |
| ClickHouse | Metrics, logs, traces | One engine (DIY / SigNoz) | SQL | Local or object storage | Up + out, manual resharding | Yes (SQL) |
| Elasticsearch | Logs, traces (+ metrics) | One engine | Query DSL / ES|QL | Local block storage | Out, split/reindex to reshard | Within platform |
| Grafana stack | Metrics, logs, traces | Three systems | PromQL + LogQL + TraceQL | Object storage | Out, per component | Labels/exemplars only |
| InfluxDB | Metrics (+ events) | One engine | SQL + InfluxQL | Object storage (v3) | Up; out needs Enterprise | Limited |
| Victoria Stack | Metrics, logs, traces | Three products | MetricsQL + LogsQL | Local block storage | Out, no reshuffle on add | No |
How to Choose
Log search is the dominant workload. If your team lives in full-text log search and Kibana, Elasticsearch is deepest there, and Elastic APM brings traces into the same platform. The cost is storage weight and weak metrics.
You're all-in on Grafana and want best-of-breed. The Loki/Mimir/Tempo stack gives each signal a purpose-built store with native Grafana correlation. Adopt it when per-signal depth and Grafana integration outweigh the cost of operating three systems.
You already run ClickHouse or want SQL-only. ClickHouse is an excellent columnar engine for all three signals, especially via SigNoz or ClickStack. It's the pragmatic choice when SQL is your query model and you'll either adopt a platform or build the observability layer.
Metrics are the whole job. InfluxDB and VictoriaMetrics are both strong, efficient metrics engines. Pick them when logs and traces don't need to share the database and a metrics-first TSDB fits.
You want one engine for all three signals. GreptimeDB is the strongest fit when running three stores has become the problem: when you want to join logs against metrics in SQL, keep Prometheus dashboards working through PromQL, and put trace volume on object storage to control cost. The trade-off is a younger ecosystem and a few PromQL edge cases.
The honest summary: the specialized stores win when one signal dominates and per-signal depth is worth the operational weight of running several systems. The unified engines win when correlation across signals, a single operational surface, or object-storage cost has become the thing you're actually trying to fix.
If GreptimeDB fits the shortlist, the unified observability write-up covers the single-engine architecture, and the Loki performance report walks through the log benchmark in full.
About Greptime
GreptimeDB is an open-source, cloud-native database purpose-built for real-time observability. Built in Rust and optimized for cloud-native environments, it provides unified storage and processing for metrics, logs, and traces, delivering sub-second insights from edge to cloud at any scale.
- GreptimeDB OSS: the open-source database for observability and IoT workloads, with compute-storage disaggregation and object storage as the primary tier.
- GreptimeDB Enterprise: adds operational features for production scale, including bulk ingestion, auto-repartition, read replicas, LDAP/RBAC, a management console, and expert support.
Stay in the loop
Join our community
Get the latest updates and discuss with other users.


