When optimizing the write performance of GreptimeDB v0.7, we discovered through flame graphs that the CPU time spent parsing Prometheus write requests accounted for about 12% of the total. In comparison, the CPU time spent on protocol parsing by VictoriaMetrics, which is implemented in Go, is only around 5%. This forced us to start considering optimizing the overhead of the protocol conversion layer.
To simplify the discussion, all the test code is stored in the GitHub repository https://github.com/v0y4g3r/prom-write-request-bench.
git clone https://github.com/v0y4g3r/prom-write-request-bench
cd prom-write-request-bench
export PROJECT_ROOT=$(pwd)
Optimizing the overhead of the protocol conversion layer
Step 1: Reproduce the cases
First, let's set up the baseline using a minimal reproducible benchmark. Corresponding branch:
git checkout step1/reproduceRust-related benchmark code(benches/prom_decode.rs):
fn bench_decode_prom_request(c: &mut Criterion) {
    let mut d = std::path::PathBuf::from(env!("CARGO_MANIFEST_DIR"));
    d.push("assets");
    d.push("1709380533560664458.data");
    let data = Bytes::from(std::fs::read(d).unwrap());
    let mut request_pooled = WriteRequest::default();
    c.benchmark_group("decode")
        .bench_function("write_request", |b| {
            b.iter(|| {
                let mut request = WriteRequest::default();
                let data = data.clone();
                request.merge(data).unwrap();
            });
        });
}
Run the benchmark command multiple times:
cargo bench -- decode/write_requestTo receive the baseline result:
decode/write_request
time:   [7.3174 ms 7.3274 ms 7.3380 ms]
change: [+128.55% +129.11% +129.65%] (p = 0.00 < 0.05)
Pull the VictoriaMetrics code in the current directory to set up a Go performance testing environment:
git clone  https://github.com/VictoriaMetrics/VictoriaMetrics
cd VictoriaMetrics
cat <<EOF > ./lib/prompb/prom_decode_bench_test.go
package prompb

import (
        "io/ioutil"
        "testing"
)

func BenchmarkDecodeWriteRequest(b *testing.B) {
        data, _ := ioutil.ReadFile("${PROJECT_ROOT}/assets/1709380533560664458.data")
        wr := &WriteRequest{}
        for n := 0; n < b.N; n++ {
                b.StartTimer()
                wr.Reset()
                err := wr.UnmarshalProtobuf(data)
                if err != nil {
                        panic("failed to unmarshall")
                }
                b.StopTimer()
        }
}
EOF

go test github.com/VictoriaMetrics/VictoriaMetrics/lib/prompb --bench BenchmarkDecodeWriteRequest
The data file path points to the
1709380533560664458.datafile located in theassetsdirectory of theprom-write-request-benchrepository.
The outputs are as follows:
goos: linux
goarch: amd64
pkg: github.com/VictoriaMetrics/VictoriaMetrics/lib/prompb
cpu: AMD Ryzen 7 7735HS with Radeon Graphics
BenchmarkDecodeWriteRequest-16               961           1196101 ns/op
PASS
ok      github.com/VictoriaMetrics/VictoriaMetrics/lib/prompb   1.328s
You can see that Rust takes about 7.3ms to parse a Prometheus write request with 10,000 timelines, while the Go version by VictoriaMetrics only takes 1.2ms, which is only 1/6 of the Rust version's time.
Note
Though you may notice that despite all the efforts below, the Go version still outperforms Rust version. That's the tradeoff between code maintainability and performance. If we replace all Bytes with &[u8], then the Rust version can reach the same performance. It is also worth noting that VictoriaMetrics team made great effort in optimizing Protobuf performance using techniques like object pooling and they even created easyproto to replace the official Protobuf implementation.
Here, you might have quickly spotted the issue: In the Go version, each deserialization uses the same WriteRequest structure, merely performing a reset before deserialization to avoid data contamination. In contrast, Rust uses a new structure for each deserialization.
This is one of the optimizations VictoriaMetrics has made for write performance VictoriaMetrics heavily leverages the pooling technique (as in sync.Pool) in its write path to reduce the cost of garbage collection. If the Go version builds a new structure for each deserialization like Rust, then the time consumed would increase to about 10ms, worse than the Rust result mentioned above.
So, can a similar pooling technique be used in the Rust version? We can conduct a simple experiment: pooled_write_request.
The logic of the test is similar to the Go version:
let mut request_pooled = WriteRequest::default();
c.bench_function("pooled_write_request", |b| {
    b.iter(|| {
        let data = data.clone();
        request_pooled.clear();
        request_pooled.merge(data).unwrap();
    });
});
Execute:
cargo bench -- decode/pooled_write_requestThe result is as follows:
decode/pooled_write_request
time:   [7.1445 ms 7.1645 ms 7.1883 ms]
It appears that there isn't a significant performance improvement. So, why is that?
Performance Review So Far:
- Rust baseline time: 7.3ms
- Go parsing time: 1.2ms
- Rust current time: 7.1ms
Step 2: Adopt RepeatedField to reduced the processing time in Rust
Corresponding branch:
git checkout step2/repeated_fieldTo answer the question above, let's take a look at the data structure of Prometheus's WriteRequest:
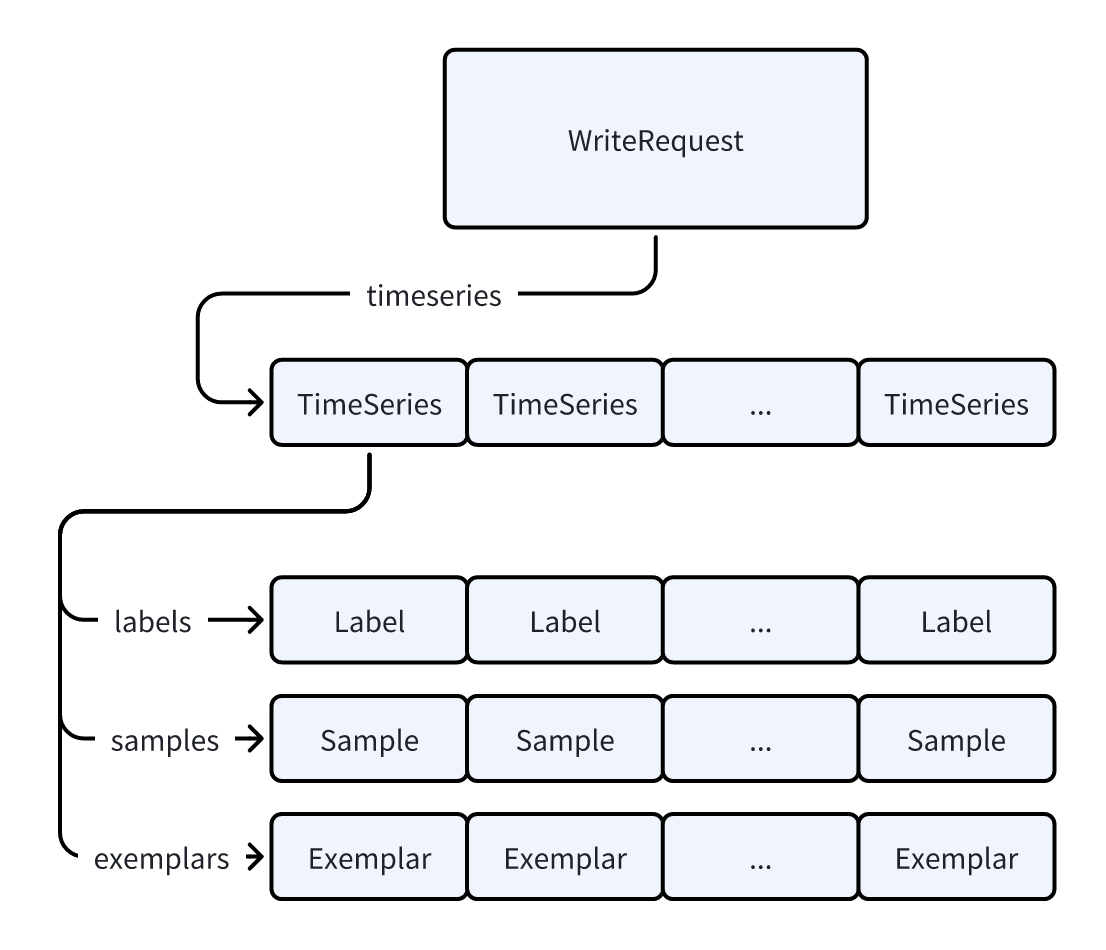
The WriteRequest contains a vector of TimeSeries, and each TimeSeries in turn holds vectors of Label, Sample, and Exemplar. If we only reuse the outermost WriteRequest, every time we clear it, the vectors for Labels, Samples, and Exemplars will also be cleared, and thus we fail to reuse the inner struct.
What about Go? Let's take a look at the Reset method of WriteRequest:
wr.Timeseries = tss[:0]Rather than setting the TimeSeries field to nil, the Go version sets it to an empty slice. This means the original elements within the slice are still retained and not garbage collected (only the len field is set to 0), hence Go's object reuse mechanism can effectively avoid repeated memory allocations.
Could Rust adopt a similar mechanism?
Here we come to a mechanism called RepeatedField from another popular Protobuf library in the Rust ecosystem, rust-protobuf v2.x.
It's designed to avoid the drop overhead from Vec::clear by manually maintaining the vec and len fields. When clearing, it only sets len to 0 without calling clear from vec, thereby ensuring the elements inside the vec and the vecs within those elements are not dropped.
Then, the question arises: How can we integrate the RepeatedField mechanism into PROST? Obviously, PROST does not have a similar configuration option, so we need to manually expand the code generated by PROST's procedural macros.
During this process, we found that some fields are currently not needed in the writing process so that we can skip them.
cargo bench -- decode/pooled_write_requestdecode/pooled_write_request
time: [2.6941 ms 2.7004 ms 2.7068 ms]
change: [-66.969% -66.417% -65.965%] (p = 0.00 < 0.05)
Performance has improved.Wow! By using the RepeatedField mechanism, we successfully reduced the processing time to about 36% of the original.
But can this time be further reduced, and what other things can we learn from Go's code?
It's worth mentioning that, since
RepeatedFieldis not as convenient to use asVec, version 3.x of rust-protobuf has removed it. However, the author also mentioned that there might be an option to addRepeatedFieldback in the future.
Performance Review So Far:
- Rust baseline time: 7.3ms
- Go parsing time: 1.2ms
- Rust current time: 2.7ms
Step 3: String or Bytes?
Corresponding branch:
git checkout step3/bytesIn Go, a string is just a simple wrapper around []byte, and deserializing a string field can be done by simply assigning the original buffer's pointer and length to the string field. However, Rust's PROST, when deserializing String type fields, needs to copy the data from the original buffer into the String, ensuring that the lifecycle of the deserialized structure is independent of the original buffer. However, this introduces an additional overhead of data copying.
So could we change the Label fields to Bytes instead of String? I recall that there's a Config::bytes option in PROST_build. In this PR for PROST, support was added to generate fields of bytes type as Bytes instead of the default Vec<u8>, thus enabling zero-copy parsing.
We could similarly change the types of Label's name and value fields to Bytes. The advantage of this is that it eliminates the need for copying, but the problem is also clear: where Label is needed to use, Bytes must still be converted to String. In this conversion step, we could choose to use String::from_utf8_unchecked to skip the string valid check to further improving performance.
Of course, if a GreptimeDB instance is exposed to the public internet, such an operation is clearly unsafe. Therefore, in #3435, we mentioned the need to add a strict mode to verify the legality of the strings.
After modifying the types of Label::name and Label::value, we run the test again:
cargo bench -- decode/pooled_write_requestHere comes the result:
decode/pooled_write_request
time:   [3.4295 ms 3.4315 ms 3.4336 ms]
change: [+26.763% +27.076% +27.383%] (p = 0.00 < 0.05)
Performance has regressed.
Wait. Why did the performance get even worse? Let's generate a flame graph to better understand the underlying issues.
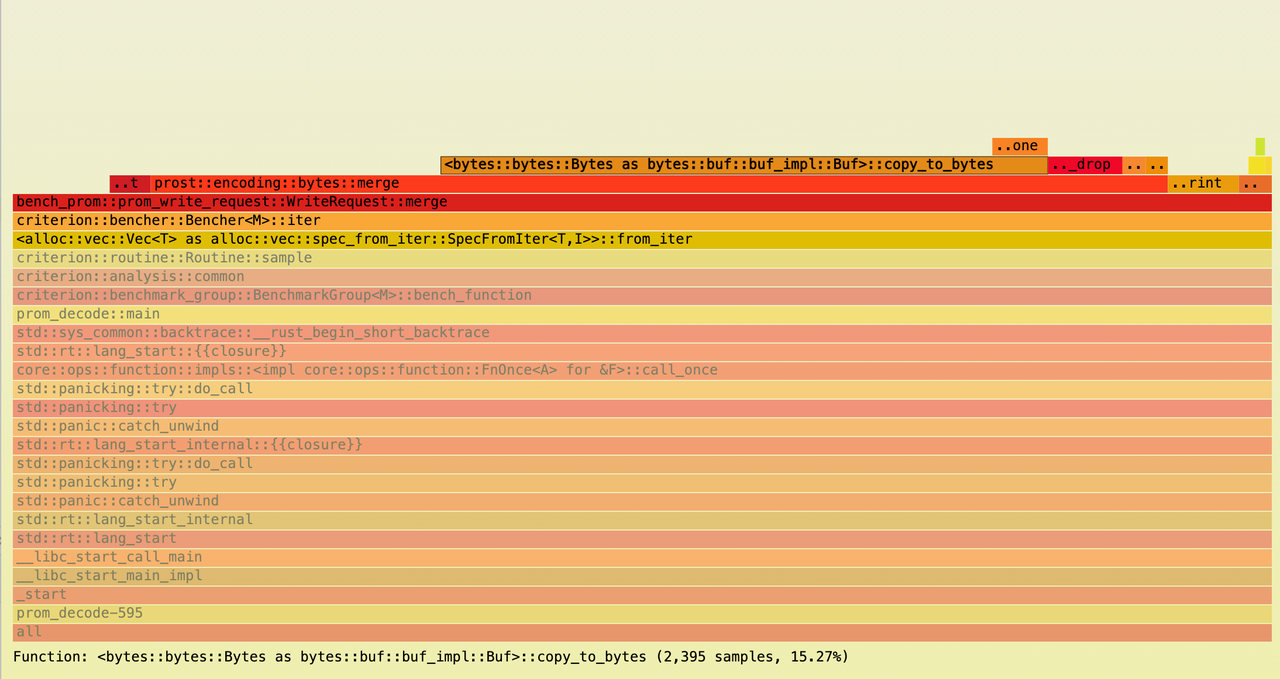
It's apparent that the majority of CPU time is being spent on copy_to_bytes. From the code in PROST for parsing Bytes fields, we can see the following:
pub fn merge<A, B>(
    wire_type: WireType,
    value: &mut A,
    buf: &mut B,
    _ctx: DecodeContext,
) -> Result<(), DecodeError>
where
    A: BytesAdapter,
    B: Buf,
{
    check_wire_type(WireType::LengthDelimited, wire_type)?;
    let len = decode_varint(buf)?;
    if len > buf.remaining() as u64 {
        return Err(DecodeError::new("buffer underflow"));
    }
    let len = len as usize;
    //...
    value.replace_with(buf.copy_to_bytes(len));
    Ok(())
}impl sealed::BytesAdapter for Bytes {
fn replace_with<B>(&mut self, mut buf: B)
where
B: Buf,
{
*self = buf.copy_to_bytes(buf.remaining());
}
}Could we eliminate one copy operation? Although Bytes::copy_to_bytes doesn't involve actual data copying but rather pointer operations, its overhead is still considerable.
Performance Review So Far:
- Rust baseline time: 7.3ms
- Go parsing time: 1.2ms
- Rust current time: 3.4ms
Step 4: Eliminate One Copy
Corresponding branch:
git checkout step4/bytes-eliminate-one-copySince we parse Prometheus's WriteRequest from Bytes, we can directly specialize the generic parameter B: Buf to Bytes. This way, PROST::encoding::bytes::merge becomes the following merge_bytes method:
#[inline(always)]
fn copy_to_bytes(data: &mut Bytes, len: usize) -> Bytes {
    if len == data.remaining() {
        std::mem::replace(data, Bytes::new())
    } else {
        let ret = data.slice(0..len);
        data.advance(len);
        ret
    }
}

pub fn merge_bytes(value: &mut Bytes, buf: &mut Bytes) -> Result<(), DecodeError> {
    let len = decode_varint(buf)?;
    if len > buf.remaining() as u64 {
        return Err(DecodeError::new(format!(
            "buffer underflow, len: {}, remaining: {}",
            len,
            buf.remaining()
        )));
    }
    *value = copy_to_bytes(buf, len as usize);
    Ok(())
}
After making the replacement, run the benchmark again:
cargo bench -- decode/pooled_write_requestThe results are as follows:
decode/pooled_write_request
time:   [2.7597 ms 2.7630 ms 2.7670 ms]
change: [-19.582% -19.483% -19.360%] (p = 0.00 < 0.05)
Performance has improved.
We can see that there's improvement, but not much. It seems we've only returned to the performance level we had just achieved. So, can we go even further?
Performance Review So Far:
- Rust baseline time: 7.3ms
- Go parsing time: 1.2ms
- Rust current time: 2.76ms
Step 5: Why is Bytes::slice So Slow?
Corresponding branch:
git checkout step5/bench-bytes-sliceThe primary reason is that PROST's field trait bound is BytesAdapter, while the trait bound for the deserialized Bytes is Buf. Although Bytes implements both traits, if you want to assign one type to another, you need to go through the copy_to_bytes process twice to convert it. In the merge method, because the actual type of Buf is unknown, it first needs to convert Buf into Bytes using Buf::copy_to_bytes. Then, it passes Bytes to BytesAdapter::replace_with, where it again uses <<Bytes as Buf>>::copy_to_bytes to convert Buf into Bytes. Finally, we get the specific type that implements BytesAdapter: Bytes.

From the perspective of PROST, Bytes::copy_to_bytes does not involve copying data, so it can be considered a zero-copy operation. However, the overhead of this zero-copy operation is not that low.
Let's do a simple test to verify:
c.benchmark_group("slice").bench_function("bytes", |b| {
    let mut data = data.clone();
    b.iter(|| {
        let mut bytes = data.clone();
        for _ in 0..10000 {
            bytes = black_box(bytes.slice(0..1));
        }
    });
});func BenchmarkBytesSlice(b *testing.B) {
data, _ := ioutil.ReadFile("<any binary file>")
for n := 0; n < b.N; n++ {
b.StartTimer()
bytes := data
for i :=0; i < 10000; i++ {
bytes = bytes[:1]
}
b.StopTimer()
}
}The execution time in Go is 2.93 microseconds, whereas in Rust, it is 103.31 microseconds:
goos: linux
goarch: amd64
pkg: github.com/VictoriaMetrics/VictoriaMetrics/lib/prompb
cpu: AMD Ryzen 7 7735HS with Radeon Graphics
BenchmarkBytesSlice-16            497607              2930 ns/op
PASS
ok github.com/VictoriaMetrics/VictoriaMetrics/lib/prompb 6.771sslice/bytes
time: [103.23 µs 103.31 µs 103.40 µs]
change: [+7.6697% +7.8029% +7.9374%] (p = 0.00 < 0.05)It can be observed that the slice operation in Rust is two orders of magnitude slower than in Go.
Go's slice only includes three fields: ptr, cap, and len. Its slice operation involves only modifications to these three variables.
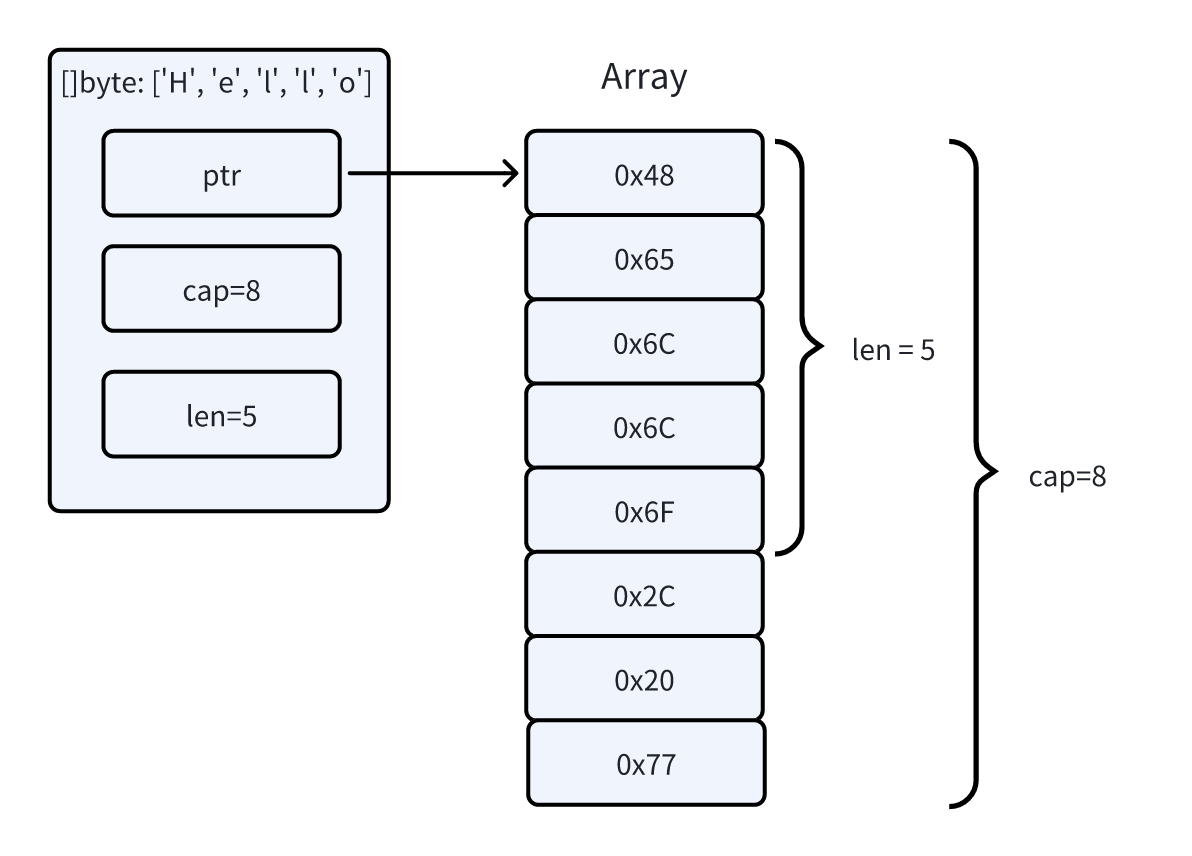
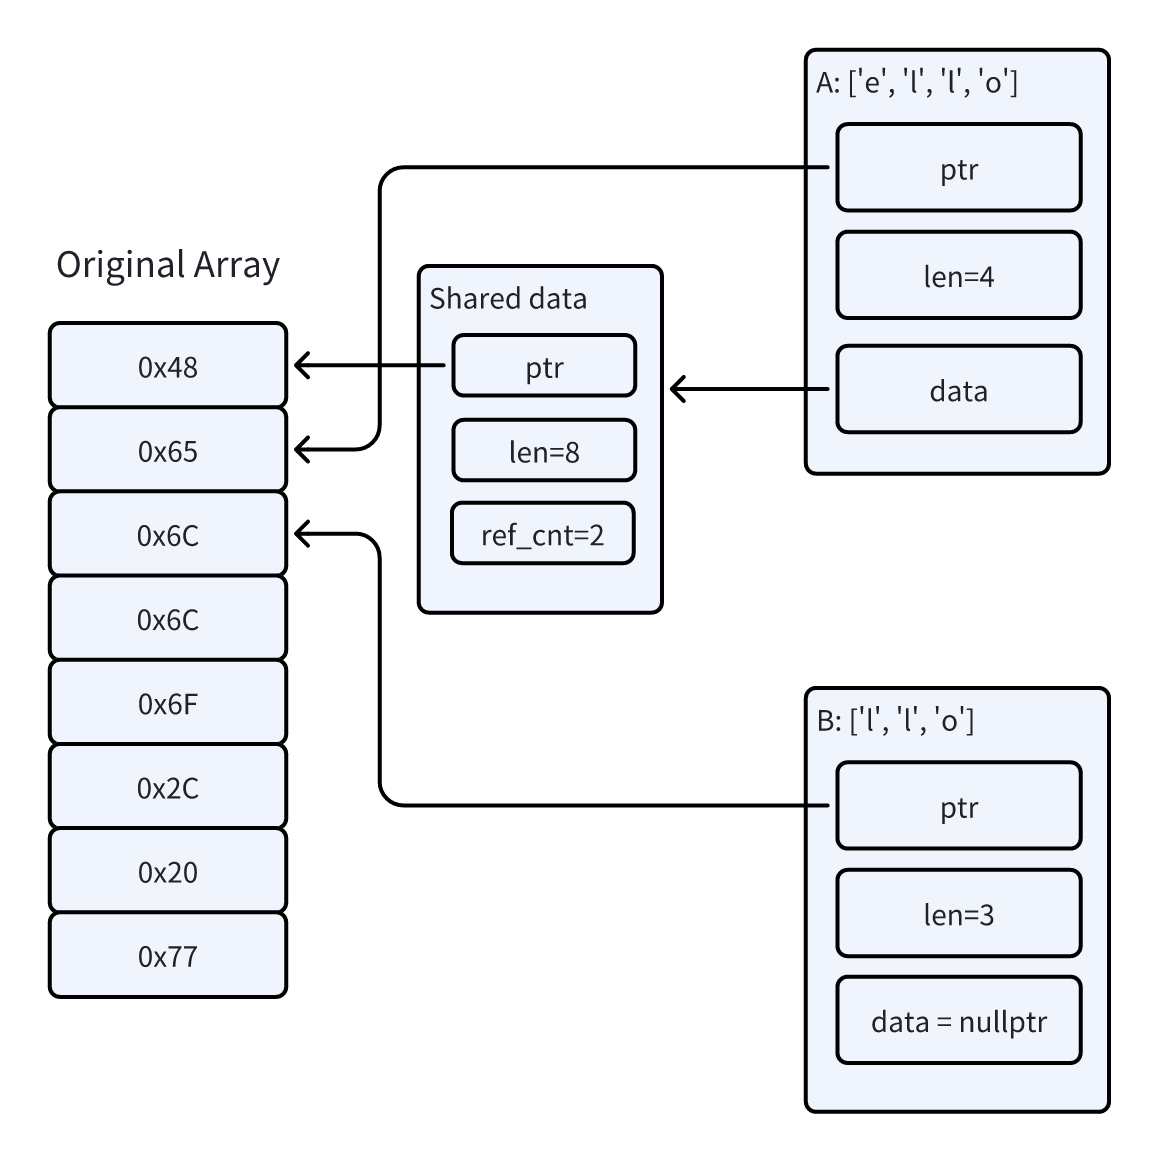
In Rust, to ensure memory safety, the output of deserialization (WriteRequest) must be independent with the lifecycle of the input data (Bytes). To avoid data copying, Bytes employs a reference counting mechanism.
As illustrated below, two Bytes instances, A and B, fundamentally point to the same underlying memory area. However, each also has a data pointer pointing to a structure that holds the reference count information. The original memory array is only dropped when the reference count reaches zero. While this approach avoids copying, it also incurs some overhead.
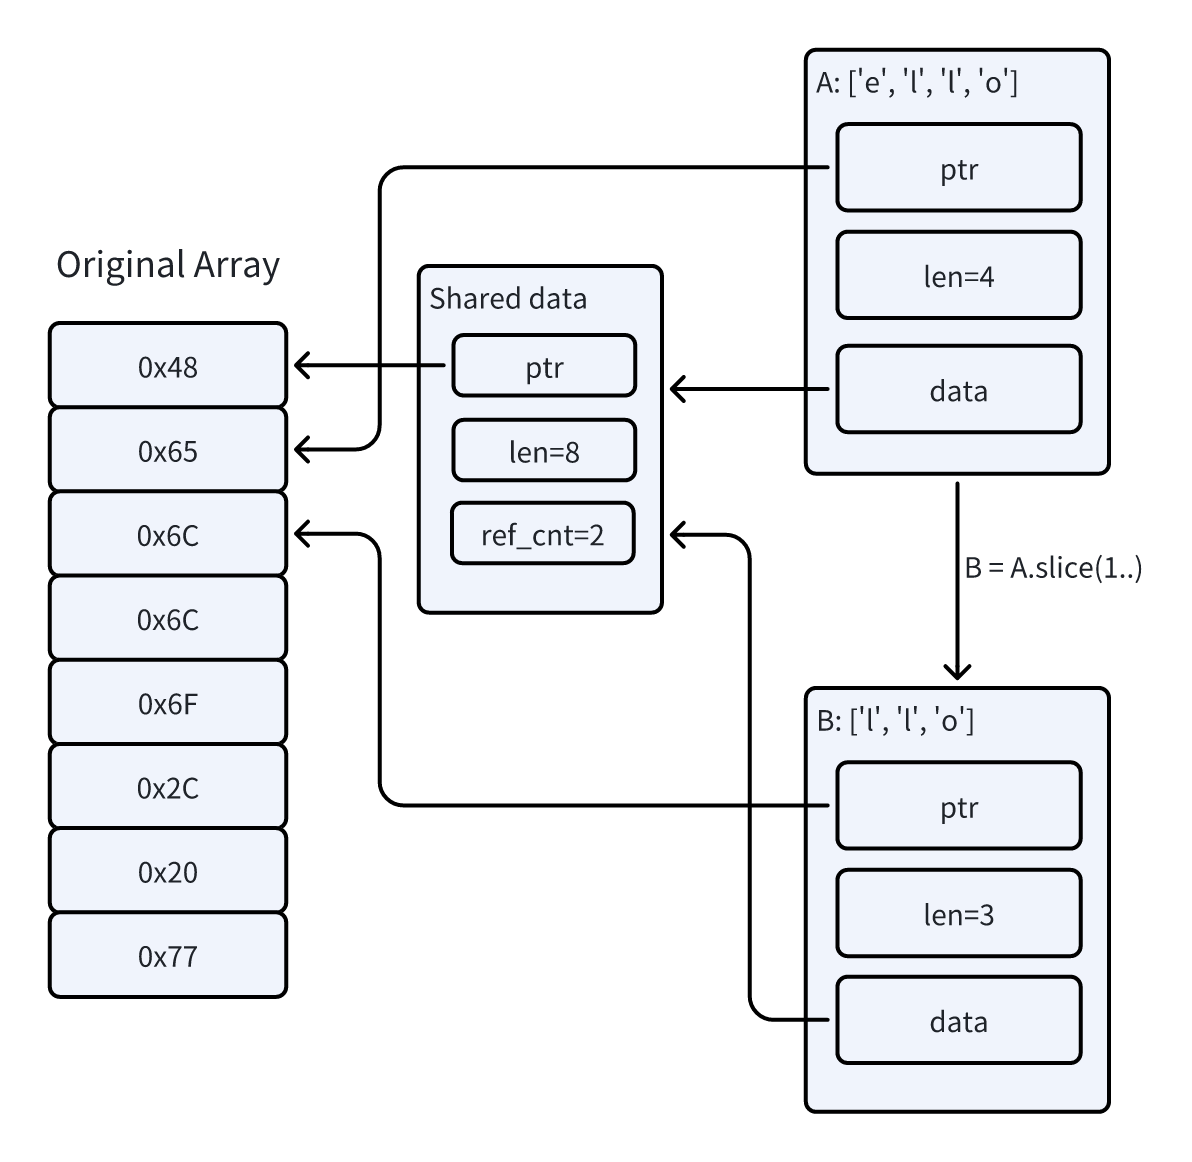
The slice operation for
Bytesinstances created viaFrom<Vec<u8>>is based on reference counting. Each slicing requires copying the original buffer's pointer, length, reference count, and the pointer and length of the slice's return value, etc. Compared to Go's garbage collection, which is based on reachability analysis, the efficiency is undoubtedly much lower.Since Bytes supports multiple implementations, certain methods (such as clone) rely on vtable for dynamic dispatch.
To ensure the safety of slice operations, Bytes manually inserts bounds checks in many places.
Step6: A little bit unsafe
Corresponding branch:
git checkout step6/optimize-sliceIs there a way to optimize the overhead further?
A distinctive feature of the write interface in GreptimeDB is that once a WriteRequest is parsed, it will be immediately transformed into GreptimeDB's own data structures instead of directly using the WriteRequest. This means the lifespan of the deserialized input Bytes is always longer than that of the parsed structure.
Therefore, we can make some hacky modifications to the slice operation, directly assembling the returned Bytes using the original array's pointer and length. In this way, as long as the original A instance remains alive, all Bytes instances sliced from it will point to valid memory.

We replace the data.slice(..len) operation with the following split_to method:
pub fn split_to(buf: &mut Bytes, end: usize) -> Bytes {
let len = buf.len();
assert!(
end <= len,
"range end out of bounds: {:?} <= {:?}",
end,
len,
);
if end == 0 {
return Bytes::new();
}
let ptr = buf.as_ptr();
let x = unsafe { slice::from_raw_parts(ptr, end) };
// `Bytes::drop` does nothing when it's built via `from_static`.
Bytes::from_static(x)
}
// benchmark
c.bench_function("split_to", |b| {
let data = data.clone();
b.iter(|| {
let mut bytes = data.clone();
for _ in 0..10000 {
bytes = black_box(unsafe { split_to(&bytes, 1) });
}
});
})Let's benchmark it again to see the result:
slice/bytes
time:   [103.23 µs 103.31 µs 103.40 µs]
change: [+7.6697% +7.8029% +7.9374%] (p = 0.00 < 0.05)
slice/split_to
time: [24.061 µs 24.089 µs 24.114 µs]
change: [+0.2058% +0.4198% +0.6371%] (p = 0.00 < 0.05)Time consumption dropped considerably from 103us to 24us. Now, what about the overall overhead of deserialization?
decode/pooled_write_request
time:   [1.6169 ms 1.6181 ms 1.6193 ms]
change: [-37.960% -37.887% -37.815%] (p = 0.00 < 0.05)
Performance has improved.
Finally, we have managed to reduce the time it takes to parse a single WriteRequest to about 1.6ms, which is only 33.3% slower than Go's 1.2ms!
Of course, there is still room for optimization. If we completely abandon Bytes and use Rust's slices (&[u8]), we can achieve performance close to Go's (considering only the overhead of slicing):
c.bench_function("slice", |b| {
    let data = data.clone();
    let mut slice = data.as_ref();
    b.iter(move || {
        for _ in 0..10000 {
            slice = black_box(&slice[..1]);
        }
    });
});
The corresponding result is as follows:
slice/slice
time:   [4.6192 µs 4.7333 µs 4.8739 µs]
change: [+6.1294% +9.8655% +13.739%] (p = 0.00 < 0.05)
Performance has regressed.
However, since this part of the overhead already constitutes a very low proportion of the entire write pathway, further optimization would not significantly affect the overall throughput.
If you are interested, you can also try to refactor the deserialization code using slices, and we'd be happy if you shared your experience with us.
Performance Review So Far:
- Rust baseline duration: 7.3ms
- Go parsing duration: 1.2ms
- Rust current duration: 1.62ms
Summary
In this article, we tried various means to optimize the overhead of deserializing Protobuf-encoded WriteRequest data.
First, we utilized pooling techniques to avoid repeated memory allocation and deallocation, directly reducing the time consumption to about 36% of the baseline. Then, to leverage zero-copy features, we replaced the Label's String fields with Bytes type, but found that performance actually decreased. Flame graphs revealed that PROST introduced some extra overhead to allow Bytes to convert between the BytesAdapter and Buf traits. By specializing the type, we managed to eliminate these overheads. Additionally, we noticed in the flame graphs that some extra overheads are introduced by Bytes::slice itself to ensure memory safety. Considering our use case, we hacked the slice implementation, eventually reducing the time consumption to about 20% of the baseline.
Overall, Rust imposes quite a few restrictions when directly manipulating byte arrays to ensure memory safety. Using Bytes can circumvent lifetime issues via reference counting, but at the cost of low efficiency. On the other hand, using &[u8] forces one to deal with the contagion of lifetimes.
In this article, a compromise approach was adopted, bypassing the reference counting mechanism of Bytes through unsafe methods, manually ensuring the input buffer remains valid for the entire lifecycle of the output. It's worth noting that this isn't a universally applicable optimization method, but it's worth trying when the cost is part of a hot code path.
Furthermore, "zero-cost abstraction" is one of the key design philosophies of the Rust language. However, not all abstractions are zero-cost. In this article, we saw the overhead of conversion between PROST's BytesAdapter and Buf traits, and the dynamic dispatch cost introduced by Bytes to accommodate different underlying data sources, etc. This reminds us to pay more attention to the underlying implementation of critical code paths and guarantee high performance through continuous profiling.
Besides optimizing deserialization, we also made other efforts in the write path for GreptimeDB v0.7. Initially, the WriteRequest had to be fully parsed before converting to GreptimeDB's RowInsertRequest. Now, we eliminate the intermediate structure, directly converting the TimeSeries structure into table-dimension write data during the deserialization of WriteRequest. In this way, it can reduce the traversal of all timelines (#3425, #3478), while also lowering the memory overhead of the intermediate structure. Moreover, the default HashMap in Rust based on SipHash did not perform ideally for constructing table-dimension write data. By switching to a HashMap based on aHash, we achieved nearly a 40% performance improvement in table lookup.
Performance optimization is inherently systematic, marked by the meticulous accumulation of improvements in even the smallest details that cumulatively yield substantial gains. The GreptimeDB team is steadfastly committed to this ongoing journey, striving to push the boundaries of efficiency and excellence.
About Greptime
Greptime offers industry-leading time series database products and solutions to empower IoT and Observability scenarios, enabling enterprises to uncover valuable insights from their data with less time, complexity, and cost.
GreptimeDB is an open-source, high-performance time-series database offering unified storage and analysis for metrics, logs, and events. Try it out instantly with GreptimeCloud, a fully-managed DBaaS solution—no deployment needed!
The Edge-Cloud Integrated Solution combines multimodal edge databases with cloud-based GreptimeDB to optimize IoT edge scenarios, cutting costs while boosting data performance.
Star us on GitHub or join GreptimeDB Community on Slack to get connected.


