On this page
Introduction
Prometheus has established itself as a cornerstone in the monitoring and alerting ecosystem, favored for its straightforwardness and efficiency in handling real-time metrics. Central to its operation is a data model where each sample comprises a single value and an assortment of labels, a design that, while fostering simplicity and adaptability, also introduces several challenges. These challenges can impact data collection efficiency, analysis depth, and query capabilities.
This article explores the limitations inherent in Prometheus's single-value data model and introduces GreptimeDB's innovative solutions that aim to address these issues, illustrated with practical examples.
Challenges of The Single-Value Data Model
1. Redundant Label Transmission in Data Collection
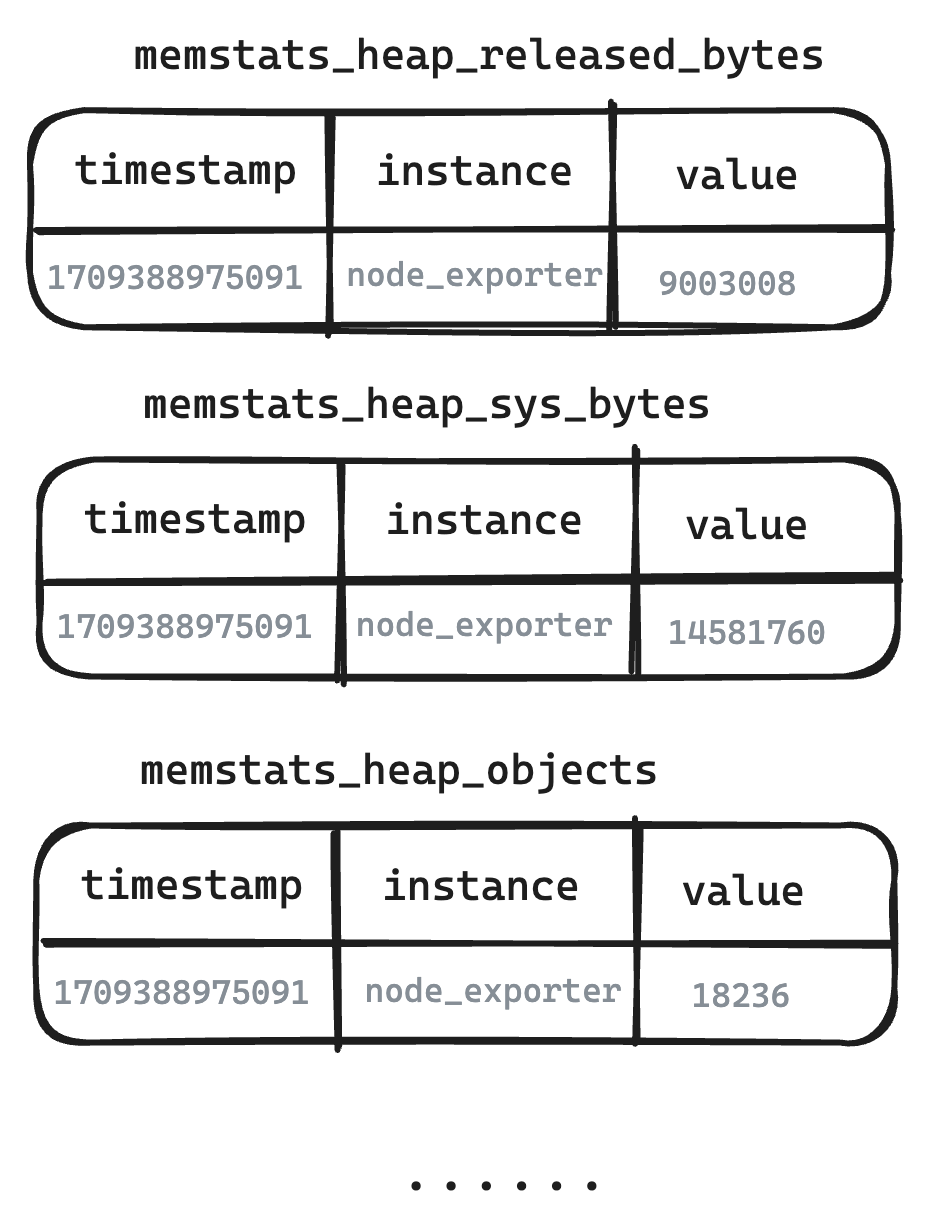
Prometheus's data model necessitates the repeated transmission of labels for measurements from the same source, resulting in inefficient data collection and storage. Despite the employment of optimization techniques in Prometheus's storage engine to enhance data storage efficiency, the redundancy of label information still poses a significant overhead.
Example:
In a scenario where multiple metrics like CPU usage, memory usage, and disk I/O are collected from a server cluster, each metric carries identical labels such as cluster_name, region, instance and server_type, leading to unnecessary duplication.
2. Loss of Measurement Correlation
The separation of related measurements into distinct metrics, without a mechanism for structured grouping or inheritance, leads to a loss of correlation among measurements. This separation makes correlated analysis and queries difficult, limiting insights into metric interactions.
Example:
When monitoring a Redis instance by tracking metrics such as memory usage, command processing rates, and active connections separately, it becomes challenging to analyze how these metrics influence each other. For example, understanding how memory usage affects command processing rates becomes difficult.
3. Complexity in Querying Composite Monitoring Views
Creating comprehensive monitoring dashboards requires aggregating data from multiple, separate PromQL queries, complicating dashboard construction and increasing the query load.
Example:
To monitor a Kubernetes node effectively, a dashboard needs to aggregate metrics like CPU load, memory consumption, network I/O, and pod counts. However, each metric requires a separate PromQL query, which complicates the dashboard setup and may potentially impact performance.
GreptimeDB to the Rescue
GreptimeDB introduces innovative solutions to address the limitations of Prometheus's single-value data model:
1. Group related metrics and store them together
GreptimeDB has developed a new storage engine for this monitoring scenario, called Metric Engine. It supports storing multiple measurements together physically, cutting a huge amount of cost and accelerating the query in correlated measurements.
2. Multi-Value Samples and Diverse Value Types
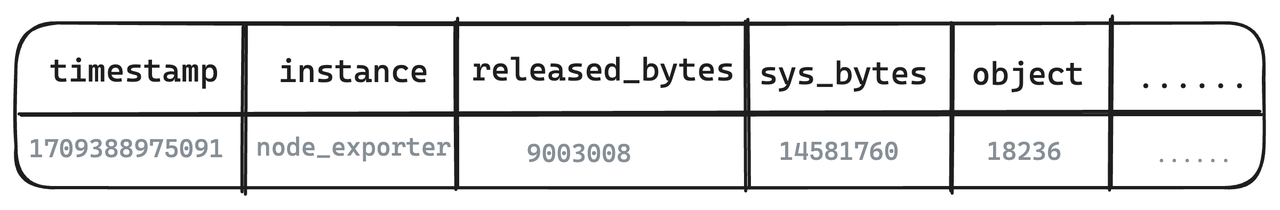
GreptimeDB allows each sample from a single data source to store multiple values, supporting a variety of value types beyond floats.
Example:
Monitoring data for a Redis instance can be stored in one or multiple time-series tables, with labels stored as separate tag columns and grouped measurements as separate field columns. This approach reduces label transmission redundancy, preserves data correlation, and facilitates associated analysis and querying.
3. Extended PromQL for Multiple Field Queries
GreptimeDB enhances PromQL to allow queries to return multiple fields (values). To specify a particular field, an extended __field__ label can be used.
Example:
This extended PromQL query memstats{ __field__="used_bytes", __field__="free_bytes"} fetches two time series in one query and renders them together. This extension simplifies querying for composite monitoring views, reducing the complexity and load of constructing detailed dashboards.
4. Support for Table Model and SQL for Advanced Association Analysis
One of the most impactful features GreptimeDB offers is its support for a table model and the use of SQL for querying data. This capability significantly surpasses the flexibility of PromQL, especially when it comes to performing association analysis and executing complex queries. By leveraging a relational model, users can perform joins across different datasets, enabling a deeper and more nuanced analysis of the monitored systems.
Example:
In a complex monitoring scenario where one needs to correlate server performance metrics with application error logs, GreptimeDB allows for this data to be queried together using SQL. For instance, one could execute a SQL query to join CPU usage metrics with application error logs based on timestamps, providing insights into how spikes in CPU usage may correlate with increased error rates. This level of analysis would be cumbersome, if not impossible, to achieve with PromQL alone.
P.S. GreptimeDB is actively developing the logs engine as described in the Roadmap. Stay tuned!
This support for a table model and SQL, not only makes GreptimeDB a powerful tool for users transitioning from traditional SQL-based systems, but also enhances the capability for in-depth analysis without the steep learning curve associated with mastering PromQL. Introducing these features marks a significant step forward in making monitoring data more accessible and actionable for a broader range of analytical tasks, from basic monitoring to complex performance analysis and troubleshooting.
Conclusion
While Prometheus's single-value data model has contributed to its simplicity and widespread adoption, it also poses challenges in terms of data collection efficiency, measurement correlation, and query complexity. GreptimeDB's solutions offer a promising approach to overcoming these limitations, providing more efficient data collection, enhanced correlation analysis, and simplified querying for comprehensive monitoring views.
About Greptime
Greptime offers industry-leading time series database products and solutions to empower IoT and Observability scenarios, enabling enterprises to uncover valuable insights from their data with less time, complexity, and cost.
GreptimeDB is an open-source, high-performance time-series database offering unified storage and analysis for metrics, logs, and events. Try it out instantly with GreptimeCloud, a fully-managed DBaaS solution—no deployment needed!
The Edge-Cloud Integrated Solution combines multimodal edge databases with cloud-based GreptimeDB to optimize IoT edge scenarios, cutting costs while boosting data performance.
Star us on GitHub or join GreptimeDB Community on Slack to get connected.


