On this page
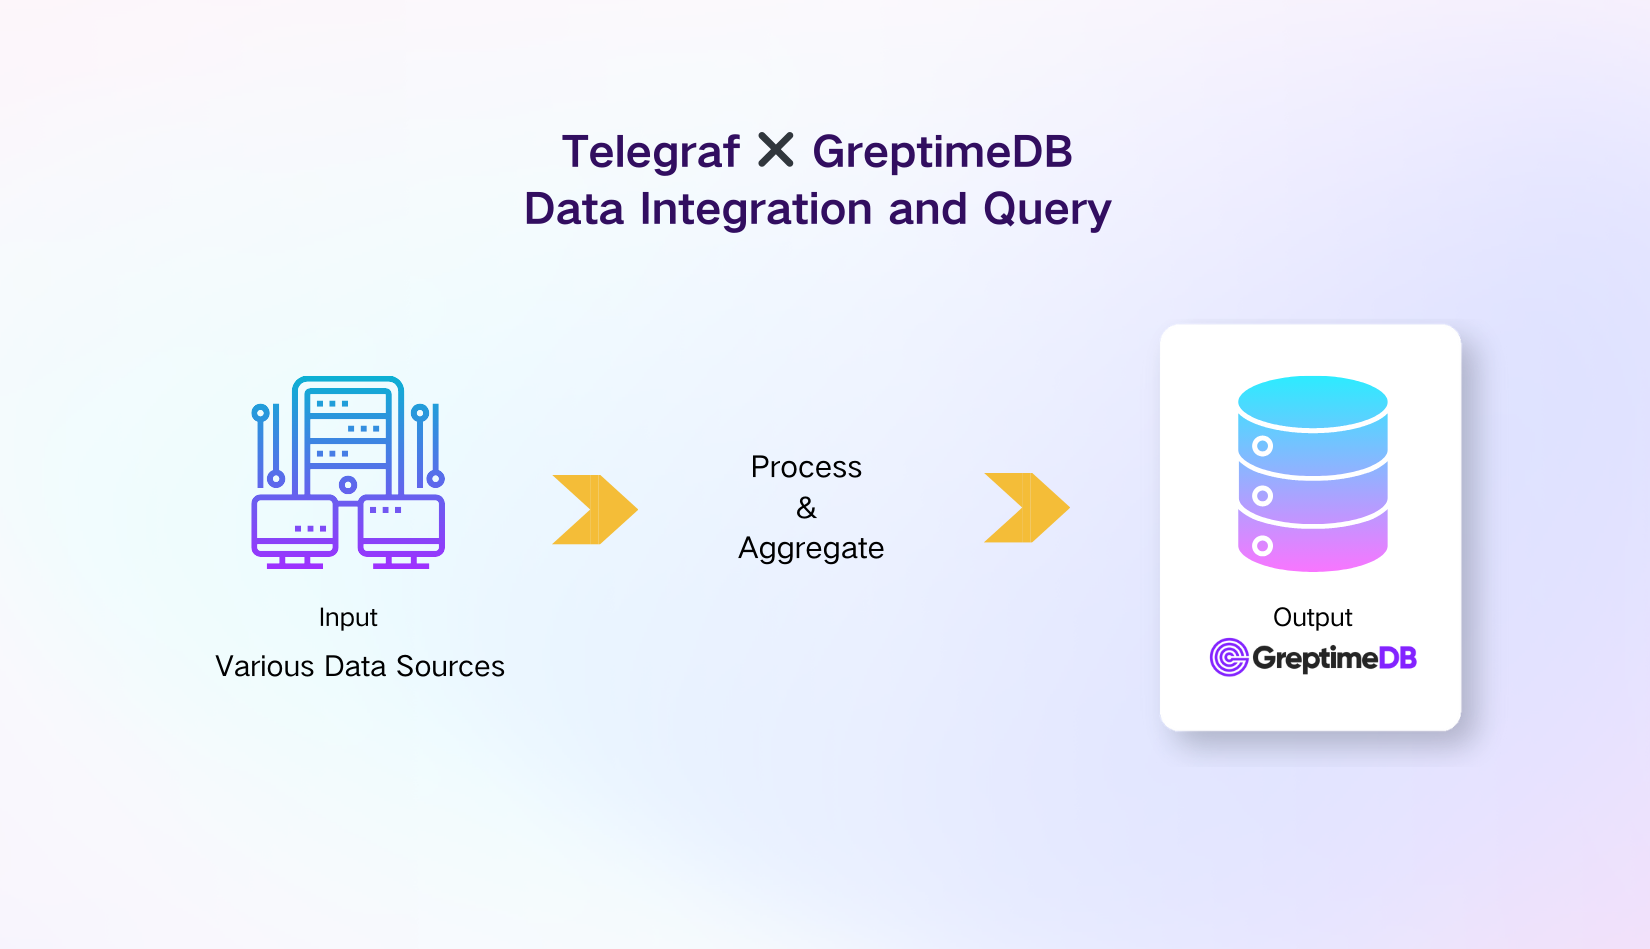
Telegraf is an open source server agent that help users collect metrics from stacks, sensors, and systems. It supports more than 200 event sources, ranging from IoT sensors, DevOps tools and frameworks, system telemetry and more. Telegraf also implements several processor and aggregator plugins, which preprocess and preaggregate the collected data before ingesting into the output destination.
As shown in the "Ingestion by InfluxDB line protocol, Analysis with SQL and PromQL" demo, GreptimeDB can be used as a server acceptings InfluxDB line protocol write calls. This allows users to use GreptimeDB as an instance of the "influxdb" output destination of Telegraf, enabling them to connect to all event sources, as well as benefit from its processors and aggregators.
GreptimeDB supports both InfluxDB v1 and v2 write APIs. To simplify the configure, since GreptimeDB doesn't use the "organization" concept that is required in V2, this tutorial uses the InfluxDB v1.x output plugin.
Set up Greptime Service
Let's first set up the output destination.
The fastest way to get a GreptimeDB cluster is to start a Hobby plan service on GreptimeCloud. Note that the Hobby plan is completely free with no credit card info needed.
Follow the instructions from GreptimeCloud to create a new GreptimeDB service, and click the "Connection Information" button to find the connection information. Then, export the necessary environment variables:
shell
export GREPTIME_HOST="<host>"
export GREPTIME_DATABASE="<dbname>"
export GREPTIME_USERNAME="<username>"
export GREPTIME_PASSWORD="<password>"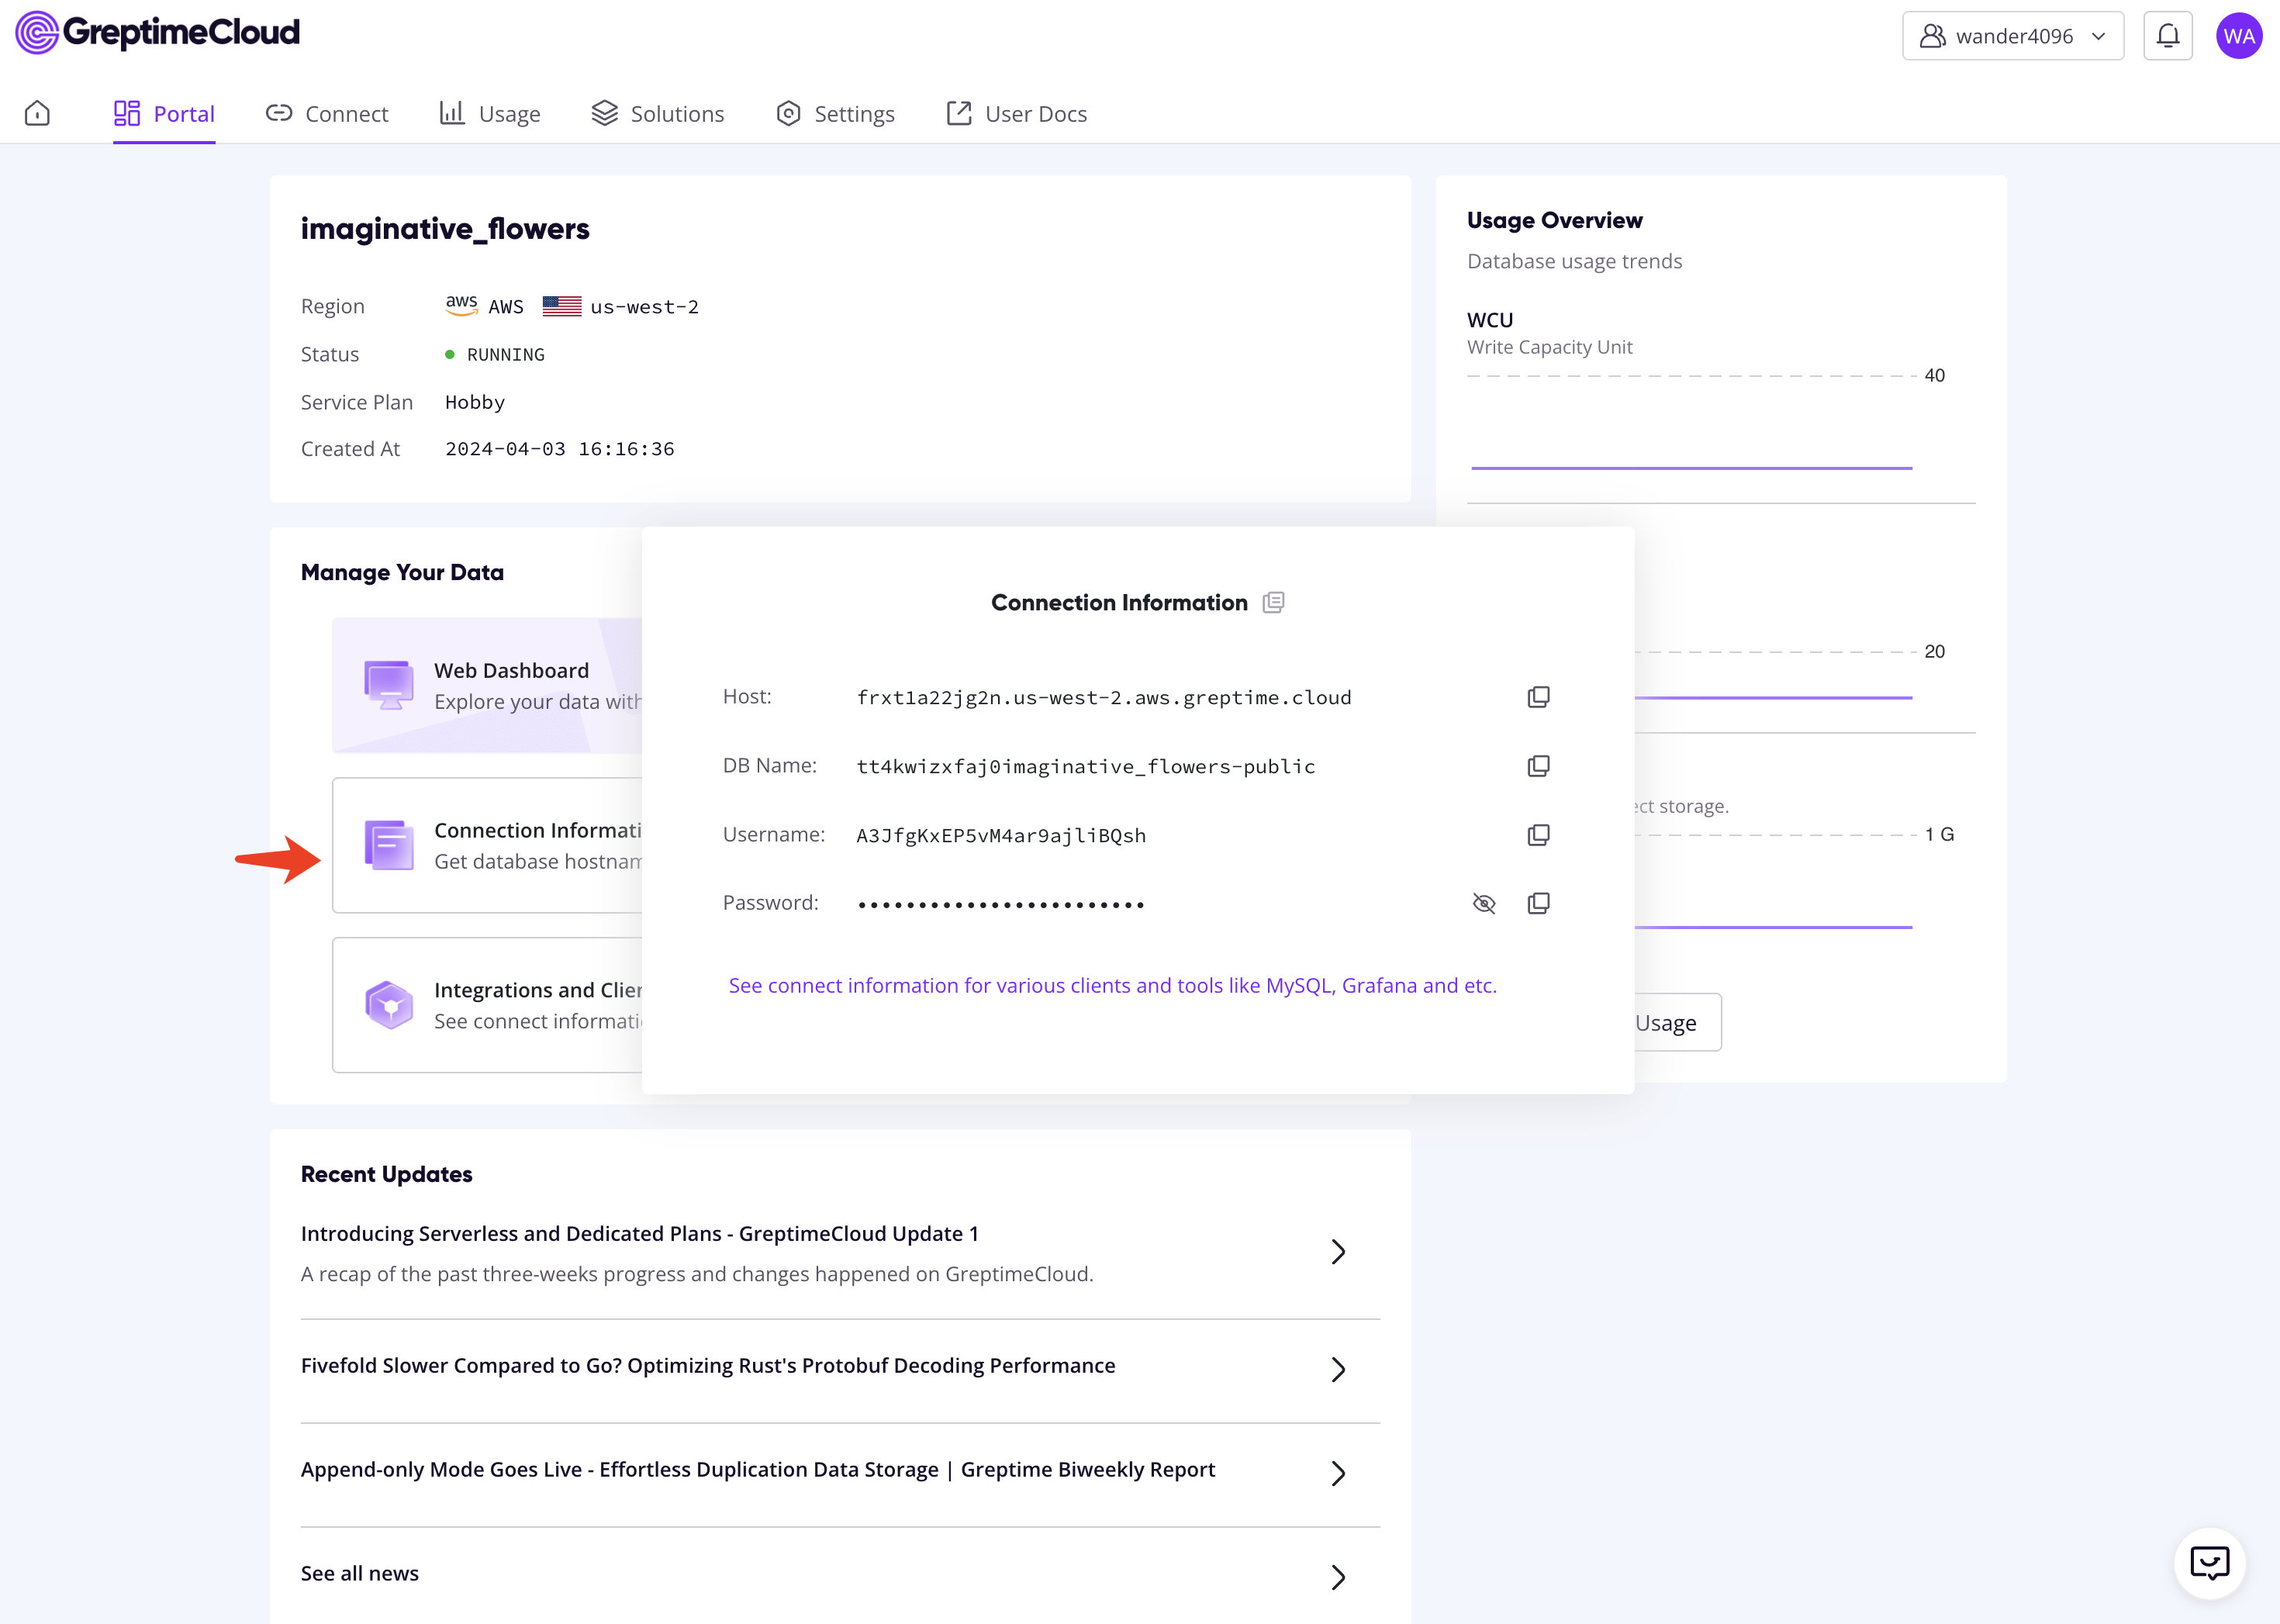
Configure and start a Telegraf instance
Now that the GreptimeDB service is ready, the next step is to start a Telegraf instance to collect and transform events.
If you don't have Telegraf installed, head to its Install page for a guidance. For example, you can install Telegraf with Homebrew by:
shell
brew install telegrafThen, you can generate a config file by:
shell
telegraf --sample-config > telegraf.confYou should modify the [[outputs.influxdb]] section to configure GreptimeDB's connection info:
toml
[[outputs.influxdb]]
urls = ["https://${GREPTIME_HOST}/v1/influxdb/"]
database = "${GREPTIME_DATABASE}"
username = "${GREPTIME_USERNAME}"
password = "${GREPTIME_PASSWORD}"
skip_database_creation = true
Finally, you can choose any input plugin to start collecting statistics.
For example, you can collect system metrics with the following input plugins:
toml
[[inputs.cpu]]
collect_cpu_time = false
core_tags = false
percpu = true
report_active = false
totalcpu = true

[[inputs.disk]]
ignore_fs = ["tmpfs", "devtmpfs", "devfs", "iso9660", "overlay", "aufs", "squashfs"]

[[inputs.diskio]]

[[inputs.mem]]

[[inputs.processes]]

[[inputs.system]]
Add some processors and aggregators:
toml
[[processors.printer]]

[[aggregators.minmax]]
period = "30s"
drop_original = false
Now, let's start the telegraf instance with this config:
shell
telegraf --config telegraf.confQuery events collected
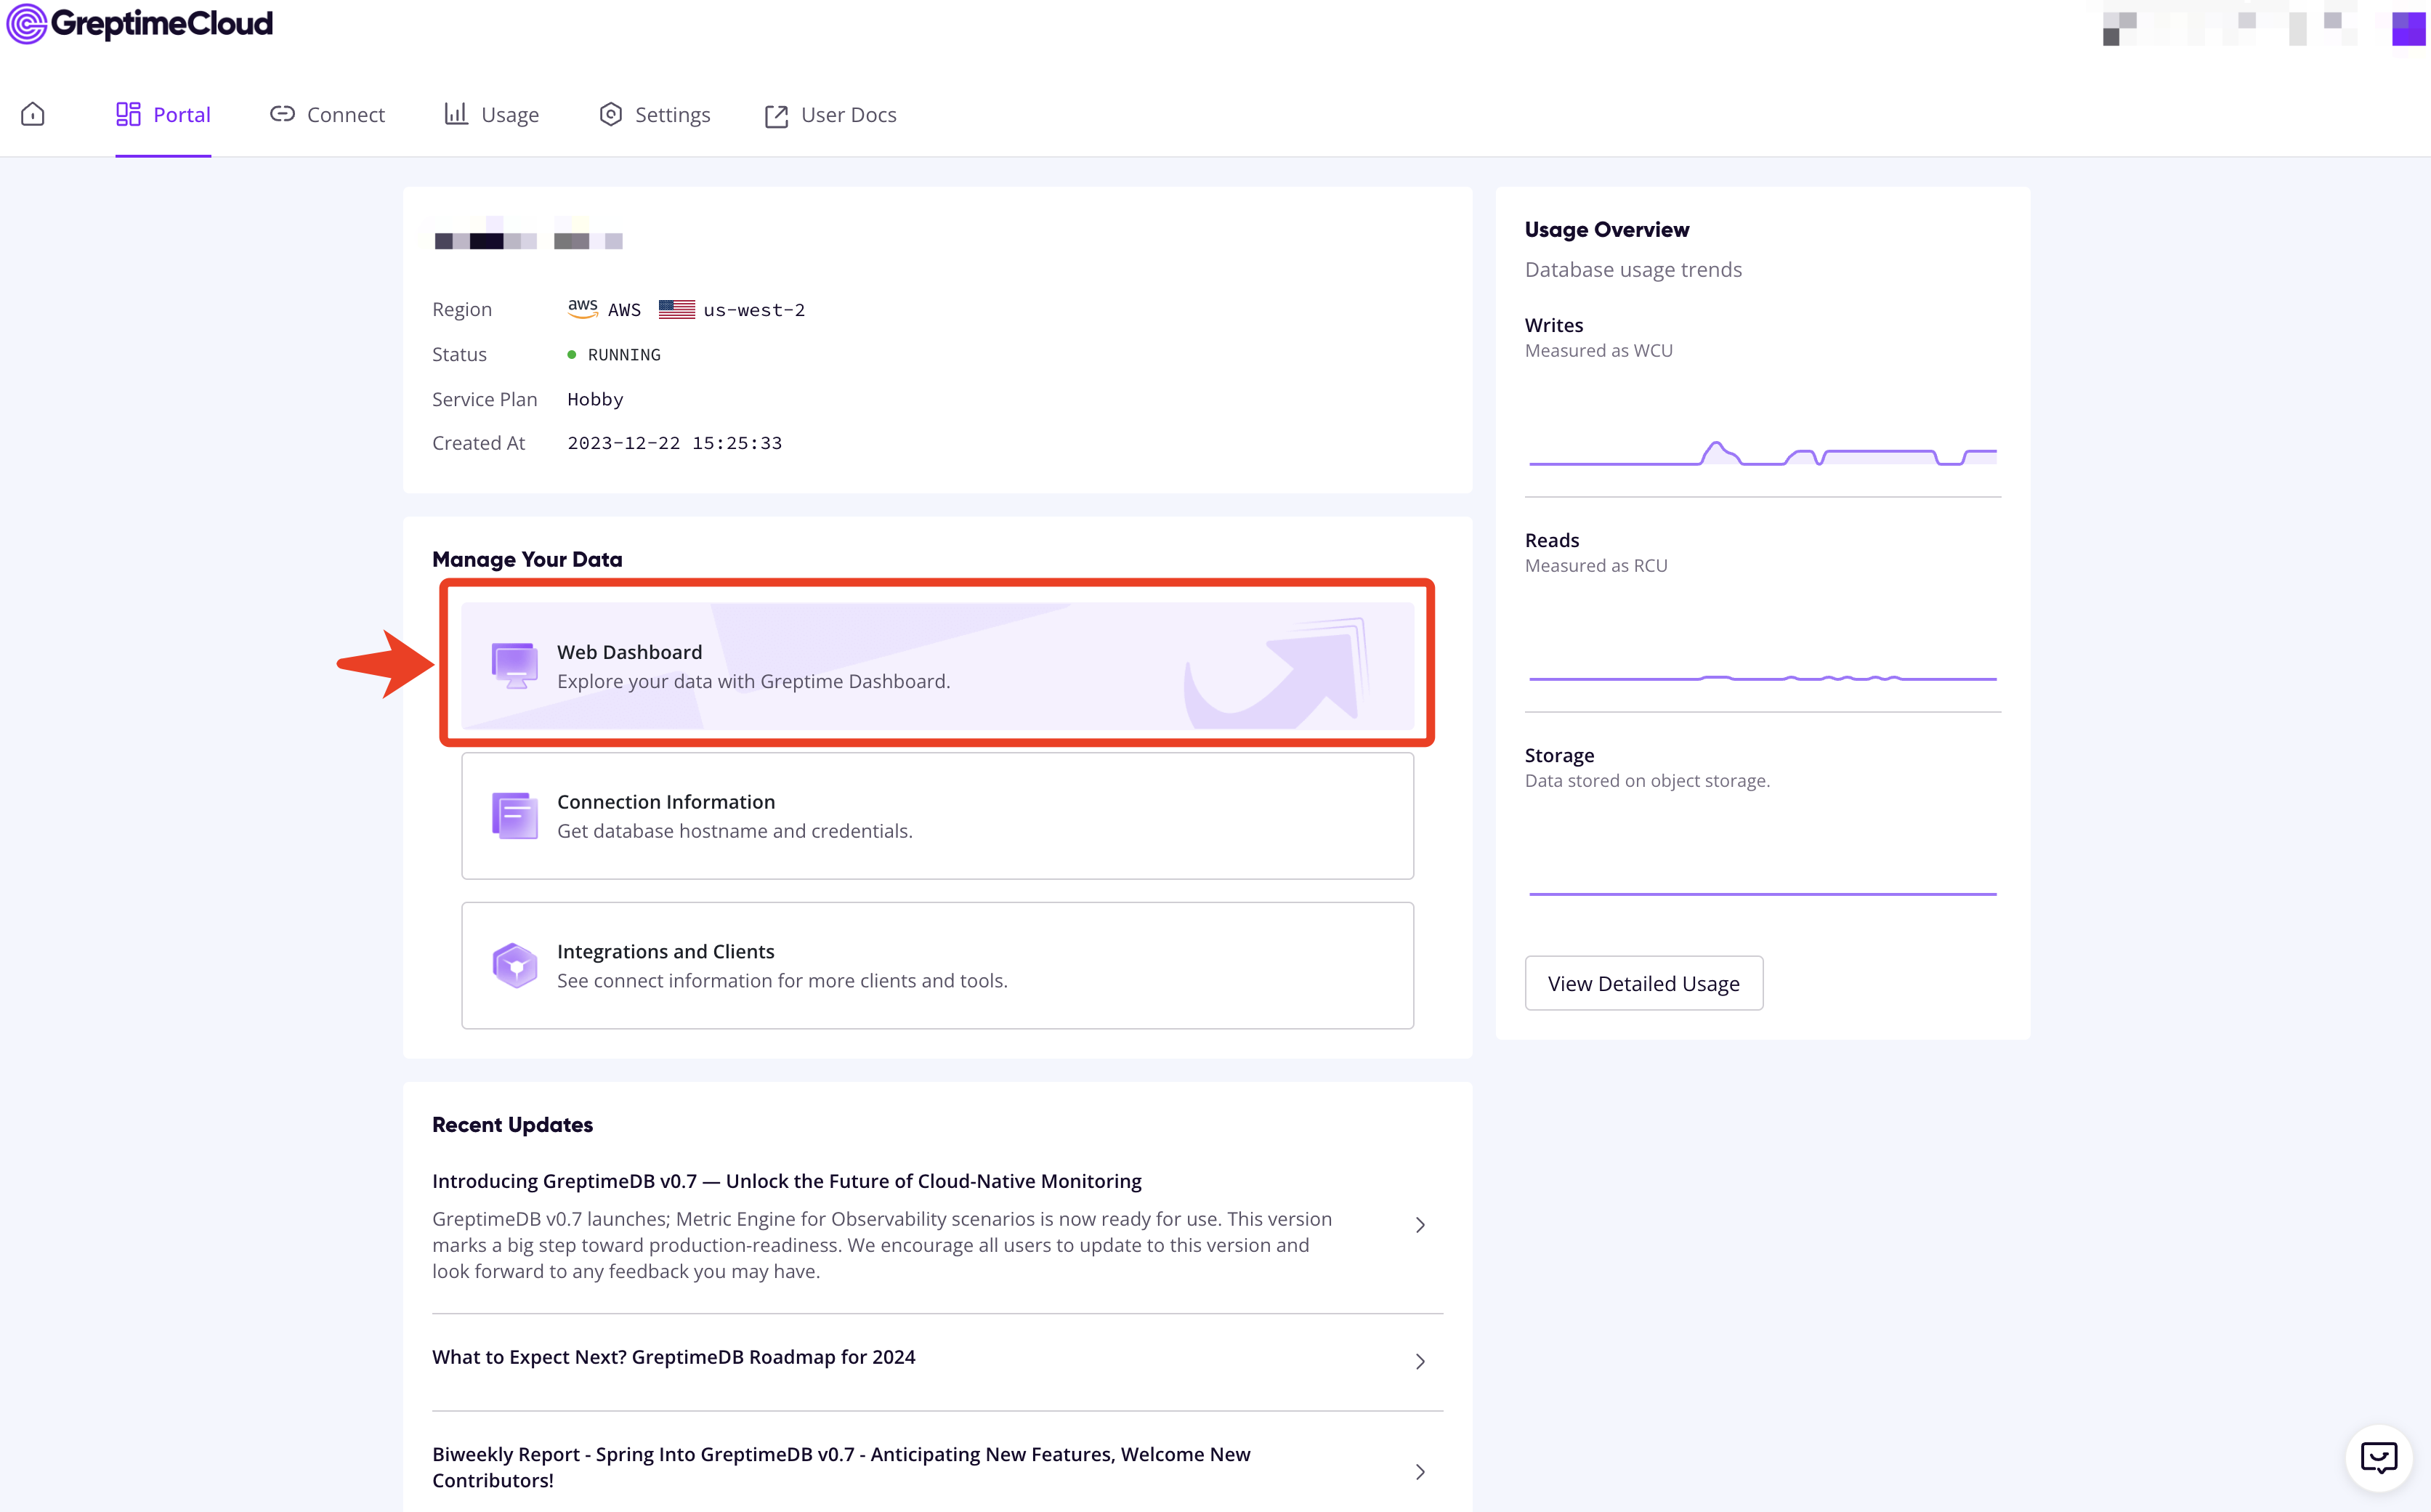
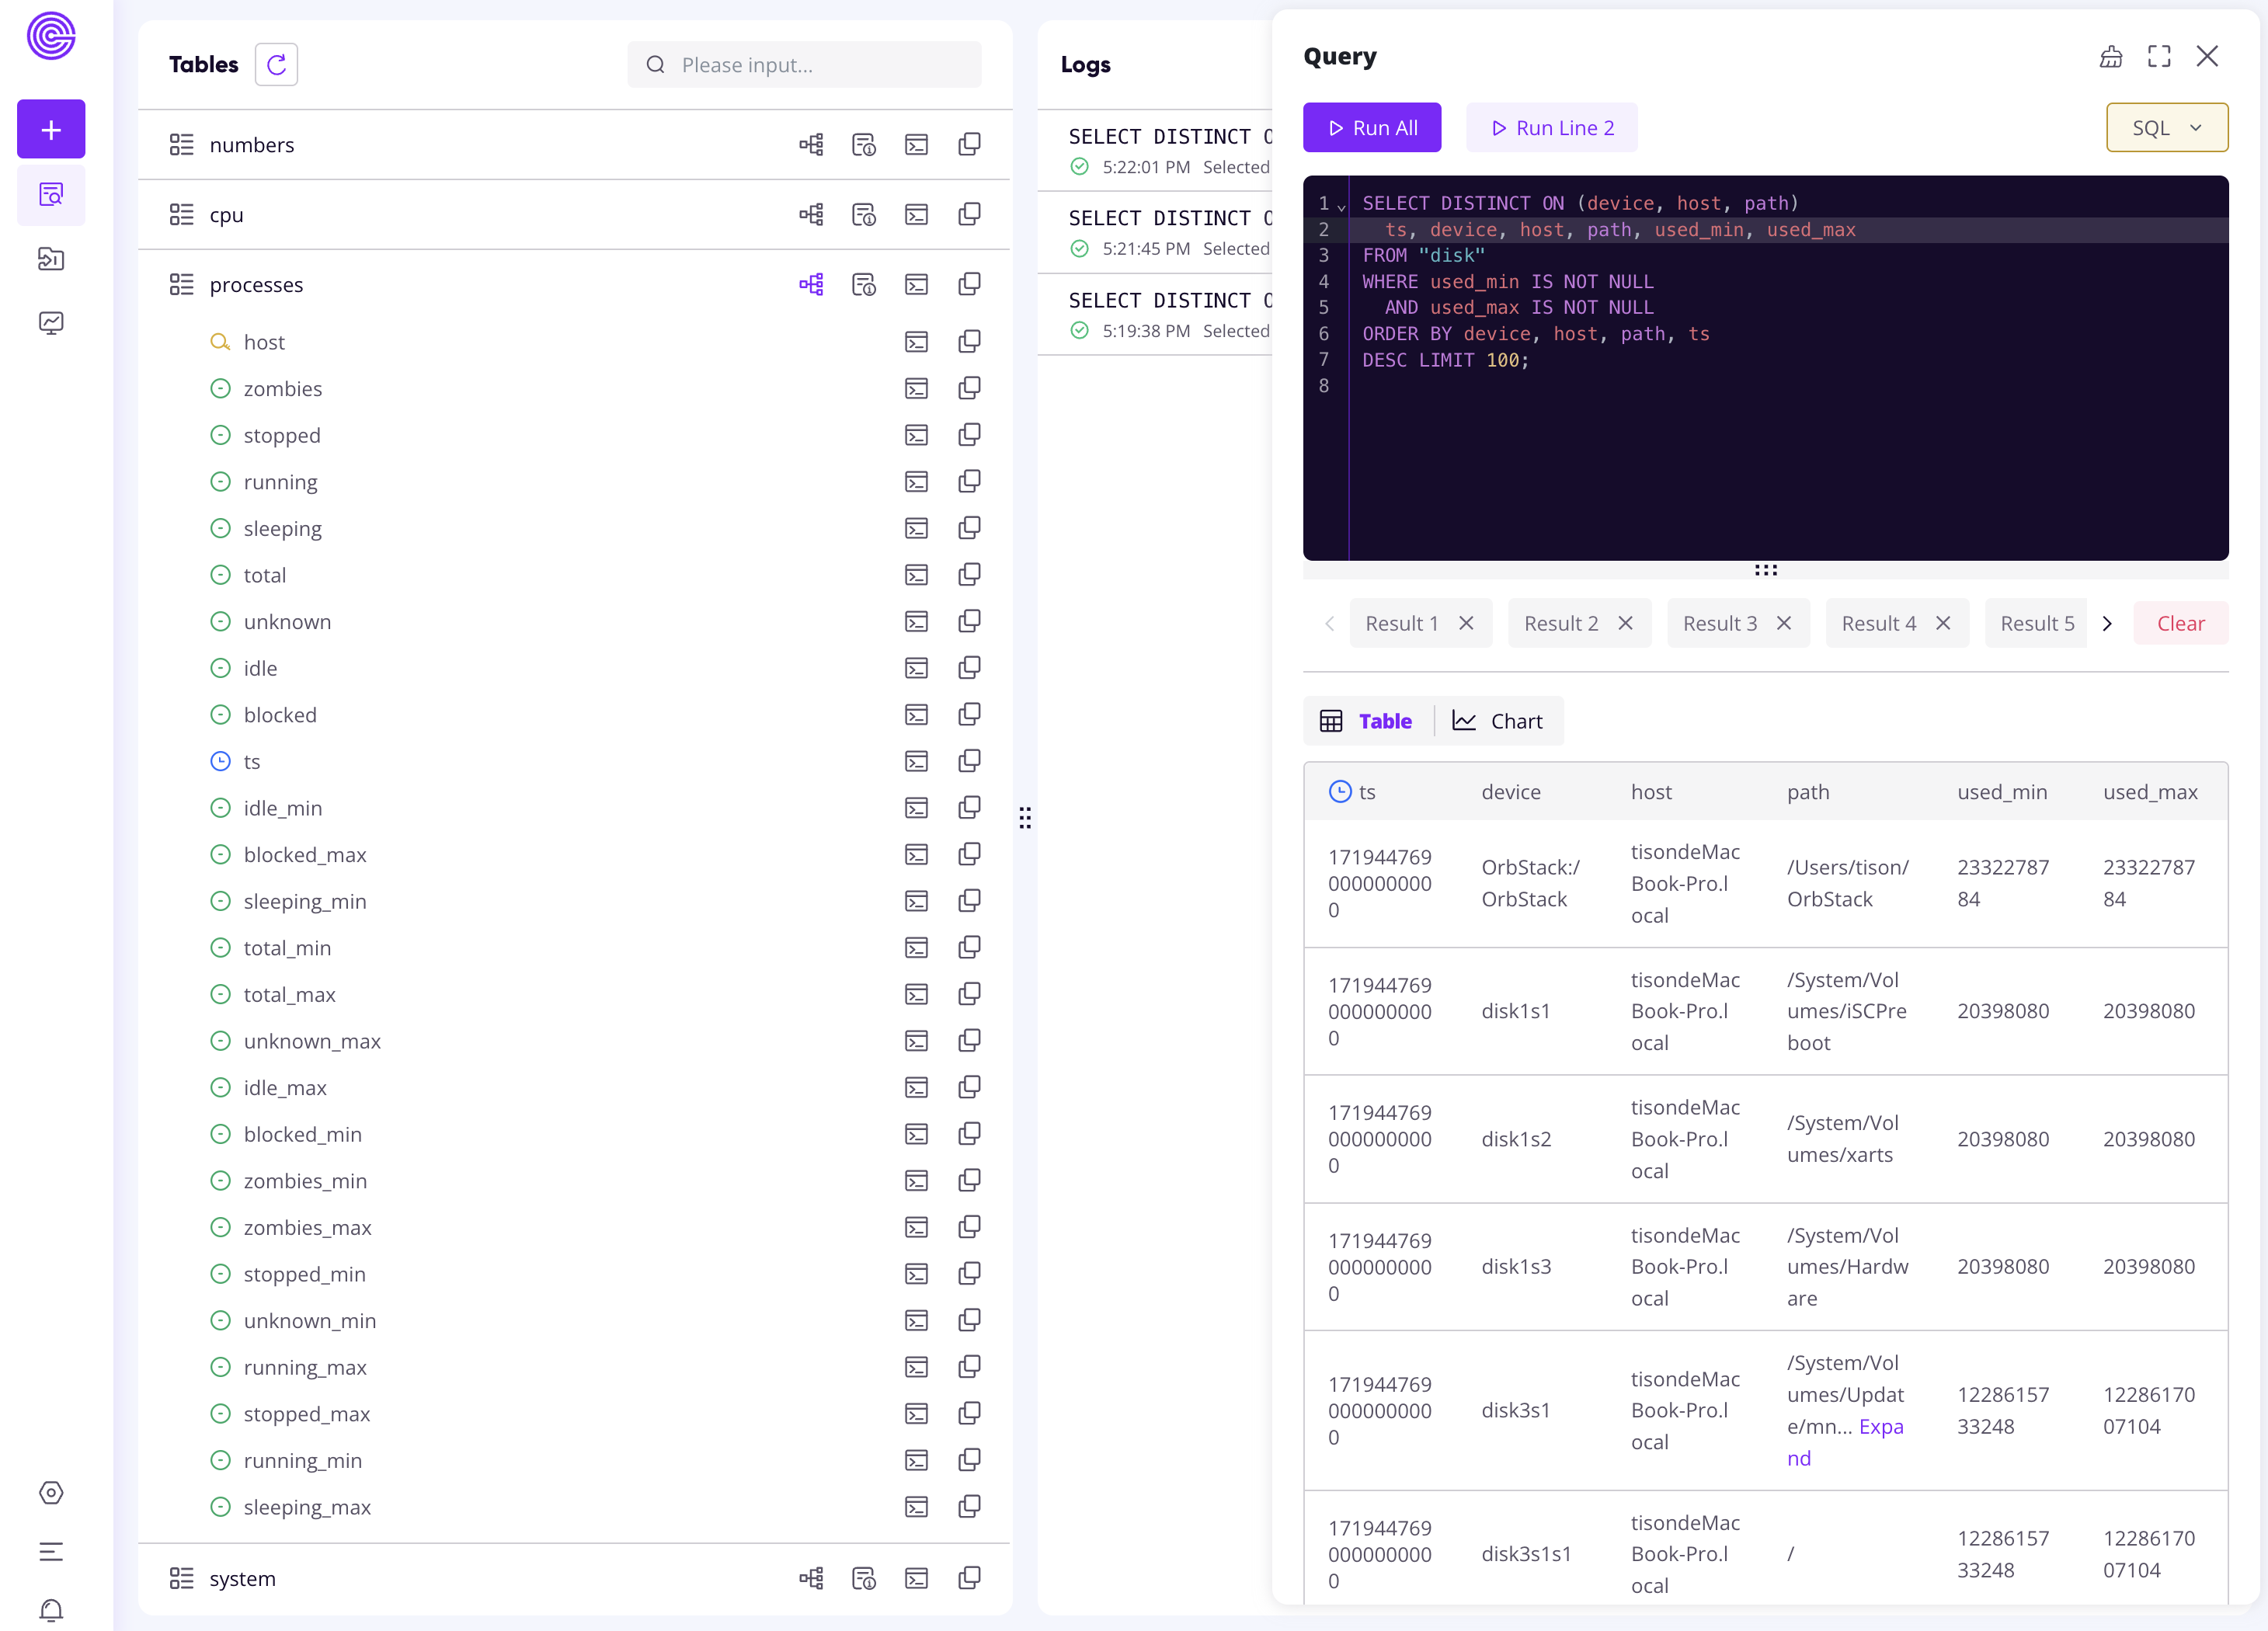
You can make sample queries from the Web Dashboard:
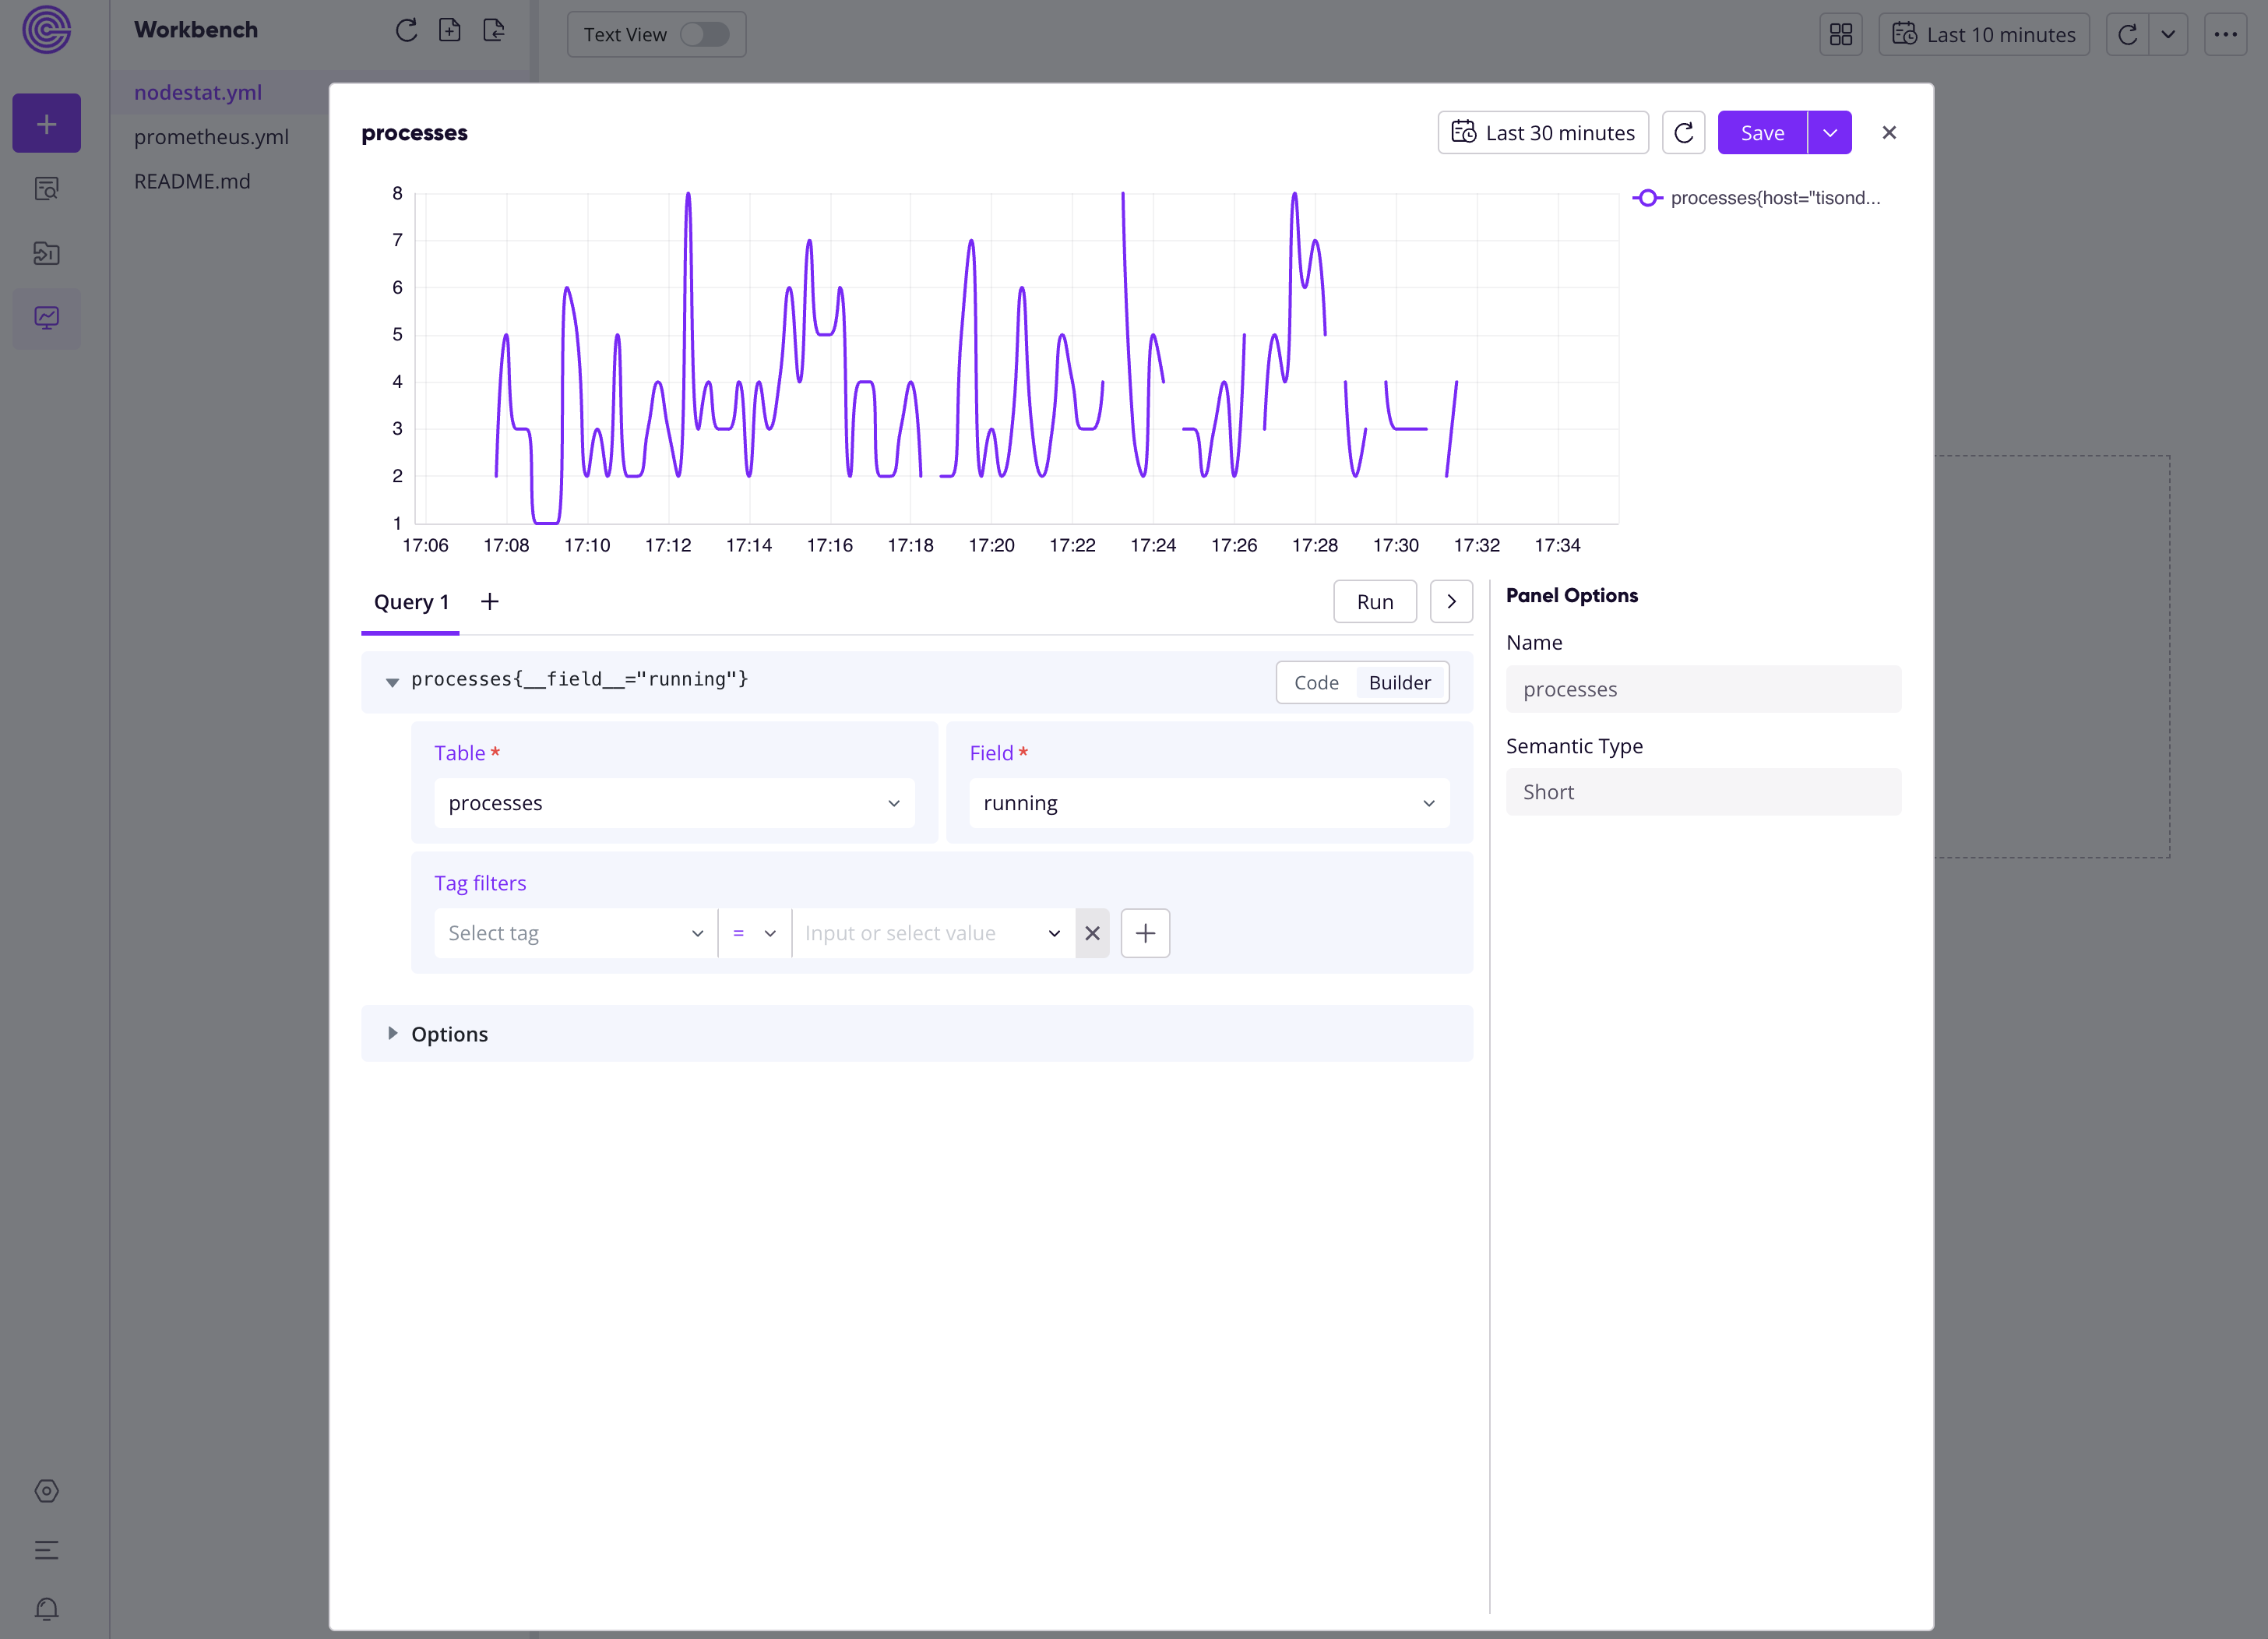
Instead, you can also build charts from the statistics for visualization:
About Greptime
Greptime offers industry-leading time series database products and solutions to empower IoT and Observability scenarios, enabling enterprises to uncover valuable insights from their data with less time, complexity, and cost.
GreptimeDB is an open-source, high-performance time-series database offering unified storage and analysis for metrics, logs, and events. Try it out instantly with GreptimeCloud, a fully-managed DBaaS solution—no deployment needed!
The Edge-Cloud Integrated Solution combines multimodal edge databases with cloud-based GreptimeDB to optimize IoT edge scenarios, cutting costs while boosting data performance.
Star us on GitHub or join GreptimeDB Community on Slack to get connected.


