On this page
As we step into the second half of 2024, we are excited to announce the official release of a new version of GreptimeDB.
In this new version, we introduce a new storage engine, Log Engine, which is optimized for log storage and queries. This engine not only enhances the efficiency of log data storage but also provides users with more powerful log data processing and querying capabilities.
Log Engine
Log Engine is a storage engine specifically optimized for log storage and queries, featuring fulltext indexing.
Why is Log Engine Important?
Log data is often unstructured or semi-structured, including text, timestamps, error messages, event descriptions, and more. This type of data is detailed and rich, recording various system events and operations. Previously, GreptimeDB supported metric-based data analysis. However, in scenarios such as IoT and observability, log analysis is crucial for fault diagnosis and resolution, performance, security monitoring, and understanding user behavior.
Log, as an event, contain unstructured messages that often require sophisticated searching mechanisms to extract meaningful insights. From this version onwards, GreptimeDB will gradually become a unified database supporting both metrics and log analysis. This will significantly enhance the ability to perform correlation analysis across different data sources. For example, root cause analysis will become straightforward, as all relevant event data will be in one place, eliminating the need to switch between multiple systems and interfaces.
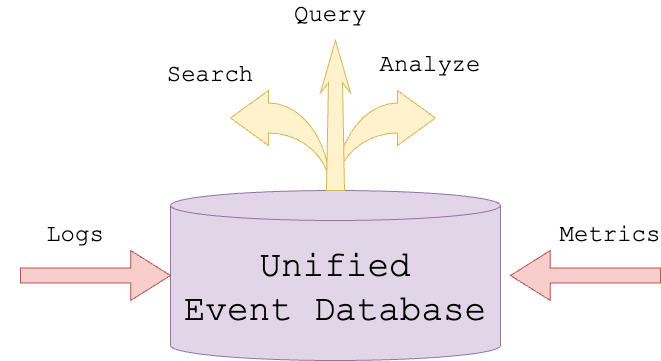
The advantages of unifying logs and metrics in monitoring systems and how GreptimeDB design unified event management can be found in this blog: Unifying Logs and Metrics — Revolutionizing Event Management in Monitoring Systems
Log Engine Components
- Log Pipeline
Pipeline is a mechanism in GreptimeDB for transforming log data (in JSON format). It consists of a unique name and a set of configuration rules that define how to format, split, and transform log data.
These configurations are provided in YAML format, allowing the Pipeline to process data according to the set rules during log ingestion and store the processed data in the database for subsequent structured queries.
The Pipeline is composed of two parts:
- Processor: Used for preprocessing log data, such as parsing time fields, replacing fields, etc.
- Transform: Used for transforming log data, such as converting string types to numeric types.
- Fulltext Search
Fulltext search capabilities include:
FullText Index: Accelerate fulltext searches; certain columns can be specified to use fulltext indexing in the table creation statement or Pipeline configuration to accelerate search operations.
MATCHESSearch Function: Allows users to search using various term expressions, including simple terms, negation terms, required terms, and other search types.
Log Engine Application Demo
- Creating a Pipeline
YAML
## pipeline.yaml file
processors:
  - date:
      field: time
      formats:
        - "%Y-%m-%d %H:%M:%S%.3f"
      ignore_missing: true

transform:
  - fields:
      - id1
      - id2
    type: int32
  - fields:
      - type
      - logger
    type: string
    index: tag
  - fields:
      - log
    type: string
    index: fulltext
  - field: time
    type: time
    index: timestamp
bash
## Upload pipeline file,test refers to the name of Pipeline
curl -X "POST" "http://localhost:4000/v1/events/pipelines/test" -F "[email protected]"- Write Log data in
go
curl -X "POST" "http://localhost:4000/v1/events/logs?db=public&table=logs&pipeline_name=test" \
     -H 'Content-Type: application/json' \
     -d $'{"time":"2024-05-25 20:16:37.217","id1":"2436","id2":"2528","type":"I","logger":"INTERACT.MANAGER","log":"this is a test log message"}
{"time":"2024-05-25 20:16:37.217","id1":"2436","id2":"2528","type":"I","logger":"INTERACT.MANAGER","log":"Started logging"}
{"time":"2024-05-25 20:16:37.217","id1":"2436","id2":"2528","type":"I","logger":"INTERACT.MANAGER","log":"Attended meeting discussion"}
{"time":"2024-05-25 20:16:37.217","id1":"2436","id2":"2528","type":"I","logger":"INTERACT.MANAGER","log":"Handled customer support requests"}'- Table structure of
logs(including the syntax for automatically creating tables)
sql
DESC TABLE logs;
 Column |        Type         | Key | Null | Default | Semantic Type
--------+---------------------+-----+------+---------+---------------
 id1    | Int32               |     | YES  |         | FIELD
 id2    | Int32               |     | YES  |         | FIELD
 type   | String              | PRI | YES  |         | TAG
 logger | String              | PRI | YES  |         | TAG
 log    | String              |     | YES  |         | FIELD
 time   | TimestampNanosecond | PRI | NO   |         | TIMESTAMP
(6 rows)- Conduct fulltext searching using the
MATCHESfunction
sql
SELECT * FROM logs WHERE MATCHES(log, "Attended OR Handled");
+------+------+------+------------------+-----------------------------------+----------------------------+
| id1  | id2  | type | logger           | log                               | time                       |
+------+------+------+------------------+-----------------------------------+----------------------------+
| 2436 | 2528 | I    | INTERACT.MANAGER | Handled customer support requests | 2024-05-25 20:16:37.217000 |
| 2436 | 2528 | I    | INTERACT.MANAGER | Attended meeting discussion       | 2024-05-25 20:16:37.217000 |
+------+------+------+------------------+-----------------------------------+----------------------------+
Other Functions
- Flow Engine Enhancements
- Flow Engine now supports cluster deployment.
- Added support for SHOW CREATE FLOW.
- Performance optimizations and bug fixes.
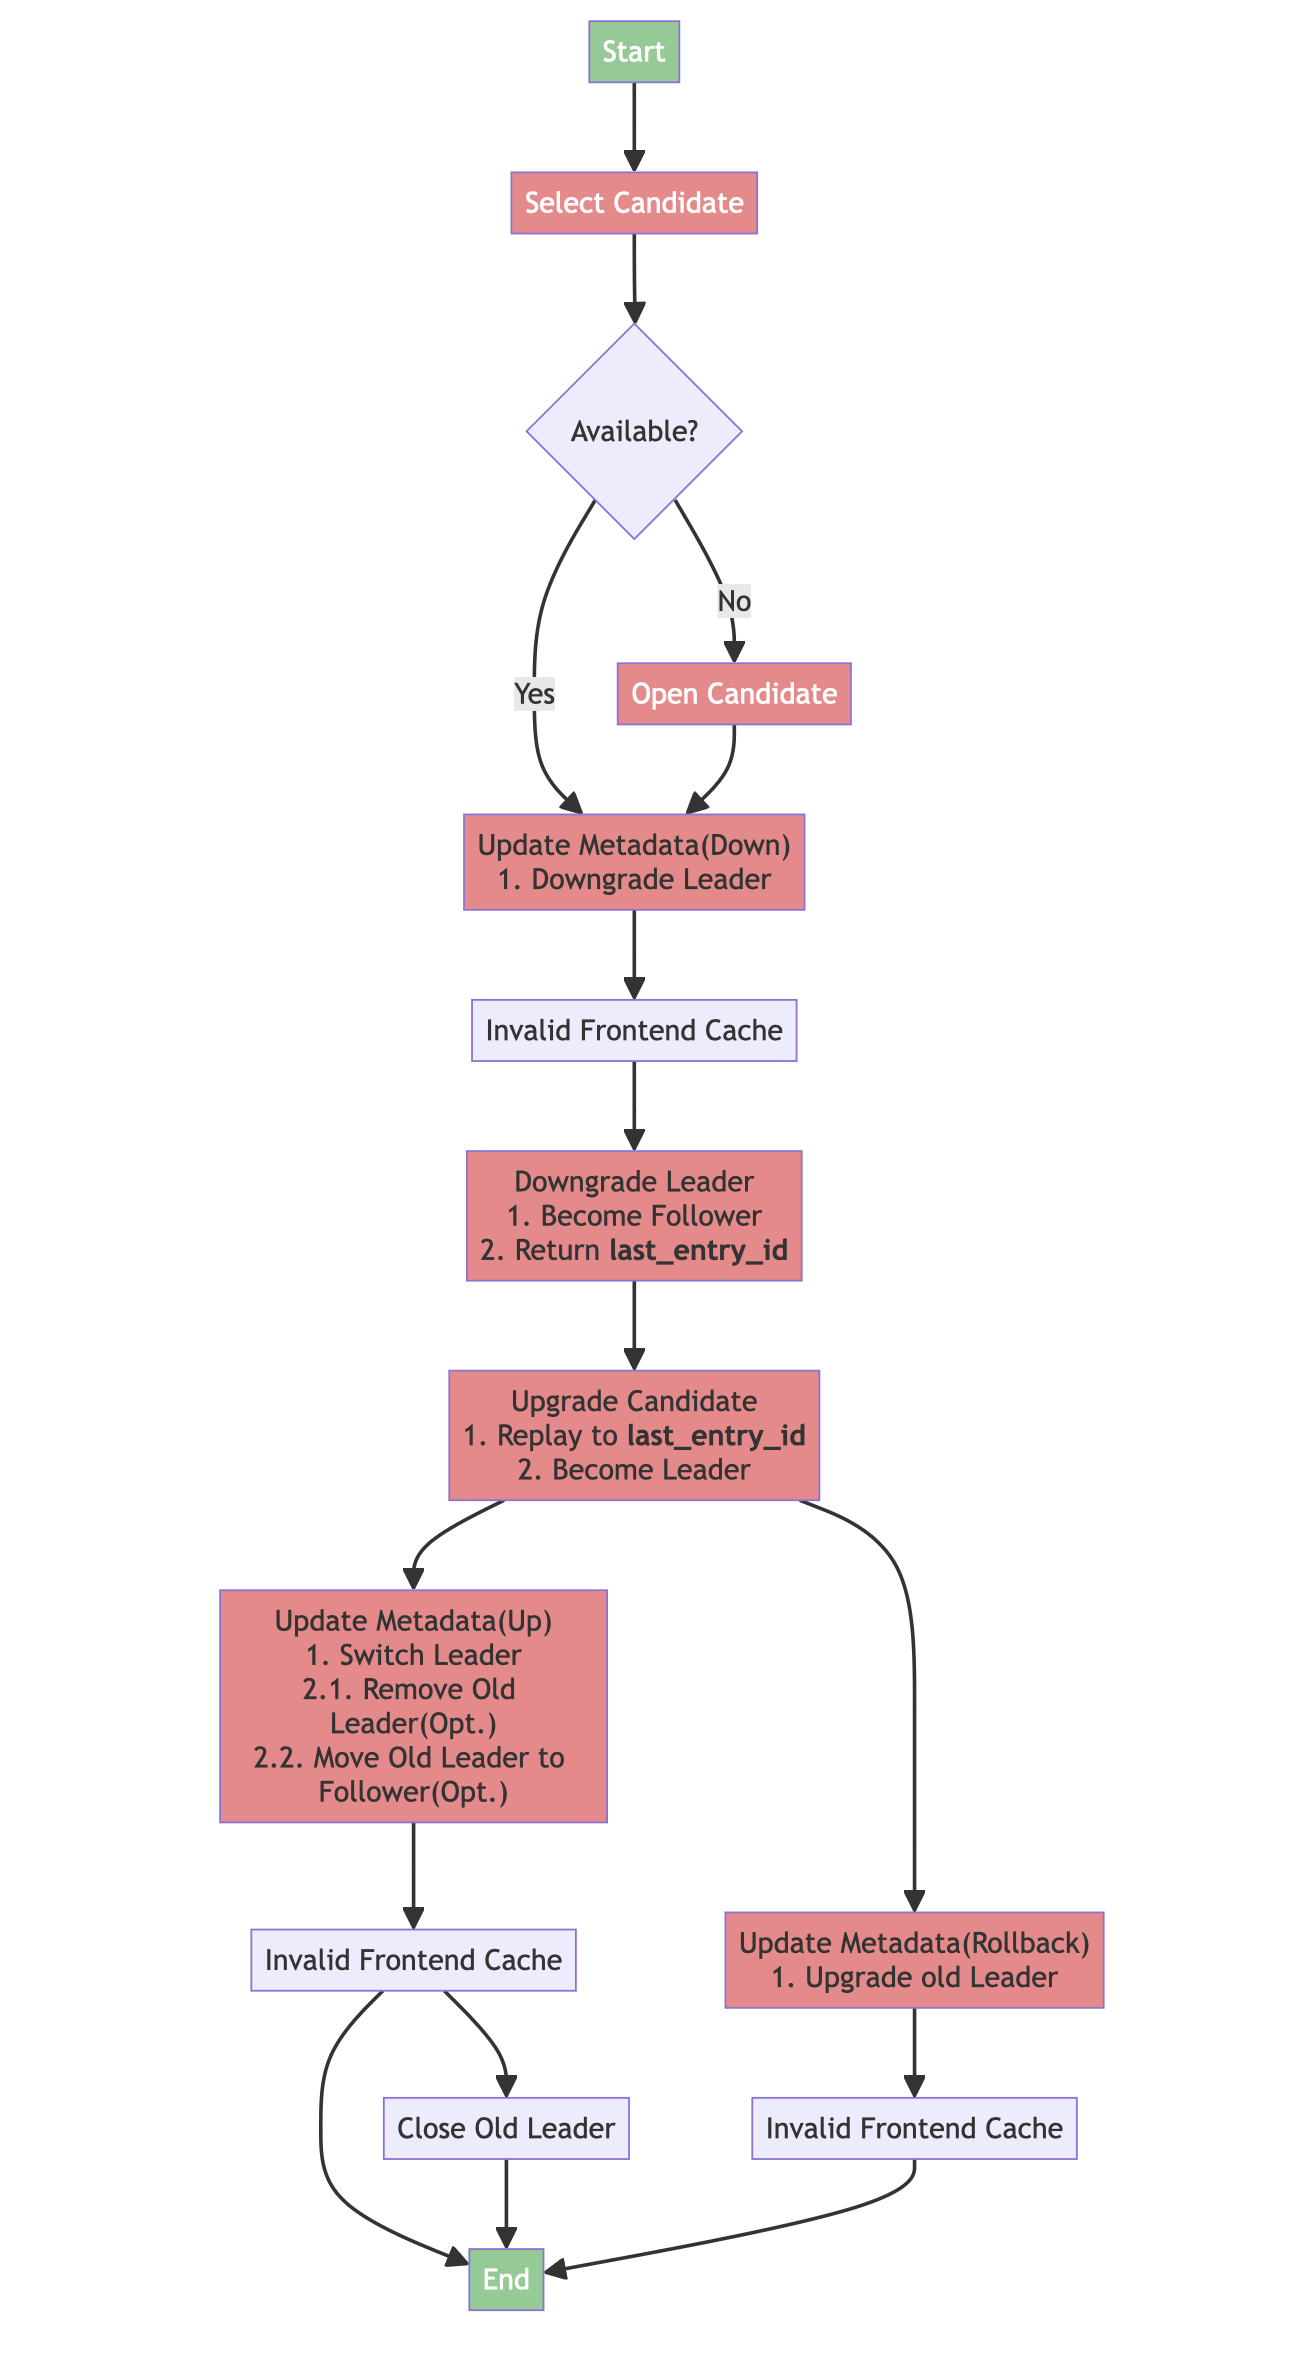
- Optimized Remote WAL, Distributed Region Failover is recommended to be turned on
- Refactored the write logic for Remote WAL, introducing zero-delay batch accumulation.
- Accelerate the speed of opening batch regions with Remote WAL.
- Conducted extensive testing of the Remote WAL-based Region Failover feature to ensure stable execution and high data reliability.
- Support for InfluxDB Merge Read
Introduced a new table parameter,
merge_mode, to control how GreptimeDB merges rows with the same tags and timestamps. The options arelast_rowandlast_non_null, withlast_rowas the default. Inlast_rowmode, GreptimeDB selects the most recent row as the merge result.In
last_non_nullmode, GreptimeDB selects the most recent non-null value for each field as the merge result. This mode allows users to update specific columns of a row, enabling GreptimeDB to be compatible with InfluxDB semantics.Here is an example:
SQL
create table if not exists last_non_null_table(
    host string,
    ts timestamp,
    cpu double,
    memory double,
    TIME INDEX (ts),
    PRIMARY KEY(host)
)
engine=mito
with('merge_mode'='last_non_null');

INSERT INTO last_non_null_table VALUES ('host1', 0, 0, NULL), ('host2', 1, NULL, 1);

INSERT INTO last_non_null_table VALUES ('host1', 0, NULL, 10), ('host2', 1, 11, NULL);
The result of the query is as follows:
SQL
SELECT * from last_non_null_table ORDER BY host, ts;

+-------+-------------------------+------+--------+
| host  | ts                      | cpu  | memory |
+-------+-------------------------+------+--------+
| host1 | 1970-01-01T00:00:00     | 0.0  | 10.0   |
| host2 | 1970-01-01T00:00:00.001 | 11.0 | 1.0    |
+-------+-------------------------+------+--------+- When writing data to GreptimeDB via the InfluxDB line protocol and triggering automatic table creation, GreptimeDB will set
merge_modetolast_non_nullby default.
- Support View
Users can now create and query views using SQL syntax. This feature encapsulates complex logic into reusable virtual tables, offering better data security, performance optimization, and abstraction of data complexity.
The newly supported SQL syntax are as follows:
a. Creating a view
sqlCREATE [OR REPLACE] [IF NOT EXISTS] VIEW <view_name> AS <SELECT_statement>;b. Querying a view
sqlSELECT * FROM <view_name>;
- Support for Abbreviated Interval Expressions
In PR 4220 and 4182, we support abbreviated interval expressions, allowing shorthand representations. For example, y represents year. Other abbreviations include:
mon- monthw- week-d- day-m- minutes- secondms/millis- millisecondus- microsecondns- nanosecond
In interval expressions, abbreviations and full text can be mixed. For example:
sql
SELECT INTERVAL '7 days' - INTERVAL '1d';

+----------------------------------------------------------------------------------------------+
|IntervalMonthDayNano("129127208515966861312")-IntervalMonthDayNano("18446744073709551616")|
+----------------------------------------------------------------------------------------------+
|0 years 0 mons 6 days 0 hours 0 mins 0.000000000 secs                                        |
+----------------------------------------------------------------------------------------------+
It's also supported transforming abbreviations to interval expressions:
sql
SELECT '3y2mon'::INTERVAL;

+---------------------------------------------------------+
| IntervalMonthDayNano("3010670175542044828554670112768") |
+---------------------------------------------------------+
| 0 years 38 mons 0 days 0 hours 0 mins 0.000000000 secs  |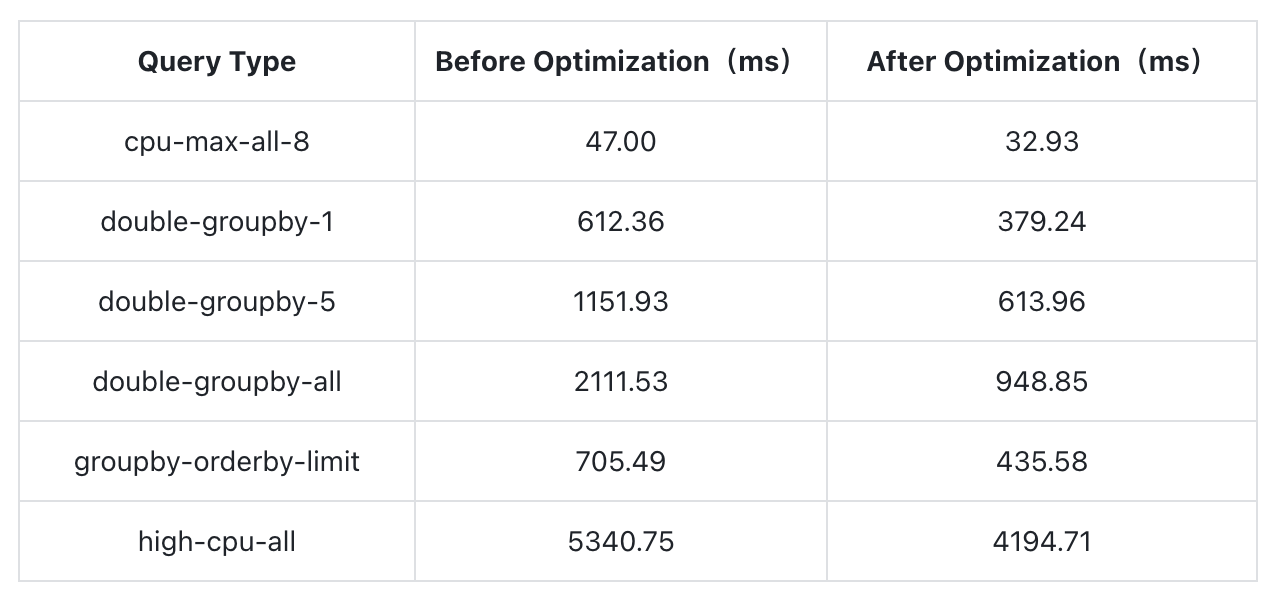
+---------------------------------------------------------+- Parallel Scan Optimization
Introduced partition parallel scanning capabilities, enabling parallel scans at the Row Group level under certain conditions, with scan speeds improving by up to 55%.
With a scan concurrency of 4, the optimization effects on certain queries are:
- gRPC Service Adds TLS Support
This PR enhances the security of the gRPC service by adding TLS support. gRPC Server TLS Configuration:
toml
[grpc.tls]
## TLS mode
mode = "enable"
## certificate file path
cert_path = "/path/to/certfile"
## key file path
key_path = "/path/to/keyfile"
## Monitoring changes to certificate and key files and automatically reloading them
watch = false- Support for Manual Compaction with Different Strategies
This PR introduces the ability to manually trigger different types of compaction using SQL commands. The newly supported SQL syntax is:
sqlSELECT COMPACT_TABLE(<table_name>, [<compact_type>], [<options>])Currently, the supported
compact_typeoptions include:regular: Triggers standard compaction similar to a flush operation.strict_window: Strictly divides SST files according to a specified time window.
The
<options>parameter can be used to configure specific compaction strategies. For example, forstrict_window, options specify the number of seconds in the compaction window:
rust
SELECT COMPACT_TABLE("monitor", "strict_window", "3600");Upgrade Guide
Given the significant changes in the new version, upgrading to v0.9 requires downtime. We recommend using our official upgrade tool for a smooth transition. Here's a general upgrade process:
- Create a fresh v0.9 cluster
- Stop traffic ingress to the old cluster (stop writing)
- Export table structure and data using the GreptimeDB CLI upgrade tool
- Import data into the new cluster using the GreptimeDB CLI upgrade tool
- Switch traffic ingress to the new cluster
For detailed upgrade instructions, please refer to: https://docs.greptime.com/user-guide/deployments-administration/upgrade
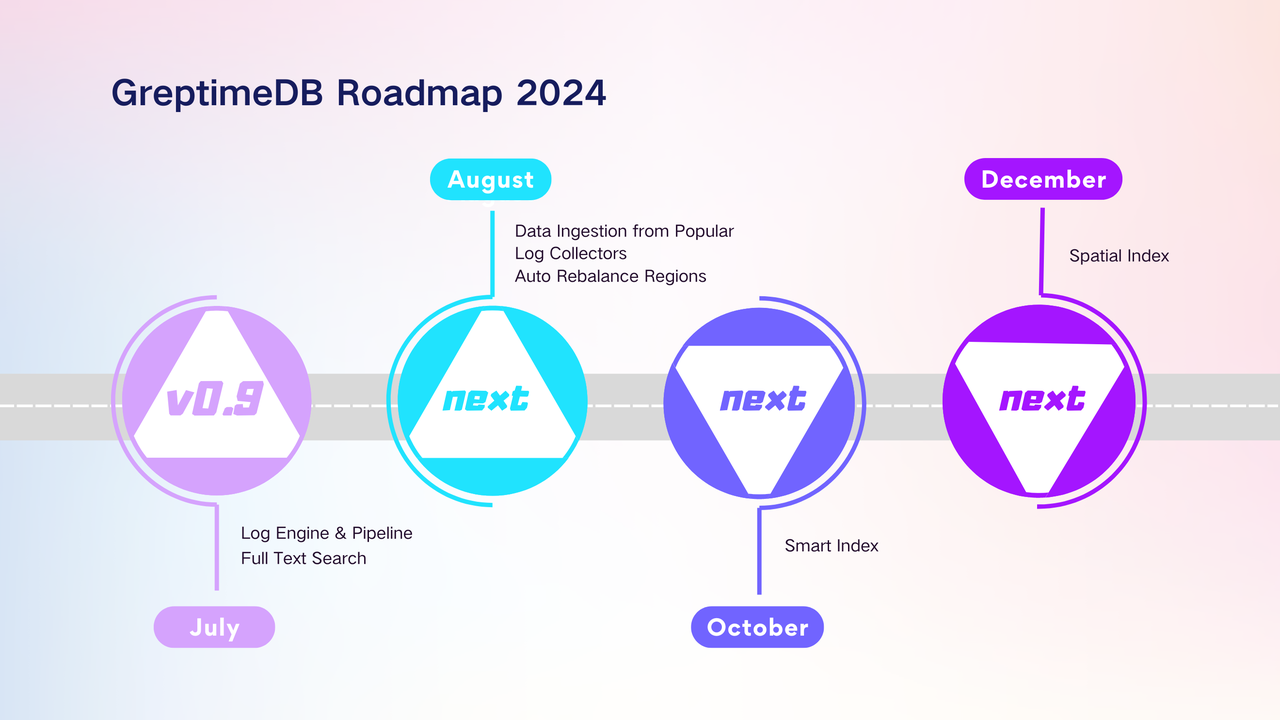
Future Outlook
GreptimeDB's short-term goal is to become a unified time-series database that integrates both Metrics and Logs. In the next version, we will continue refining the Log Engine to reduce transform overhead, optimize query performance, and expand the ecosystem with additional log collectors. Additionally, we may integrate the Log Engine with the Flow Engine for tasks such as parsing and extracting log contents.
About Greptime
Greptime offers industry-leading time series database products and solutions to empower IoT and Observability scenarios, enabling enterprises to uncover valuable insights from their data with less time, complexity, and cost.
GreptimeDB is an open-source, high-performance time-series database offering unified storage and analysis for metrics, logs, and events. Try it out instantly with GreptimeCloud, a fully-managed DBaaS solution—no deployment needed!
The Edge-Cloud Integrated Solution combines multimodal edge databases with cloud-based GreptimeDB to optimize IoT edge scenarios, cutting costs while boosting data performance.
Star us on GitHub or join GreptimeDB Community on Slack to get connected.


