On this page
Semantic Conventions in Observability
Semantic conventions provide agreed-upon meanings for words and phrases within a language or culture, facilitating clear communication. In programming, they are even more crucial because the lack of conversational cues makes misreading easy, complicating code maintenance. In the field of observability, semantic convention is equally important to ensure consistency and clarity.
Definition and Examples
Semantic conventions in observability are standardized sets of telemetry and attribute names. They define how users should name their observability data when monitoring common software or libraries.
For example, in a database-driven application, which is a widely adopted architecture in the industry, semantic conventions define standard names and value enumerations such as:
db.system: The database type (e.g.,mysqlorpostgresql)db.operation.name: The database operation (e.g.,SELECT)
These standardized names can be used across various observability data types:
- Metrics: As metric names or label names and values
- Logs/Events: As field names and values
- Traces: As event field or attribute field names and values
Industry Standards
Several widely-adopted semantic conventions in the industry include:
- Elastic common schema
- OpenTelemetry semantic conventions
- Datadog conventions
Concept Architecture: The V-Model
To illustrate the relationship between various observability concepts, we can use the V-model architecture.
As shown in the diagram below, the left half of the letter "V" represents the data collection chain, while the right half represents the data application chain. Data is collected and transmitted from the upper left side, then stored. From storage, it is accessed via query languages and APIs, and finally applied in monitoring products such as dashboards and alert systems.
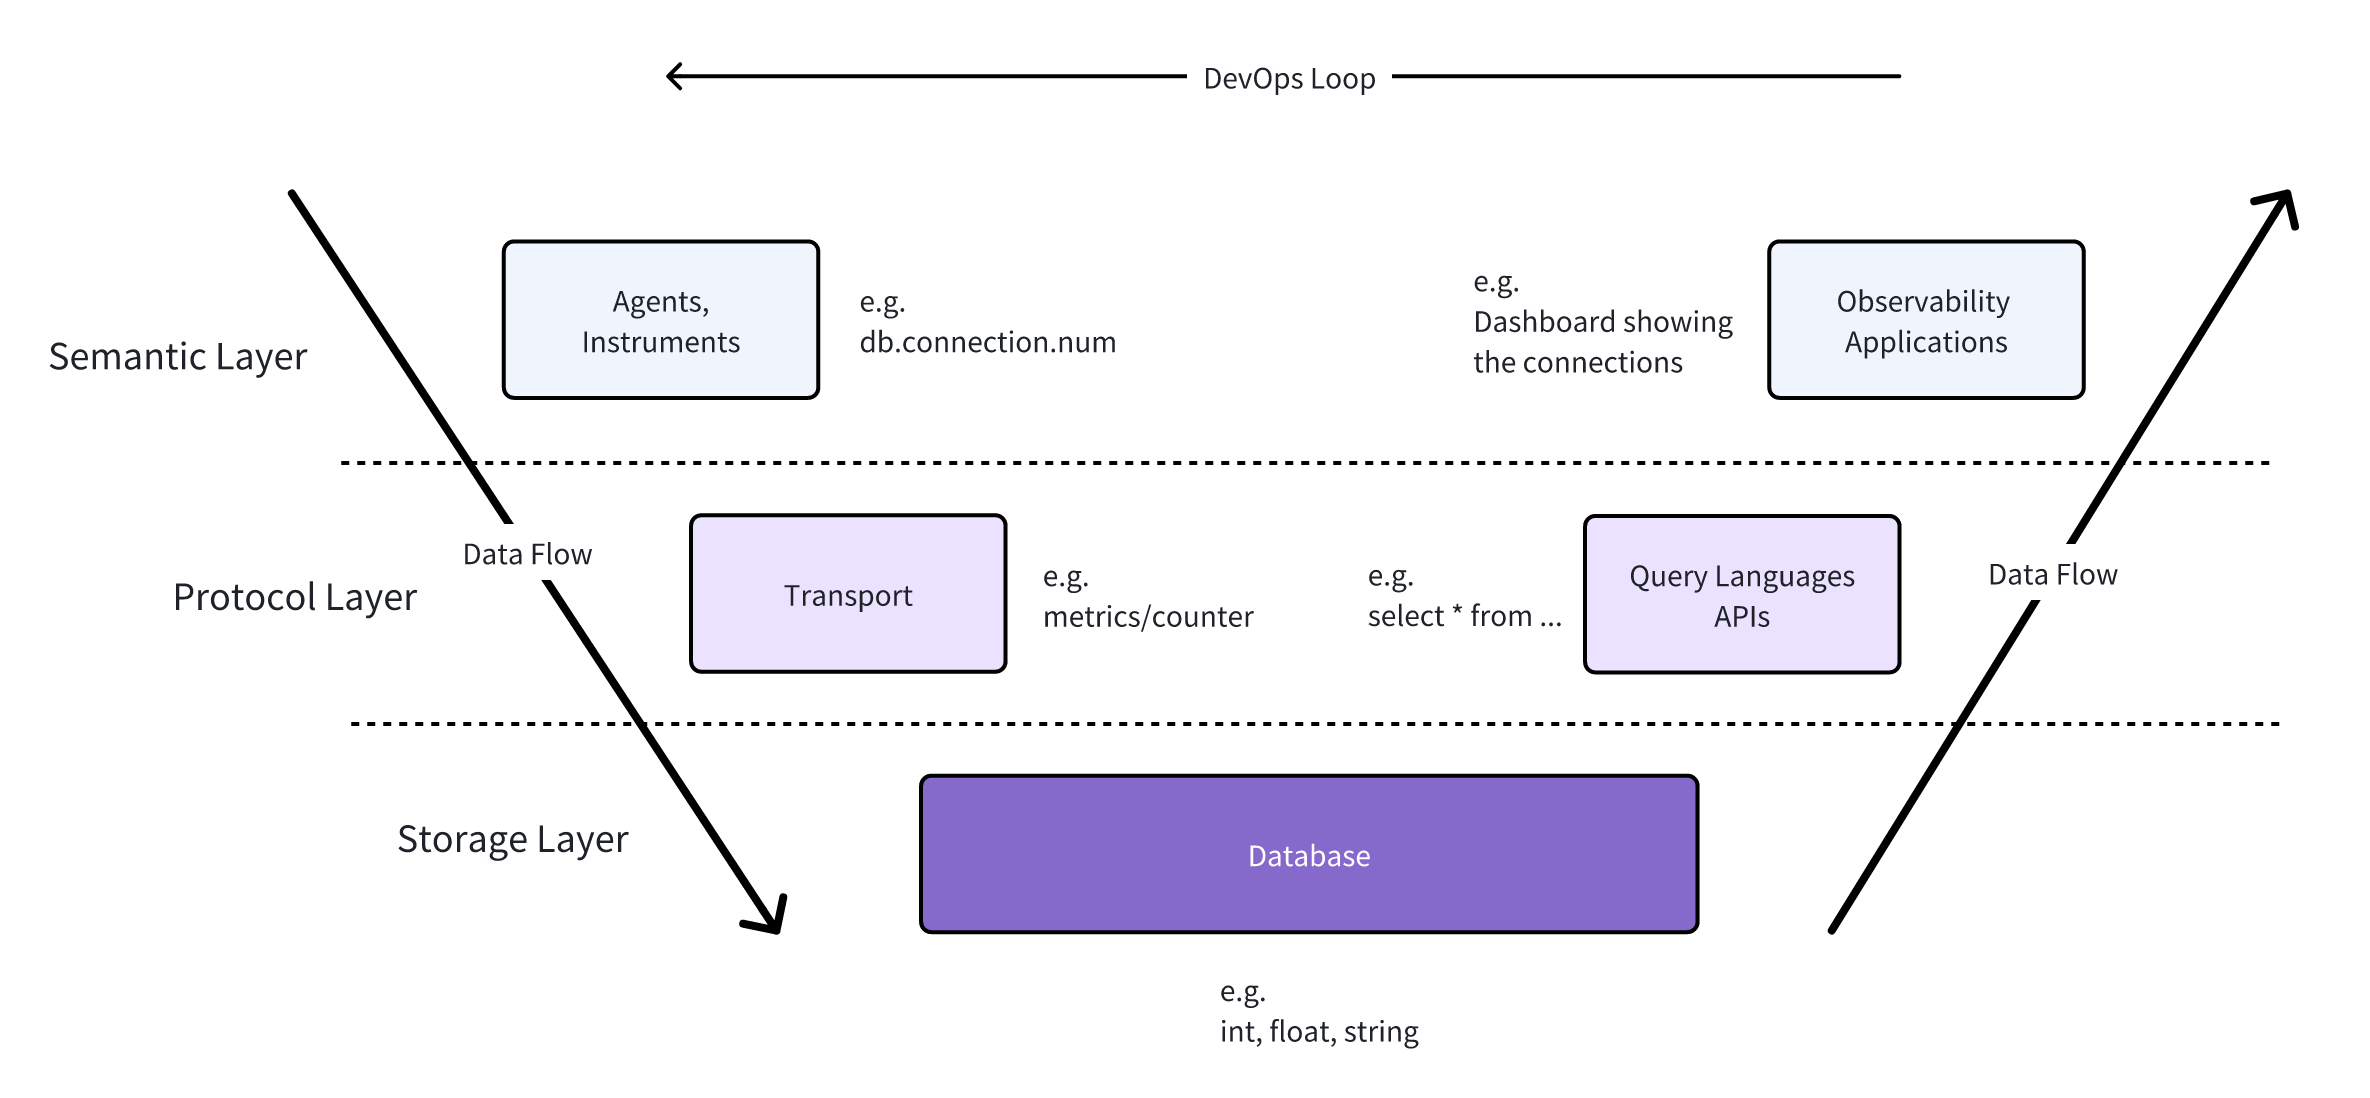
Semantic Layer
- Responsible for collecting data and providing data applications (analytics, dashboarding, alerting)
- Understands data and its meaning
- Example: A metric named
db.connection.pool.activerepresents active connections in the application's connection pool - Enables building domain-specific applications for data insights and suggestions
Protocol Layer
- Adds abstraction and is responsible for moving data from API/SDK via network to collectors
- Typically doesn't need to understand the meaning of particular values
- Deals with concepts like metrics (counters, histograms), logs, and traces
- Defines query languages and transport APIs for data extraction
- Most OpenTelemetry specifications focus on this layer
Storage Layer
- Simpler and sometimes agnostic to observability
- Views data by its model (time series or table) and data types (string, floats)
- Observability-focused databases may include features for efficient querying and data retrieval
Why semantic convention matters
Historically, the industry lacked a widely recognized standard for the semantic layer. This led to some issues like:
- Organizations defining their own metric names and labels
- Custom-built applications for dashboards and alerting
- Vendor lock-in (e.g., Datadog's proprietary conventions)
A standard semantic layer offers several benefits:
- Interoperability: Sharing agents and applications across different backends
- Consistency and ecosystem: Building standard observability solutions for common middleware and infrastructures
- Simplified Adoption: Organizations can leverage pre-built dashboards, alerts, and analytics that understand these conventions
- Enabling optimization of data storage and computation in other layers
How GreptimeDB works for semantic conventions
GreptimeDB, the time series database that works for various types of observability data like metrics, logs, and events, has benefited from the establishment of a well-defined semantic standard in the industry.
For instance, GreptimeDB has built-in ETL engine to parse unstructured logs into standard events. We recommend user to name your fields in Open Telemetry Standard Conventions, so in future you can benefit from standard dashboards and analytic products. We are also likely to provide upper layer applications on cloud for those compatible with the semantic standard. Stay tuned for future updates!
About Greptime
Greptime offers industry-leading time series database products and solutions to empower IoT and Observability scenarios, enabling enterprises to uncover valuable insights from their data with less time, complexity, and cost.
GreptimeDB is an open-source, high-performance time-series database offering unified storage and analysis for metrics, logs, and events. Try it out instantly with GreptimeCloud, a fully-managed DBaaS solution—no deployment needed!
The Edge-Cloud Integrated Solution combines multimodal edge databases with cloud-based GreptimeDB to optimize IoT edge scenarios, cutting costs while boosting data performance.
Star us on GitHub or join GreptimeDB Community on Slack to get connected.


