On this page
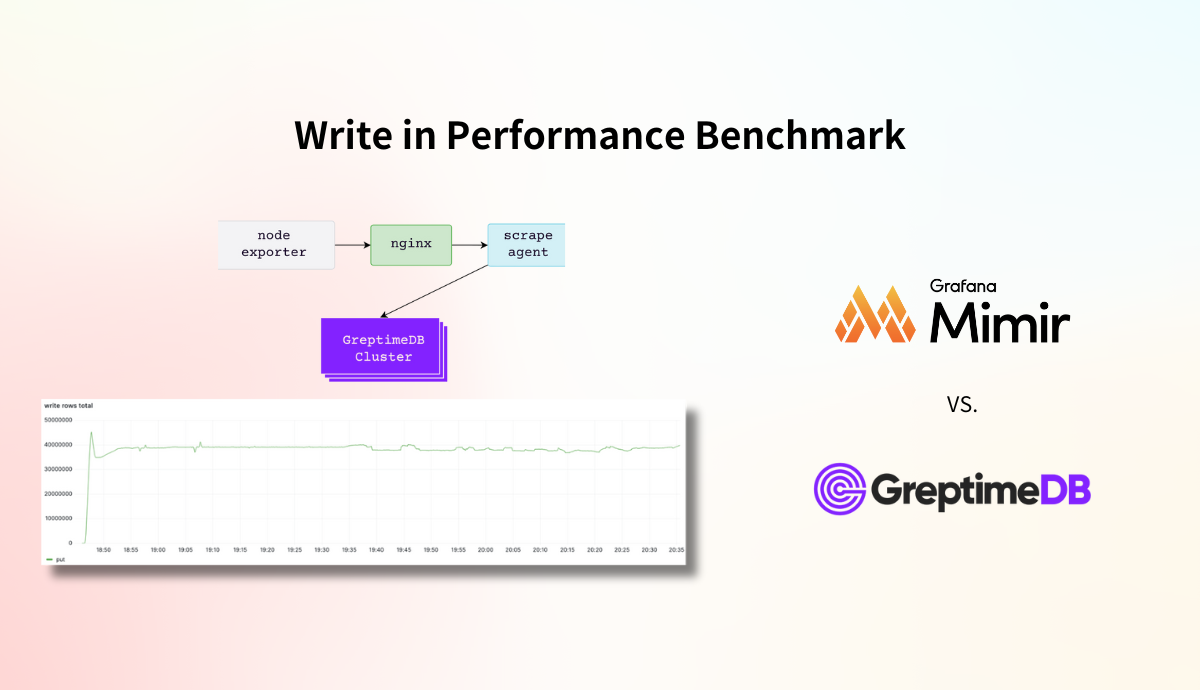
In the industry-standard Prometheus-Benchmark test, GreptimeDB handled approximately 40 million points per second with a single cluster of 100 nodes, each with 8 cores and 16 GB of memory. At peak load, the datanodes sustained CPU usage at 38% and memory usage at 40%. The system managed a total of 610 million active time series, updating 6.15 million time series every ten minutes, maintaining stable write performance throughout the entire 1.5-hour test period.
The test results indicate that GreptimeDB's architecture can support extremely large-scale cluster while maintaining very low resource usage. In contrast, Grafana Mimir, which also utilizes object storage, requires more than five times the CPU and memory resources to handle the same data scale (based on Mimir's test report calculations).
Test Environment and Tools
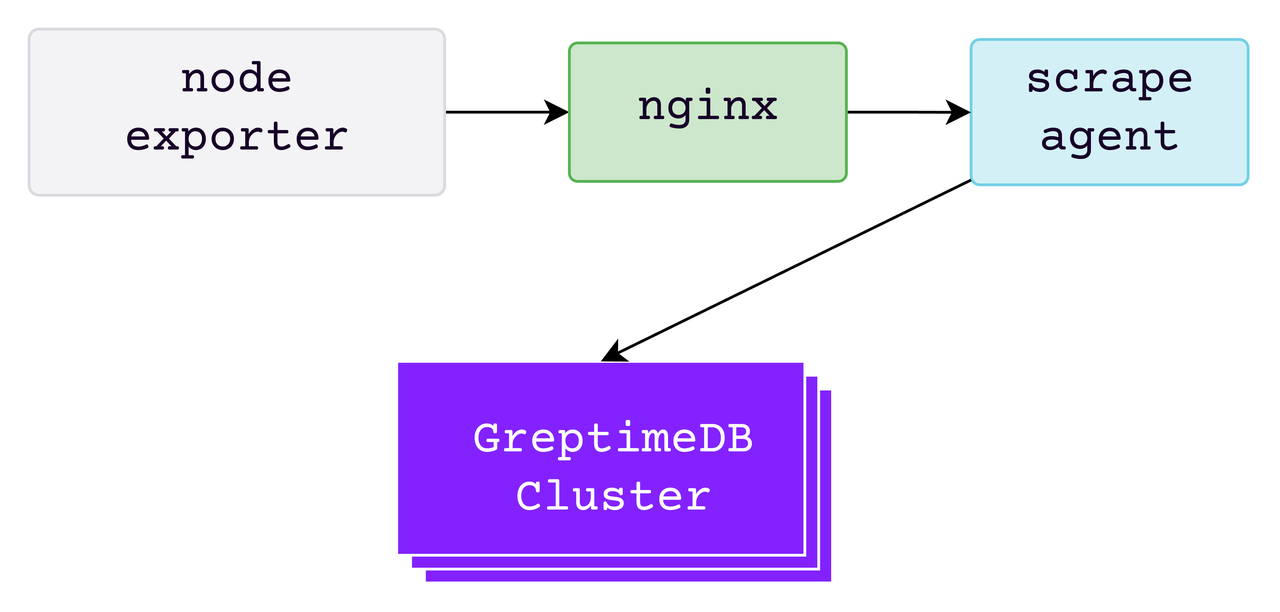
Test Tools The key parameters and explanations for the Prometheus Benchmark stress testing tool used in the testing are as follows:
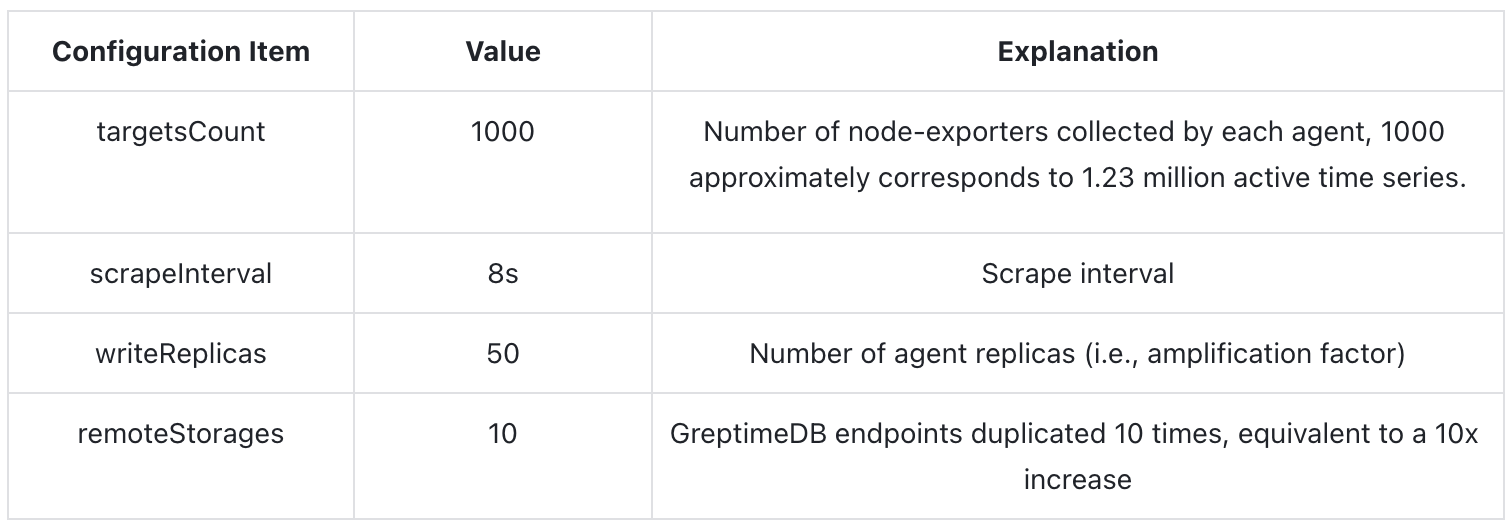
With the above configuration, the final theoretical data generation rate is approximately 41.6 million points per second.
Test Environment There are two clusters in the test environment: the Prometheus Benchmark TestSuite and the GreptimeDB database cluster. Both clusters are deployed on AWS EKS. The image version used by the GreptimeDB cluster is v0.8.2. The deployment specifications and numbers for the components involved are as follows:
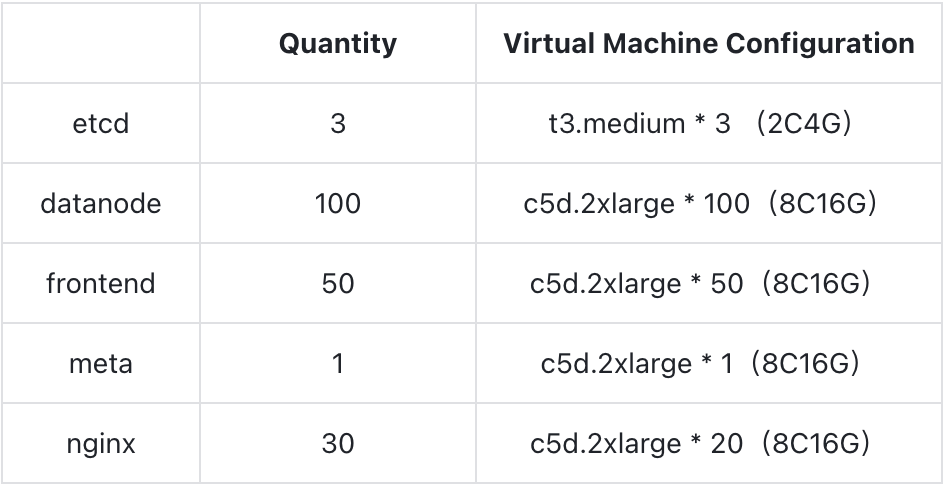
The WAL component of the GreptimeDB cluster uses AWS EBS; SST flush and compaction are both performed on S3. The local disk specification is GP3, and the S3 class is Standard within the same region. This test does not include scenarios involving node scheduling or migration. Data partitions are evenly distributed among nodes using a Round-Robin Selector, with a total of 200 regions.
Detailed Testing Data
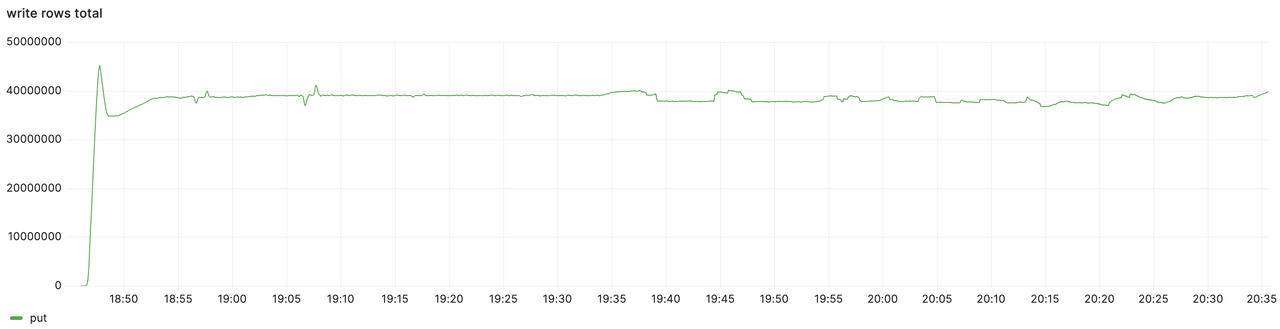
Write Throughput
The test lasted for approximately 1.5 hours. The total write volume and the per-node write volume monitoring data are as follows. It can be observed that during the 1.5 hours, the cluster's write throughput consistently maintained a stable rate of approximately 40 million points per second.
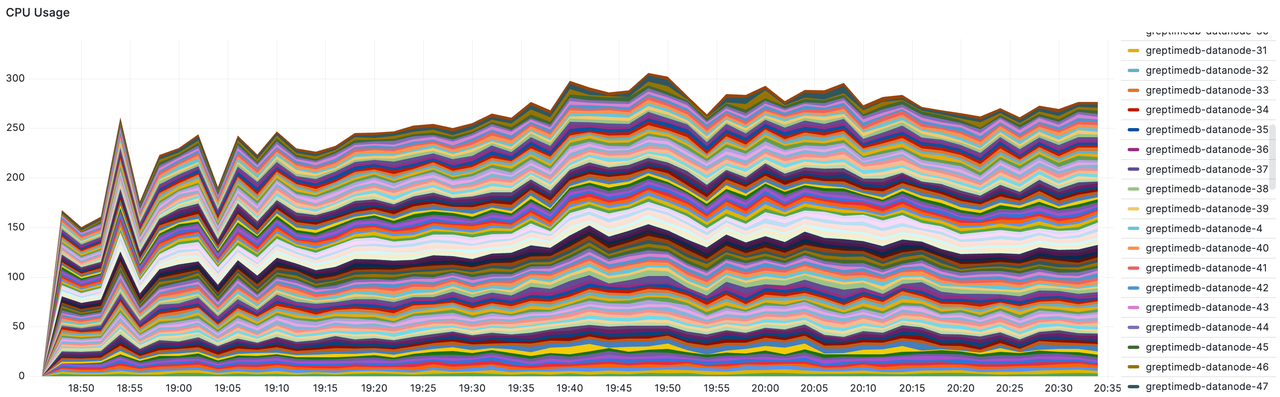
Resource Utilization
Observation of the GreptimeDB cluster's resource utilization yields the following data:
- Datanode's total CPU usage: With a total of 100 nodes each having 8 cores (800 cores in total), the peak usage reached 305 cores, approximately 38%.
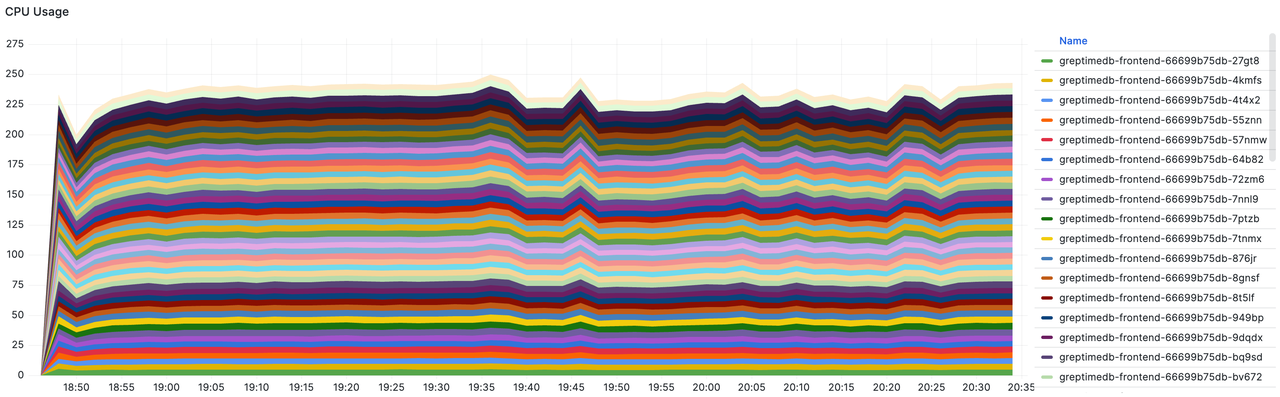
- Frontend's total CPU usage: With a total of 50 nodes each having 8 cores (400 cores in total), the peak usage reached 250 cores, approximately 63%.
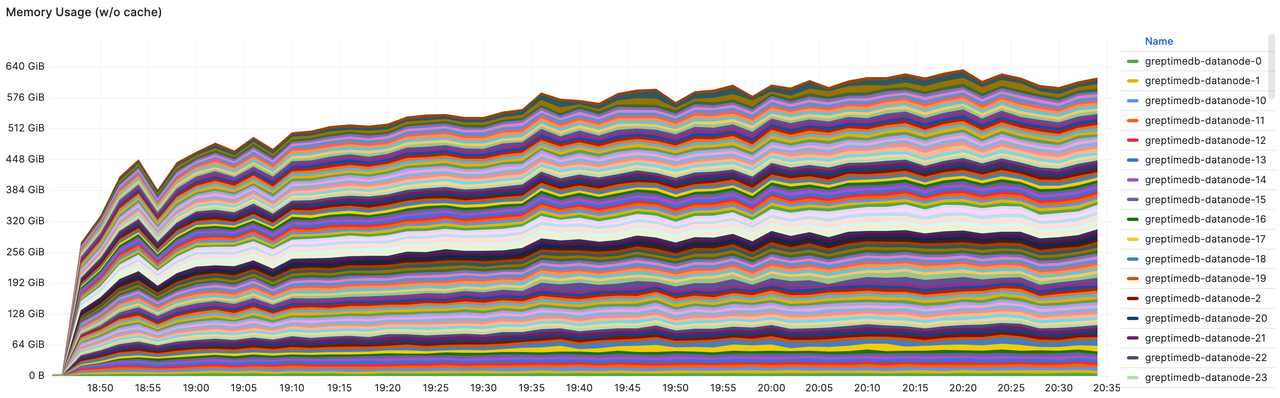
- Datanode's total memory usage: With a total memory capacity of 100 nodes each having 16 GiB (1600 GiB in total), the peak usage reached 640 GiB, approximately 40%.
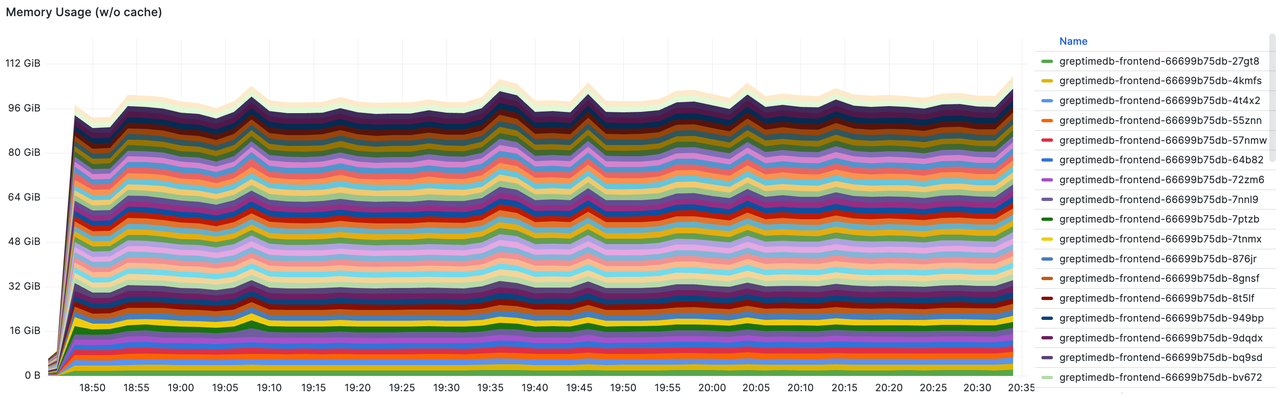
- Frontend's total memory usage: With a total memory capacity of 50 nodes, each having 16 GiB (800 GiB in total), the peak usage reached 110 GiB, approximately 14%.
Storage Write Throughput
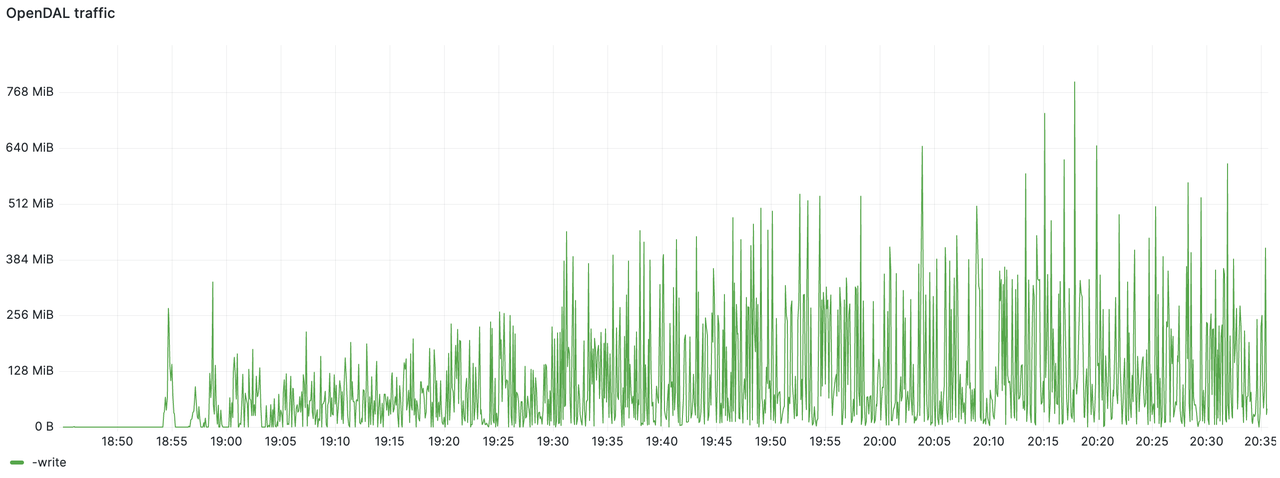
The following figure shows the S3 write throughput statistics. The bandwidth usage was mostly below 512 MiB/s, with a total write volume of 2.8 TiB over the 1.5-hour period.
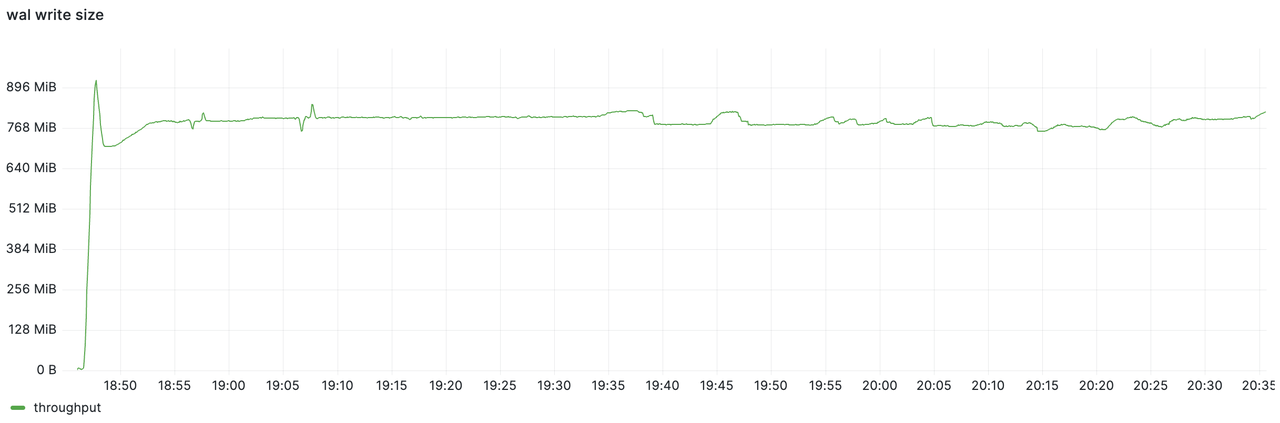
The WAL component observed a write throughput of approximately 800 MiB/s. By comparing the two figures, it can be seen that GreptimeDB effectively compressed the data, achieving a compression ratio of 75%, thereby reducing the data flush throughput. As a result, the S3 directory size at the stress test was significantly less than 1 TiB.
Conclusion
A 100-node cluster is far from the upper limit; this test has verified the unlimited scalability of GreptimeDB's architecture. Compared to Grafana Mimir, which is also based on object storage, GreptimeDB demonstrates a 5x reduction in resource consumption.
We will continue optimizing performance and conducting further tests to enable GreptimeDB to handle massive volumes of time-series data for reading, writing, and analysis. The version tested in this round was v0.8.2. Since then, GreptimeDB has released version v0.9.0, which introduces a log engine and full-text search capabilities, further enhancing performance and stability. This marks a significant step towards becoming a unified time-series database that integrates metrics, logs, and events. You're all welcomed to test GreptimeDB nad all feedback is welcomed!
About Greptime
Greptime offers industry-leading time series database products and solutions to empower IoT and Observability scenarios, enabling enterprises to uncover valuable insights from their data with less time, complexity, and cost.
GreptimeDB is an open-source, high-performance time-series database offering unified storage and analysis for metrics, logs, and events. Try it out instantly with GreptimeCloud, a fully-managed DBaaS solution—no deployment needed!
The Edge-Cloud Integrated Solution combines multimodal edge databases with cloud-based GreptimeDB to optimize IoT edge scenarios, cutting costs while boosting data performance.
Star us on GitHub or join GreptimeDB Community on Slack to get connected.


