On this page
Prometheus is an open-source monitoring and alerting system used for collecting and processing time-series data. It is commonly integrated with other tools, such as Grafana, to provide visualization and analysis capabilities.
However, Prometheus has limited storage capacity, so when dealing with large volumes of time-series data, external storage is needed to extend its functionality. GreptimeDB is a distributed database specifically designed for time-series data, featuring high performance, high availability, and scalability.
In this tutorial, you will learn how to set up GreptimeDB as long-term storage for Prometheus.
Installing GreptimeDB
First, you need to install GreptimeDB. You can download the binary files according to your operating system from the download page and follow the installation instructions. In this tutorial, we will use Docker to install the standalone version of GreptimeDB:
sql
docker run -p 127.0.0.1:4000-4003:4000-4003 \
-v "$(pwd)/greptimedb:/tmp/greptimedb" \
--name greptime --rm \
greptime/greptimedb:v0.9.1 standalone start \
--http-addr 0.0.0.0:4000 \
--rpc-addr 0.0.0.0:4001 \
--mysql-addr 0.0.0.0:4002 \
--postgres-addr 0.0.0.0:4003
If everything goes well, open the browser and visit http://localhost:4000/dashboard/, you'll see the built-in GreptimeDB Dashboard. Here, you can view table information, run queries, and more.
If you have a large volume of data, we recommend using the GreptimeDB cluster version, which offers unlimited horizontal scalability. Please read this performance benchmark report for more details.
For more GreptimeDB installation instructions, please refer to our documentation.
Configuring Prometheus
The next step is to configure Prometheus to use GreptimeDB as external storage. You can download Prometheus here, select the version that corresponds to your operating system and processor architecture. For example, I am using the Mac Arm64 system:
bash
curl -fsSL -O \
  https://github.com/prometheus/prometheus/releases/download/v2.53.1/prometheus-2.53.1.darwin-arm64.tar.gz
Then decompress the file and navigate to the Prometheus installation directory:
bash
tar zxvf prometheus-2.53.1.darwin-arm64.tar.gz
cd prometheus-2.53.1.darwin-arm64
Open the Proemtheus configuration file (prometheus.yml) and add the following content in the end:
yaml
remote_write:
  - url: http://localhost:4000/v1/prometheus/write?db=public
remote_read:
  - url: http://localhost:4000/v1/prometheus/read?db=public
Data is written to public database by default.
Launch Prometheus
After completing the configuration, start Prometheus by executing the following command in the terminal:
text
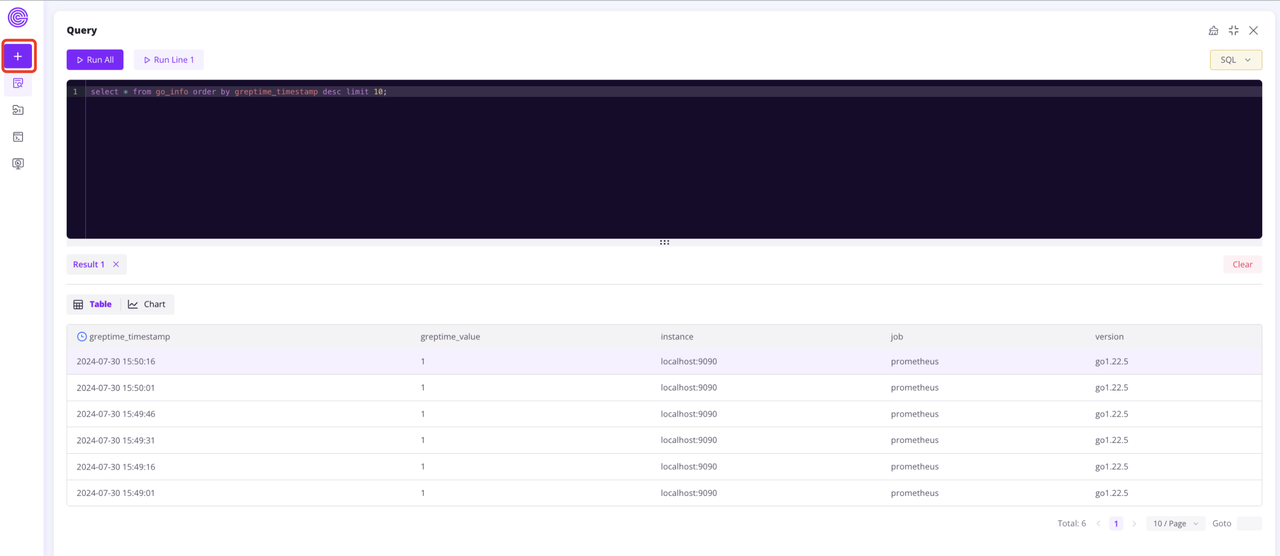
./prometheus --config.file=./prometheus.ymlRefresh the dashboard page (http://localhost:4000/dashboard/), you'll see that the Prometheus data has already been written-in.
For more information on mapping the data model from Prometheus to GreptimeDB, please refer to the documentation.
Configure Grafana to Directly Access GreptimeDB
After completing the first three steps, you have already configured GreptimeDB as the external storage backend for Prometheus. You can further enhance performance by connecting Grafana directly to GreptimeDB. Since GreptimeDB natively supports PromQL, this setup bypasses the Prometheus Remote Read protocol, resulting in better performance and lower latency.
Start a Grafana instance using Docker:
bash
docker run -d -p 3000:3000 --name=grafana --rm grafana/grafana-ossOpen your browser and visit http://localhost:3000/login to access and log in to Grafana. The default username and password are both admin.
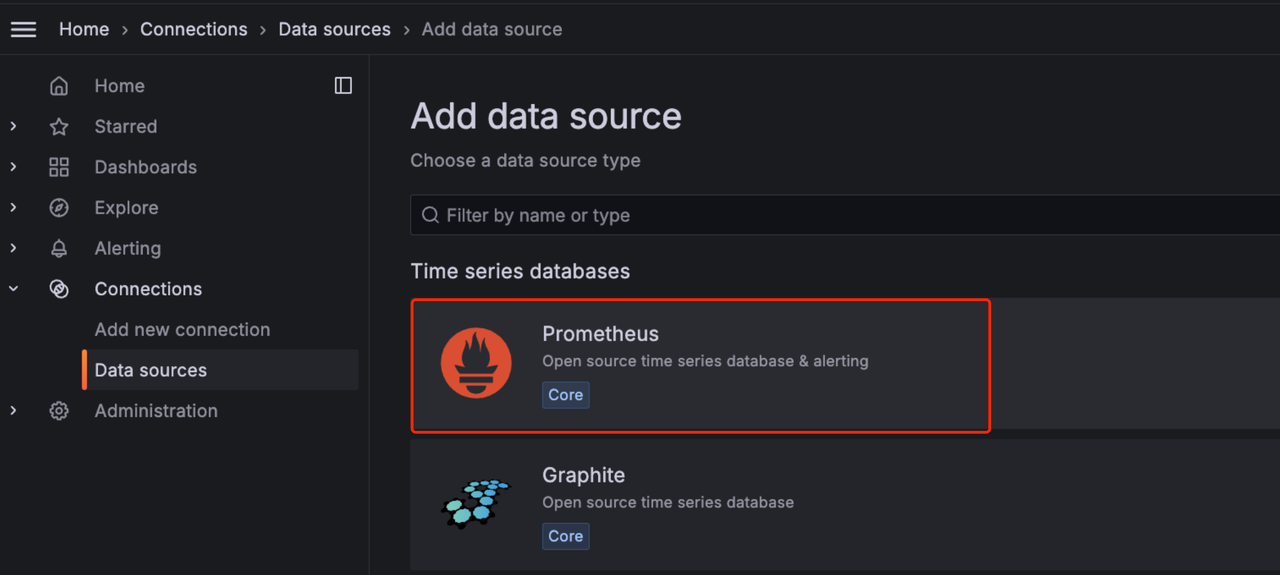
Create a new data source in http://localhost:3000/connections/datasources/new, and select the Prometheus data source:
Find the IP of GreptimeDB container using the command below:
bash
docker inspect greptime | grep IPAddressIf the output is the following:
yaml
"SecondaryIPAddresses": null,
"IPAddress": "172.17.0.3",
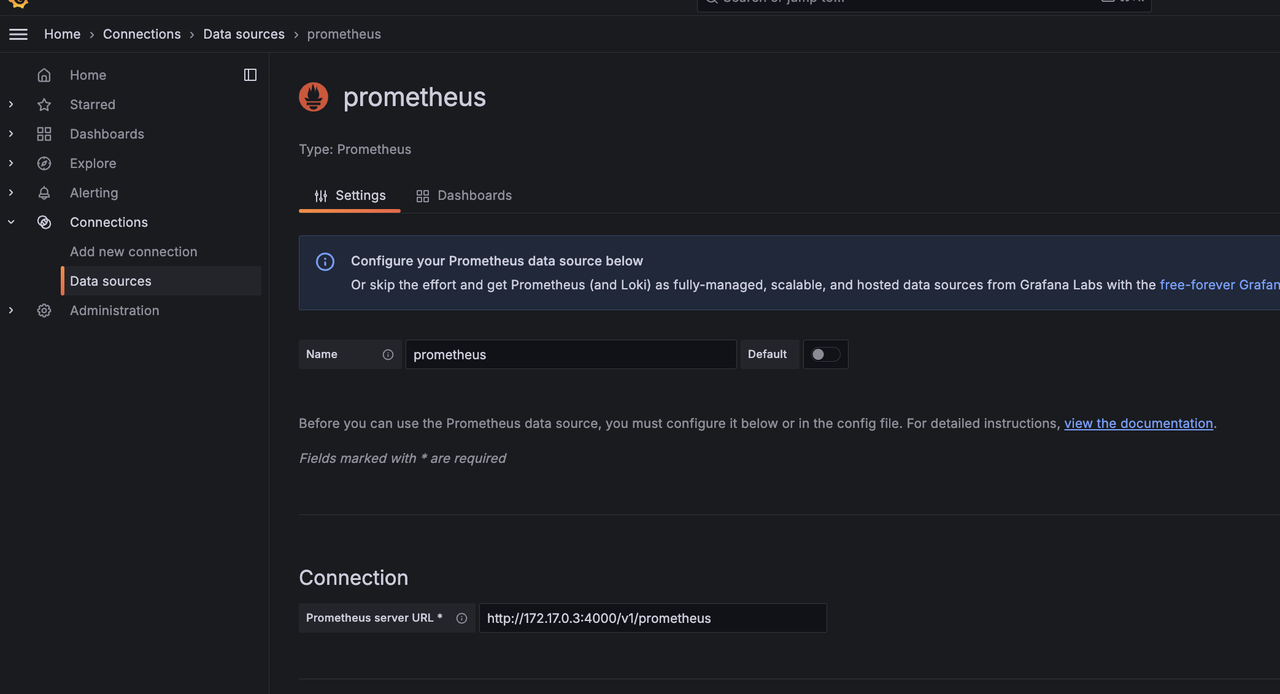
"IPAddress": "172.17.0.3",Next, set the GreptimeDB server URL to: http://172.17.0.3:4000/v1/prometheus. Be sure to replace this with the correct IP address output from your setup. Click Save & Test to verify the connection is working correctly.
Now, let's create a Dashboard. We will import one to get started. Navigate to the import menu at http://localhost:3000/dashboard/import.
Since this tutorial focuses on collecting Prometheus metrics only, let's import the Prometheus 2.0 Overview" dashboard for monitoring Prometheus itself.
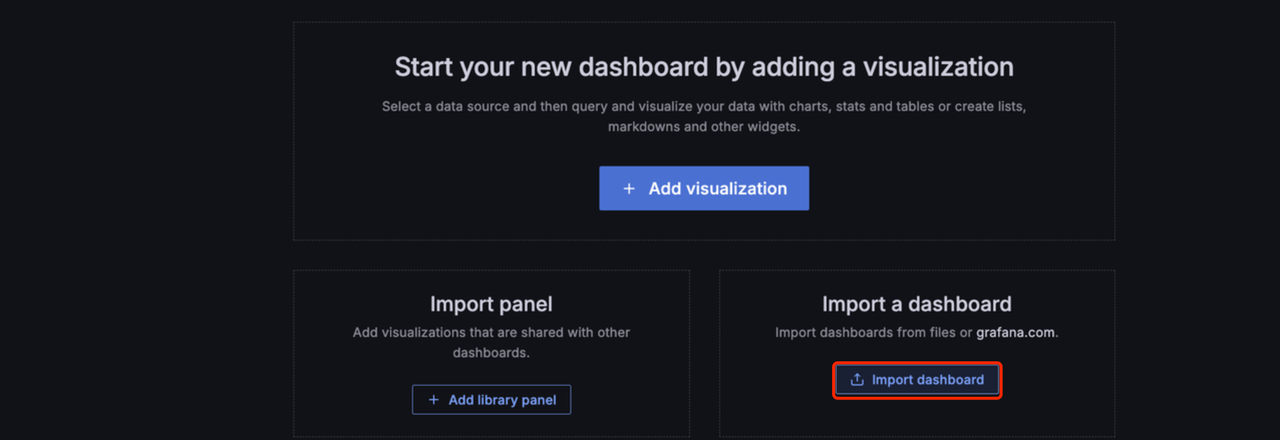
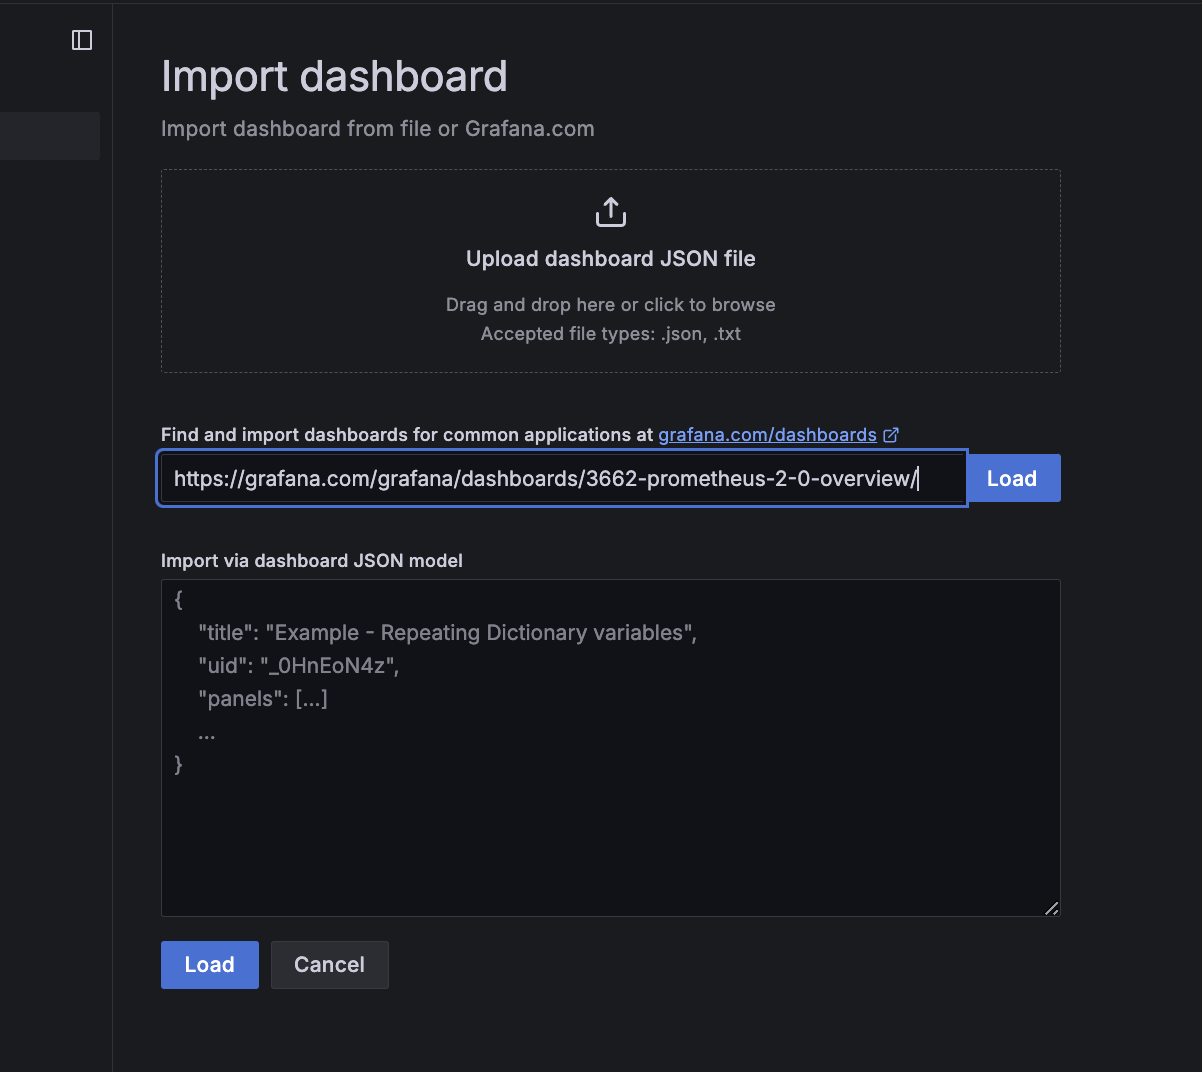
The import URL: https://grafana.com/grafana/dashboards/3662-prometheus-2-0-overview/
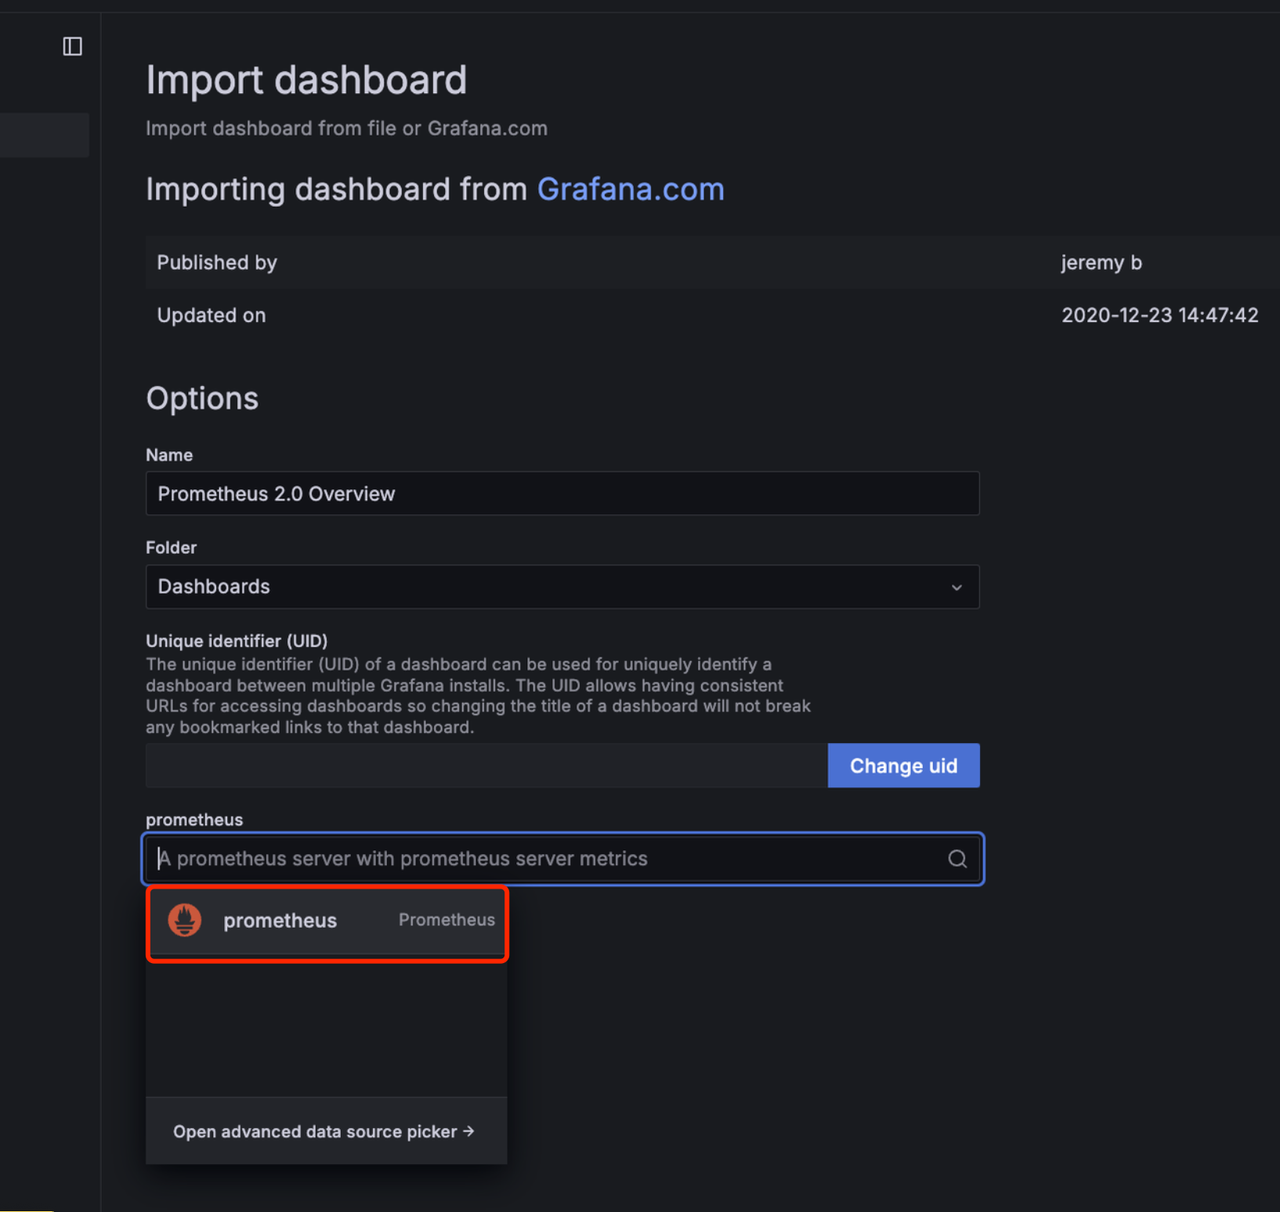
Select Prometheus, which we just created, as the data source:
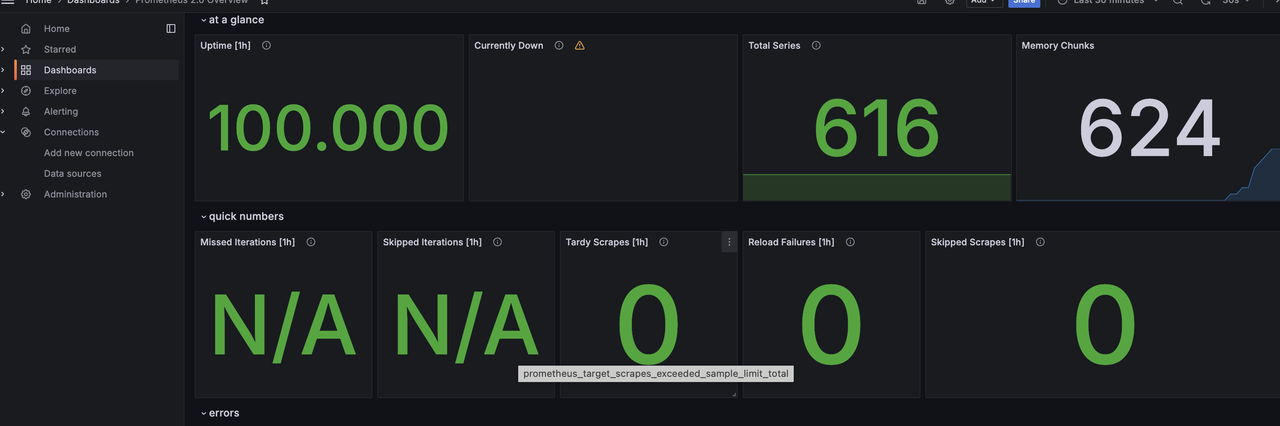
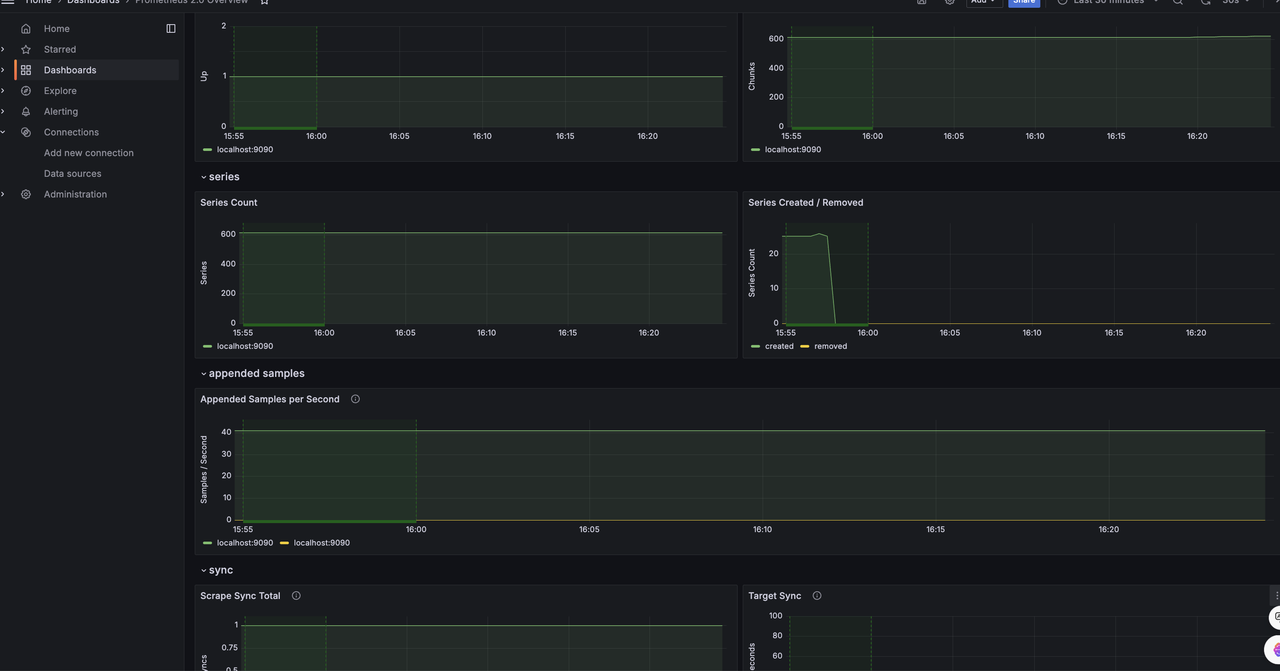
Now, you should see the monitoring dashboard of Prometheus:
For more information about GreptimeDB, please refer to the official documentation.
If you prefer not to deploy your own GreptimeDB instance, we invite you to try our fully managed database service, GreptimeCloud.
About Greptime
Greptime offers industry-leading time series database products and solutions to empower IoT and Observability scenarios, enabling enterprises to uncover valuable insights from their data with less time, complexity, and cost.
GreptimeDB is an open-source, high-performance time-series database offering unified storage and analysis for metrics, logs, and events. Try it out instantly with GreptimeCloud, a fully-managed DBaaS solution—no deployment needed!
The Edge-Cloud Integrated Solution combines multimodal edge databases with cloud-based GreptimeDB to optimize IoT edge scenarios, cutting costs while boosting data performance.
Star us on GitHub or join GreptimeDB Community on Slack to get connected.


