On this page
Prometheus is a monitoring system that plays a crucial role in the observability space - providing a platform for teams to understand what is going on across a given network. Prometheus provides a data model, time series database, polling mechanism, and vast ecosystem of open source tools that developers can harness to accomplish this difficult goal of tracking the state of their network.
While Prometheus’s lightweight and modular architecture has contributed to the development of its large ecosystem, it has led to some well known shortcomings to meet the requirements of Development Operations - One such shortcoming is the Long Term Storage Problem. Prometheus has limited storage provisions for the metrics it collects.
📍
Prometheus only provides local storage for the metrics it collects. Queries running directly against the Prometheus server will only have a very limited amount of history in scope. Greptime fixes this.
Although some industry solutions like Thanos, Cortex, and Mimir exist to supply long term storage, Greptime fills this need in a much more efficient way, using just a fraction of the compute, without sacrificing any of the compatibility with the surrounding ecosystem that practitioners rely on.
Why is long term storage needed for Prometheus?
Prometheus makes the prudent decision to focus heavily on its main value proposition - providing a system to scrape exposed metrics off of servers in a reliable and predictable way. One result of this decision is that Prometheus only provides the local storage of the server its deployed on, large scale deployments streaming hundreds of GBs of metrics per day, or utilizing multiple different Prometheus servers will only be able to retain a small subset of the data that they might want to capture. This will be problematic as reporting and alerting often requires longer term comparisons that exceed the short retention history provided by a single Prometheus Server. Prometheus has a dead simple way to provide support for those use cases.
📍
Prometheus exposes the pivotal remote-write protocol interface, which handles pushing reported metrics into a remote server for long term retention
The remote server stores all of the long term data for Prometheus, so when the time comes for a consumer downstream to query the data for reporting, the downstream host provides the long term data. Tackling the long term storage related tasks of compressing, storing, and querying all the Prometheus metrics has spawned many tools in this competitive landscape
Balancing cost, performance, and scalability in current metrics solutions
Due to the massive volumes of data required to reliably monitor large networks, the industry has taken advantage of the cheap, ubiquitous object stores found in cloud providers around the world. Object storage's lack of structure requires meticulous design and engineering to extract the performance necessary to read all of that data back out for reporting purposes in a reasonably short amount of time. Modern software engineering practices for distributed systems and scalability demands influenced the development of the proliferation of components and designs that followed.
📍
Long Term Storage solutions must balance cost, performance, and maintainability while tackling the arduous task of storing huge volumes of data for downstream reporting systems to query
Sidecars, Receivers, Compactors, Gateways, Rulers... While the preceding items might seem like a shopping list at your local hardware store, its actually a list of common components found within many of these long term storage solutions in order to meet the above challenge. Some argue that compartmentalizing the different functionalities allows teams to customize the scale of their overall deployment for their use case. For example, if operating requirements demand lower volume of writing data but heavier volume of reading data, a deployment can dedicate less resources to the ingester and more to the querier. Cortex, Mimir, and Thanos have largely coalesced around similar solutions to solving these scalability challenges as shown below
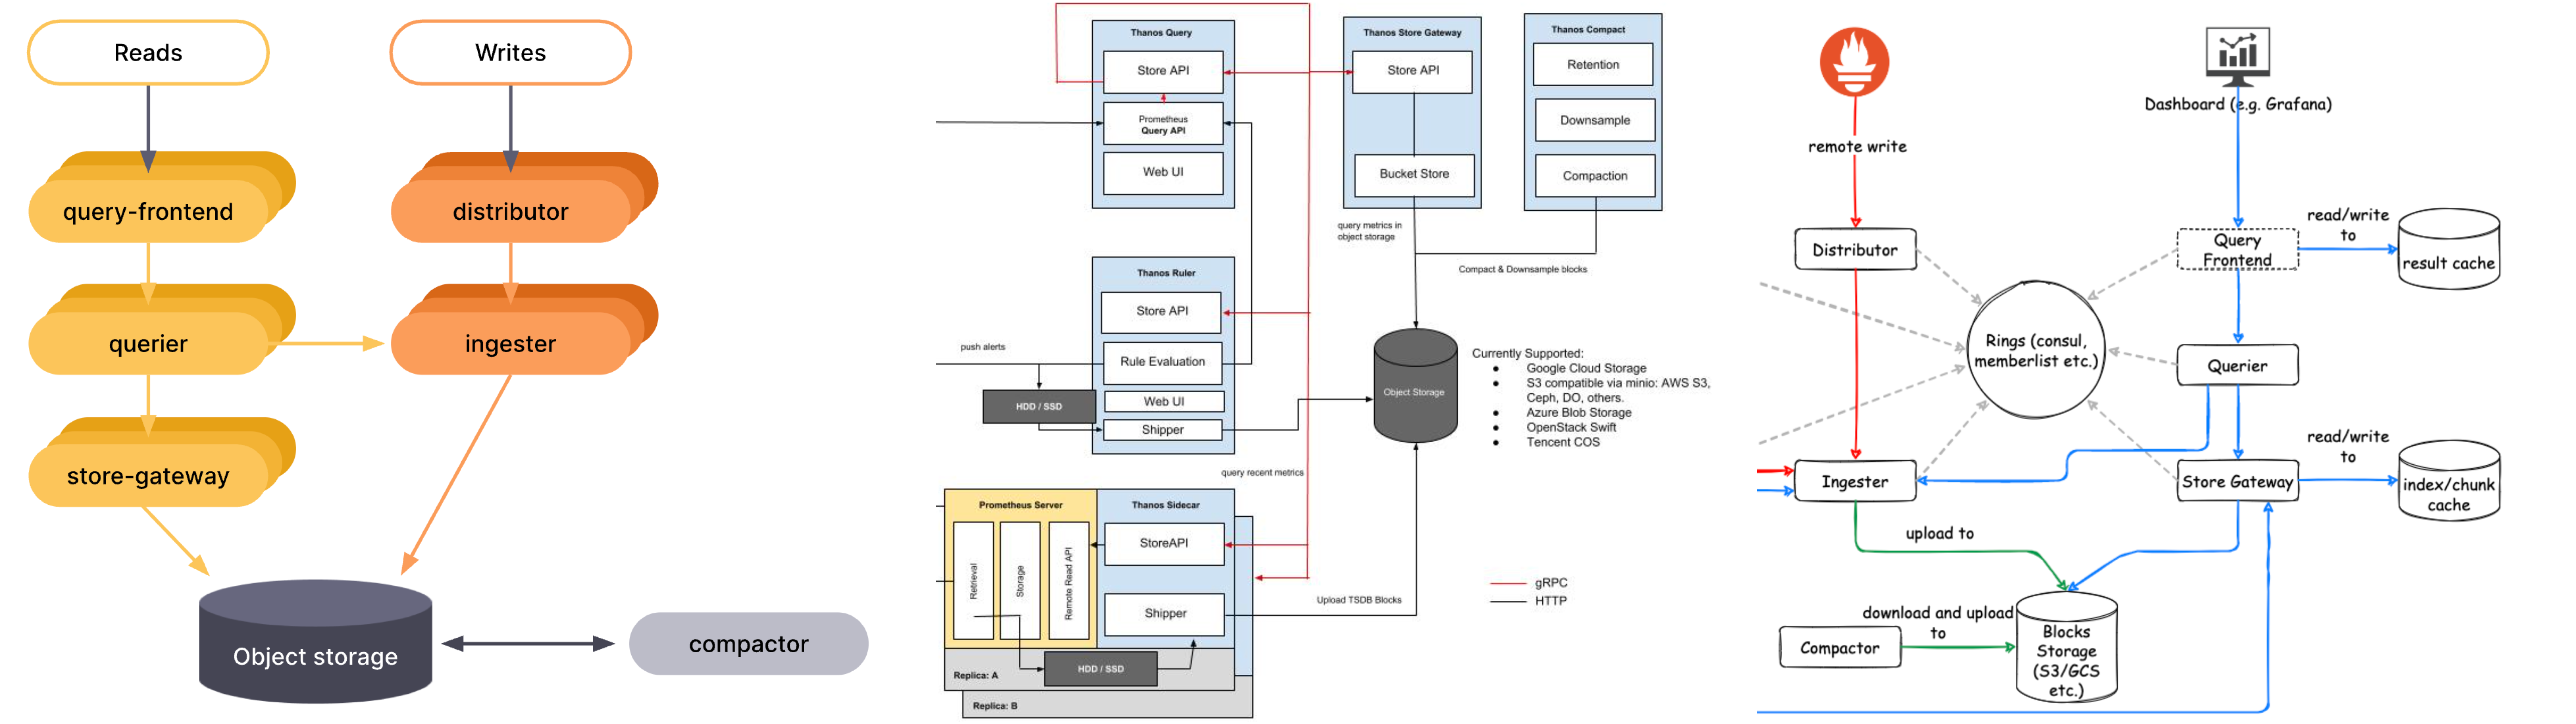
These diagrams, as well as some of the more recent updates to these long term storage solutions, highlight one thing about the maddening world of micro-service oriented frameworks - They are often times overly complex. Each additional service requires maintaining ACLs, Ports, DNS, Routing Tables, Monitoring, and the list goes on to contribute to the factorial level of complexity required to operate these advanced networks.
You can see from the architecture diagrams that all of these components can be mapped to the following critical functions:
- Compressing and storing data
- Querying historical data
- Managing the distribution of workloads
How can users strike a balance between the overbearing complexity of these micro services oriented frameworks and the rigid and restrictive nature of a Monolith deployment? Greptime has the answer. With just three components, Greptime handles all of the critical functions of a long term storage in a simple, yet scalable way:
metasrv: the controller of the deployment; hosting db, table, and cluster information to help route requests
frontend: a proxy like service that accepts and translates incoming requests and uses information stored in metasrv to forward the properly formatted requests to their target destination
datanode: executes the incoming requests from frontend against the data stored in the object store
📍
Greptime's three-component architecture strikes a perfect balance of creating a robust scalable architecture, while keeping complexity at an acceptable level.
This architecture has been so well regarded that Mimir, one of the largest players in the space, has deployed a similar architecture in experimental mode. Victoria Metrics, one of the other new entrants with impressive metrics has a similar three pronged architecture. But does Greptime sacrifice performance, or cost to provide this simplicity? Actually the opposite is true.
Greptime focuses on efficiency and compatibility when storing time-series data
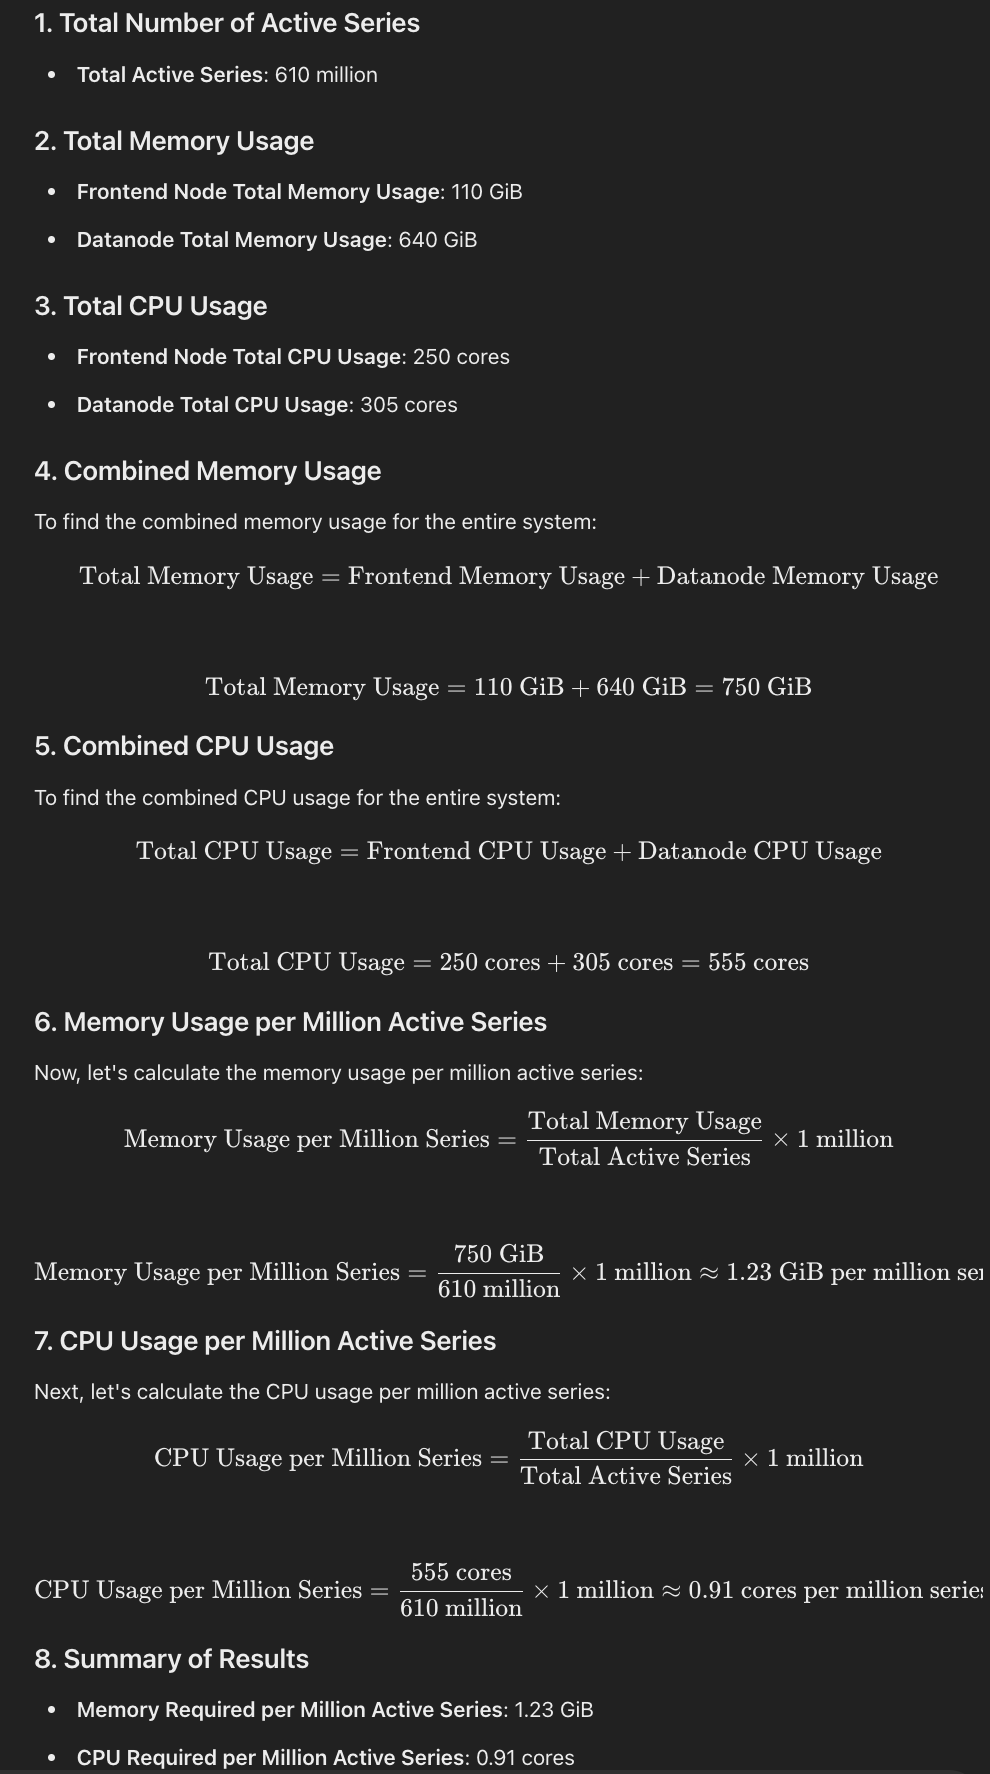
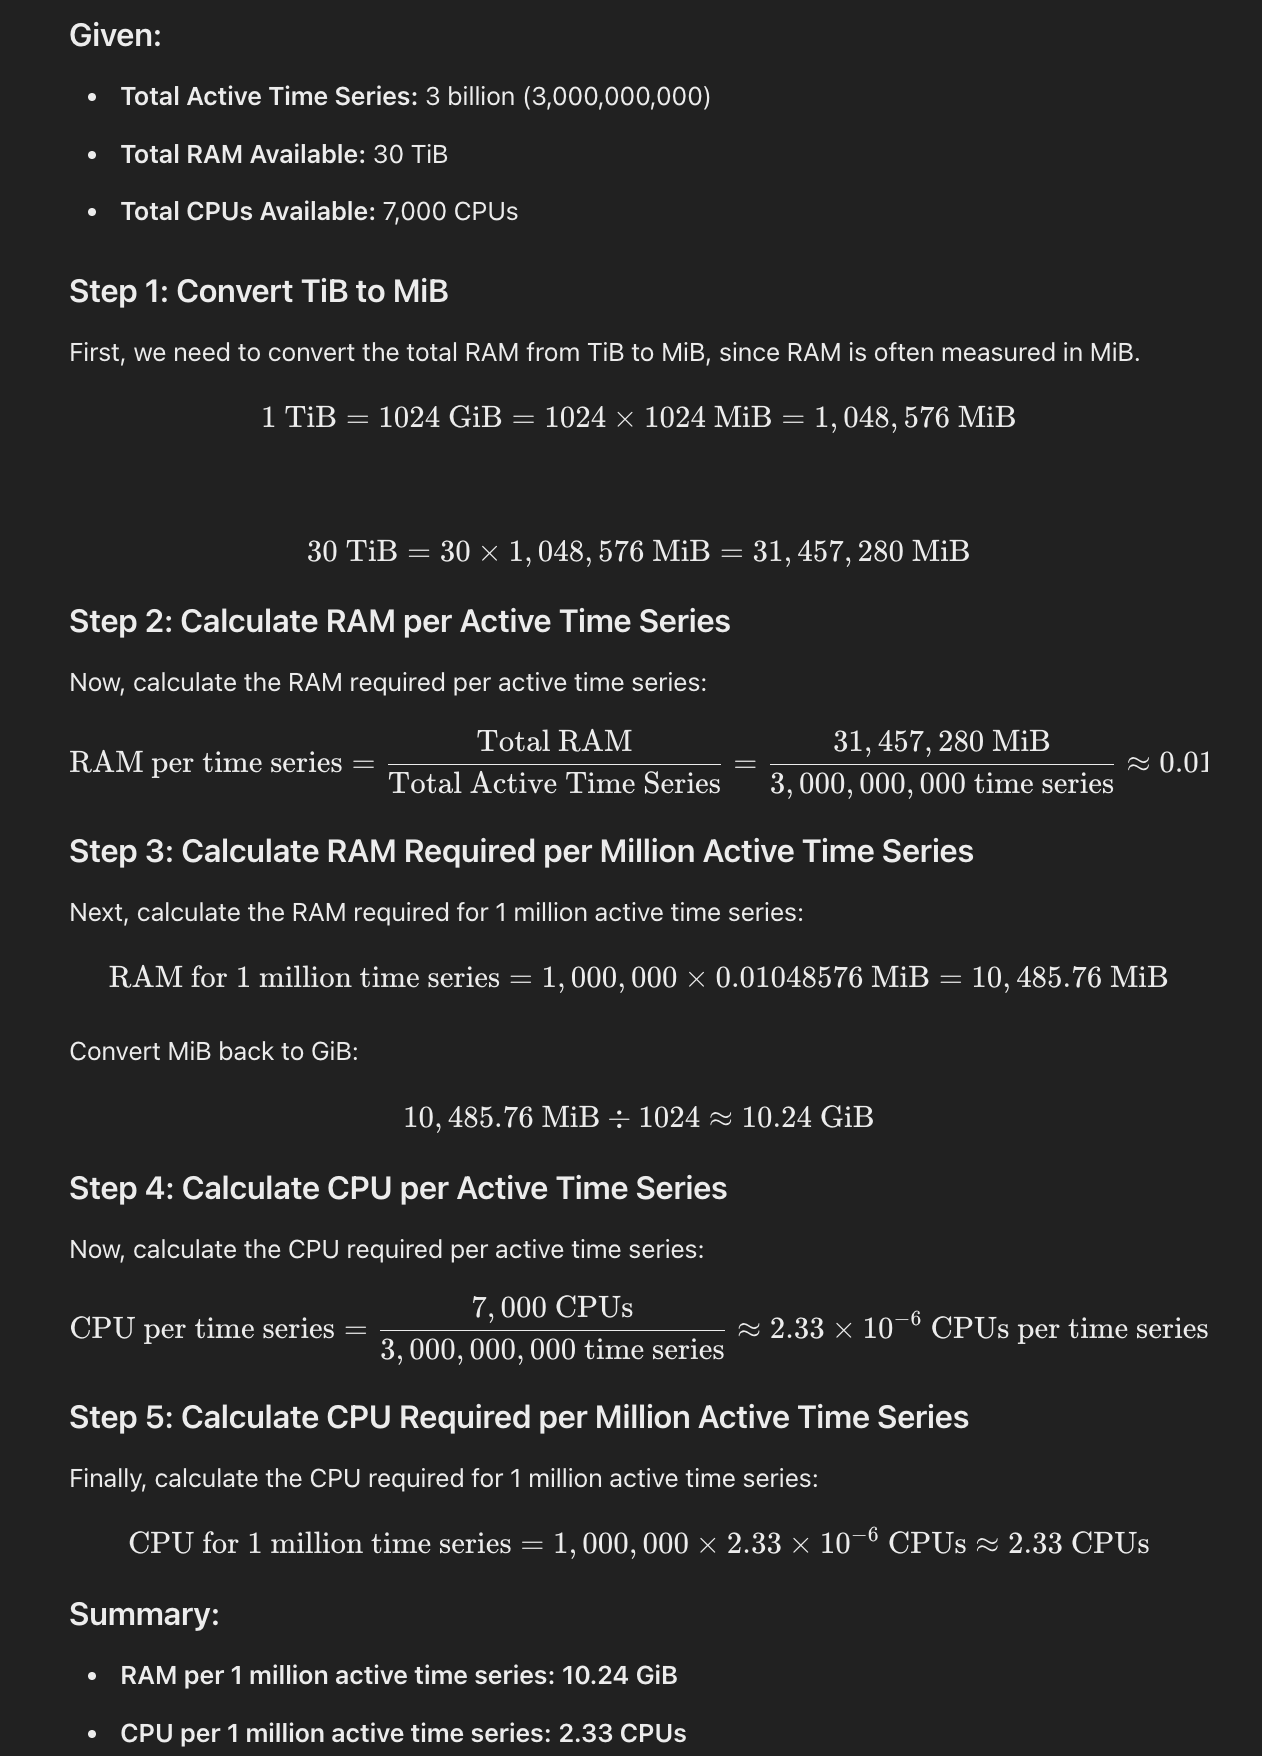
Greptime is one of the most CPU-efficient leaders in the long-term storage space, reducing memory utilization by as much as 80-90% compared to industry standards. The CPU and memory required to handle each million active time series by cluster type are as follows:
| Greptime | Mimir | Cortex | |
|---|---|---|---|
| Memory Usage | 1.23GiB | 10.24GiB | 15GiB |
| CPU Usage | 0.91 cores | 2.33 cores | 10 cores |
Long Term Storage deployments routinely process millions of active series per day costing tens of thousands of dollars or more every year. Take a very typical case of handling ten million active series. A typical Thanos deployment might utilize 100-120GiB of memory to handle that process. This translates to 8 c4-standard-4 instances on Google Cloud which at the writing of this post equates to a cost of almost $15,000 USD / year.
In this very likely scenario, a deployment could save over $10,000 USD every year by switching to Greptime. Saving on compute costs scales further with even larger deployments.
📍
Switching to Greptime can lead to resource efficiency, potentially saving 80-90% of the costs associated with Long Term Storage of Prometheus Metrics
These cost savings can be enjoyed with minimal disruption to other parts of your observability pipeline due to Greptime's focus on compatibility. Greptime's isomorphic table structure maps cleanly over to a set of Prometheus metrics which makes light work of replacing your legacy, compute-intensive storage with Greptime DB. We have had reports of users switching over from Thanos in 30 minutes.
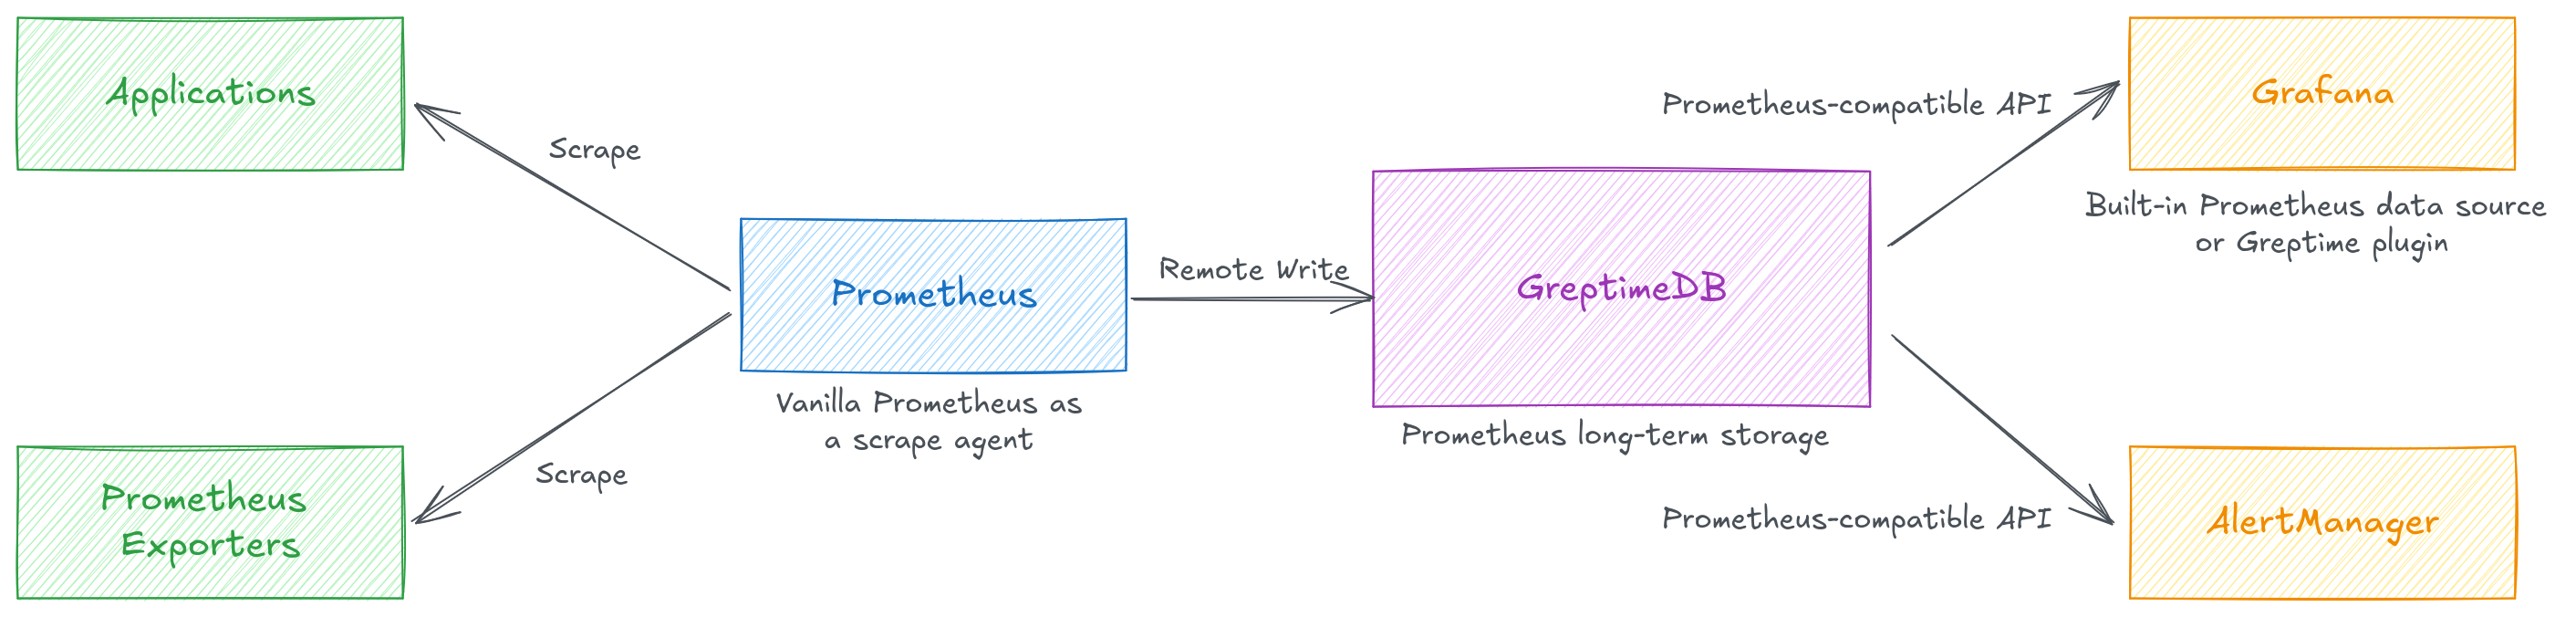
Greptime offers remote write ingestion and PromQL and Prometheus API compatibility for data consumption used in downstream applications like Grafana dashboards, PagerDuty alerts, and other reporting applications. In addition to metrics, Greptime can parse unstructured logs to create structured events in an observability pipeline. This efficient storage of metrics, logs, and events contributes to the single unified observability database vision that Greptime strives to achieve. All data you capture from Prometheus will easily be joinable and queryable with any of these other data sources, like logs, that were written to Greptime DB. Stop unnecessary context switching and managing configurations for multiple systems like Loki and Mimir; capture the comprehensive view in one place with GreptimeDB
📍
Greptime offers two major benefits: a faster, more efficient runtime, and a compatible, easily integrable solution
Greptime can save practitioners compute and money on their long-term Prometheus back end service while providing all of the support for industry standard tooling that makes for a seamless transition. If you are interested in trying Greptime's Open Source Software to make your pipeline more resource efficient, head over to our docs or schedule a call with our team to get started.
References
How Object storage is cheaper than block storage - https://www.cloudflare.com/learning/cloud/object-storage-vs-block-storage/
Mimir architecture - https://grafana.com/docs/mimir/latest/references/architecture/deployment-modes/#read-write-mode
Cortex Compute Budget by Active Series Benchmarks - https://cortexmetrics.io/docs/guides/capacity-planning/, https://grafana.com/blog/2022/04/08/how-we-scaled-our-new-prometheus-tsdb-grafana-mimir-to-1-billion-active-series/,https://greptime.cn/blogs/2024-08-02-datanode-benchmark
Active time series estimates and range for typical deployment https://groups.google.com/g/prometheus-users/c/_yJRs3aKQ50
VM vs Mimir https://victoriametrics.com/blog/mimir-benchmark/
Greptime Architecture - https://docs.greptime.com/user-guide/ingest-data/for-observability/prometheus
Greptime Benchmarks - https://greptime.com/blogs/2024-08-02-datanode-benchmark
- Mimir Benchmarks https://grafana.com/blog/2022/04/08/how-we-scaled-our-new-prometheus-tsdb-grafana-mimir-to-1-billion-active-series/
About Greptime
Greptime offers industry-leading time series database products and solutions to empower IoT and Observability scenarios, enabling enterprises to uncover valuable insights from their data with less time, complexity, and cost.
GreptimeDB is an open-source, high-performance time-series database offering unified storage and analysis for metrics, logs, and events. Try it out instantly with GreptimeCloud, a fully-managed DBaaS solution—no deployment needed!
The Edge-Cloud Integrated Solution combines multimodal edge databases with cloud-based GreptimeDB to optimize IoT edge scenarios, cutting costs while boosting data performance.
Star us on GitHub or join GreptimeDB Community on Slack to get connected.


