Vector is a high-speed, scalable data pipeline tool designed for collecting, transforming, and transmitting logs, metrics, events, and other data. It aggregates data from various sources, such as application logs and system metrics, and sends it to multiple targets like databases and monitoring systems. The advantages of Vector lie in its flexible configuration and efficient data processing capabilities, allowing users to easily build complex data pipelines while ensuring system stability during peak traffic.
In version v0.32.0 released last year, support for writing metric data to GreptimeDB has been introduced. For more details, refer to this article here.
With GreptimeDB now fully supporting the storage and analysis of log data, the log reception feature, greptime log sink, has been integrated into Vector. Users can record various data sources from Vector into GreptimeDB using the greptime_logs sink.
The following sections will explain how to quickly collect log data to GreptimeDB using Vector.
Configuring the greptime_logs Sink
Here is an example configuration for using the greptime_logs sink:
[sinks.my_sink_id]
type = "greptimedb_logs"
inputs = [ "my-source-or-transform-id" ]
compression = "gzip"
dbname = "public"
endpoint = "http://localhost:4000"
username = "username"
password = "password"
pipeline_name = "pipeline_name"
table = "mytable"

  [sinks.my_sink_id.extra_params]
  source = "vector"
Parameter Explanation
inputs: Specifies the source from which to fetch data (e.g.,my-source-or-transform-id);compression: The compression method used for transferring data between Vector and GreptimeDB;dbname: The database which will be written into GreptimeDB;endpoint: The HTTP service address of GreptimeDB.usernameandpassword: Credentials for accessing GreptimeDB.pipeline_name: The name of the pipeline being used.table: The name of the table where data will be written.extra_params: Additional HTTP query parameters sent to the GreptimeDB log interface, with source set tovectorin this case.
With this configuration, Vector will write data into the mytable table under the public database in GreptimeDB.
What is a Pipeline
Pipeline is a concept in GreptimeDB used for processing log data, it supports operations such as filtering, parsing, and extracting. In short, it transforms unstructured or semi-structured log text into structured table data in GreptimeDB.
While Vector's transform component can perform similar functions, Pipeline is a built-in tool within GreptimeDB that integrate more closely with features provided by GreptimeDB. Pipeline allows for creating, managing, and optimizing log data processing while specifying indexes and defining field types based on tables.
Next, we will introduce how to process log data using Pipeline.
The pipeline_name uniquely identifies the name of the pipeline in GreptimeDB. We can create a pipeline through GreptimeDB's HTTP API and use it within Vector to process log data.
Example Pipeline
Below shows an example of a simple pipeline definition:
processors:
  - date:
      fields:
        - timestamp
      formats:
        - '%Y-%m-%dT%H:%M:%S%.3fZ'
  - dissect:
      fields:
        - message
      patterns:
        - '%{ip} - %{user} [%{datetime}] "%{method} %{path} %{protocol}" %{status} %{size}'
  - date:
      fields:
        - datetime
      formats:
        - '%d/%b/%Y:%H:%M:%S %z'
transform:
  - fields:
      - message
      - ip
      - user
      - method
      - path
      - protocol
    type: string
  - fields:
      - status
      - size
    type: int64
  - fields:
      - datetime
    type: timestamp
    index: tag
  - fields:
      - timestamp
    type: timestamp
    index: timestamp
This Pipeline parses the message field from log data into multiple fields and converts the timestamp field into a timestamp type.
The original message has been split into several structured fields so that more structured data allows for quicker identification of desired information.
- ip
- user
- datetime
- method
- path
- protocol
- status
- size
Start GreptimeDB and Create a Pipeline
First, start a GreptimeDB instance with default parameters:
greptime standalone startNext, create a Pipeline through GreptimeDB's HTTP API:
## add pepeline
curl -X "POST" "http://localhost:4000/v1/events/pipelines/test?db=public" \
     -H 'Content-Type: application/x-yaml' \
     -d $'processors:
  - date:
      fields:
      - timestamp
      formats:
      - '%Y-%m-%dT%H:%M:%S%.3fZ'
  - dissect:
      fields:
        - message
      patterns:
        - \'%{ip} - %{user} [%{datetime}] "%{method} %{path} %{protocol}" %{status} %{size}\'
  - date:
      fields:
        - datetime
      formats:
        - '%d/%b/%Y:%H:%M:%S %z'
transform:
  - fields:
      - message
      - ip
      - user
      - method
      - path
      - protocol
    type: string
  - fields:
      - status
      - size
    type: int64
  - fields:
      - datetime
    type: timestamp
    index: tag
  - fields:
      - timestamp
    type: timestamp
    index: timestamp
'
## {"pipelines":[{"name":"test","version":"2024-09-22 13:19:10.315487388"}],"execution_time_ms":2}
This command creates a Pipeline named test. Vector can specify this pipeline name in its configuration to process log content.
In addition to open-source GreptimeDB, we also offer a fully managed cloud database service, GreptimeCloud. Here we have also created a database service on GreptimeCloud and synchronized the above Pipeline via API to the service in GreptimeCloud.
Start Vector and Write data to GreptimeDB
You can download the installation package suitable for your operating system from Vector's official website.
Configure Vector to write data simultaneously to both GreptimeDB and GreptimeCloud:
[sources.my_source_id]
type = "demo_logs"
format = "apache_common"
interval = 1

[sinks.local]
type = "greptimedb_logs"
endpoint = "http://localhost:4000"
table = "logs"
dbname = "public"
pipeline_name = "test"
compression = "none"
inputs = [ "my_source_id" ]

[sinks.cloud]
type = "greptimedb_logs"
endpoint = "https://ervqd5nxnb8s.us-west-2.aws.greptime.cloud"
table = "logs"
dbname = "my_database"
username = "username"
password = "password"
pipeline_name = "test"
compression = "gzip"
inputs = [ "my_source_id" ]
In this configuration, both dbname and endpoint in sinks.cloud will be provided after you create the database service in GreptimeCloud. In Vector, users can configure both local and cloud sinks simultaneously using the same data source to write one set of data to both local and cloud databases.
Save this configuration as demo.toml, then run the following command to start Vector:
vector --config-toml demo.tomlThis configuration will write data from the demo_logs source into both public.logs table in GreptimeDB and my_database.logs table in GreptimeCloud while processing data with the test Pipeline.
Viewing Data
In GreptimeDB
GreptimeDB supports various protocols for querying data such as PostgreSQL, MySQL, and HTTP API. The following example shows how to connect to GreptimeDB using a MySQL client and view the written data.
First, connect to GreptimeDB via MySQL client as shown below:
mysql -h 127.0.0.1 -P 4002

Welcome to the MySQL monitor.  Commands end with ; or \g.
Your MySQL connection id is 8
Server version: 8.4.2 Greptime

Copyright (c) 2000, 2024, Oracle and/or its affiliates.

Oracle is a registered trademark of Oracle Corporation and/or its
affiliates. Other names may be trademarks of their respective
owners.

Type 'help;' or '\h' for help. Type '\c' to clear the current input statement.
Users can query tables through SQL:
mysql> desc logs;
+-----------+---------------------+------+------+---------+---------------+
| Column    | Type                | Key  | Null | Default | Semantic Type |
+-----------+---------------------+------+------+---------+---------------+
| message   | String              |      | YES  |         | FIELD         |
| ip        | String              |      | YES  |         | FIELD         |
| user      | String              |      | YES  |         | FIELD         |
| method    | String              |      | YES  |         | FIELD         |
| path      | String              |      | YES  |         | FIELD         |
| protocol  | String              |      | YES  |         | FIELD         |
| status    | Int64               |      | YES  |         | FIELD         |
| size      | Int64               |      | YES  |         | FIELD         |
| datetime  | TimestampNanosecond | PRI  | YES  |         | TAG           |
| timestamp | TimestampNanosecond | PRI  | NO   |         | TIMESTAMP     |
+-----------+---------------------+------+------+---------+---------------+
10 rows in set (0.00 sec)
You can see that the Pipeline has successfully transformed raw log content into more structured data for precise querying:
mysql> select ip,user,method,path,protocol,status,size,timestamp from logs order by timestamp limit 10;
+----------------+--------------+--------+------------------------------+----------+--------+-------+----------------------------+
| ip             | user         | method | path                         | protocol | status | size  | timestamp                  |
+----------------+--------------+--------+------------------------------+----------+--------+-------+----------------------------+
| 57.139.106.246 | b0rnc0nfused | POST   | /apps/deploy                 | HTTP/1.1 |    503 | 29189 | 2024-09-23 08:30:31.147581 |
| 92.244.202.215 | CrucifiX     | DELETE | /secret-info/open-sesame     | HTTP/2.0 |    503 | 32896 | 2024-09-23 08:30:32.148556 |
| 156.19.88.115  | devankoshal  | HEAD   | /wp-admin                    | HTTP/1.0 |    550 |  8650 | 2024-09-23 08:30:33.148113 |
| 180.46.246.211 | benefritz    | HEAD   | /secret-info/open-sesame     | HTTP/1.1 |    302 | 23108 | 2024-09-23 08:30:34.147865 |
| 234.52.58.58   | b0rnc0nfused | HEAD   | /booper/bopper/mooper/mopper | HTTP/1.0 |    302 | 37767 | 2024-09-23 08:30:35.147550 |
| 95.166.109.178 | b0rnc0nfused | GET    | /do-not-access/needs-work    | HTTP/1.1 |    500 | 11546 | 2024-09-23 08:30:36.148012 |
| 46.172.171.167 | benefritz    | OPTION | /booper/bopper/mooper/mopper | HTTP/1.1 |    302 | 28860 | 2024-09-23 08:30:37.148466 |
| 185.150.37.231 | devankoshal  | PUT    | /this/endpoint/prints/money  | HTTP/1.0 |    304 | 11566 | 2024-09-23 08:30:38.147247 |
| 76.150.197.27  | BryanHorsey  | HEAD   | /apps/deploy                 | HTTP/1.1 |    501 | 46186 | 2024-09-23 08:30:39.148455 |
| 128.175.97.190 | BryanHorsey  | OPTION | /user/booperbot124           | HTTP/1.1 |    400 | 15037 | 2024-09-23 08:30:40.147901 |
+----------------+--------------+--------+------------------------------+----------+--------+-------+----------------------------+
10 rows in set (0.08 sec)
Through the above steps, users can easily use Vector to write log data to GreptimeDB and manage and process the log data via Pipeline.
In GreptimeCloud
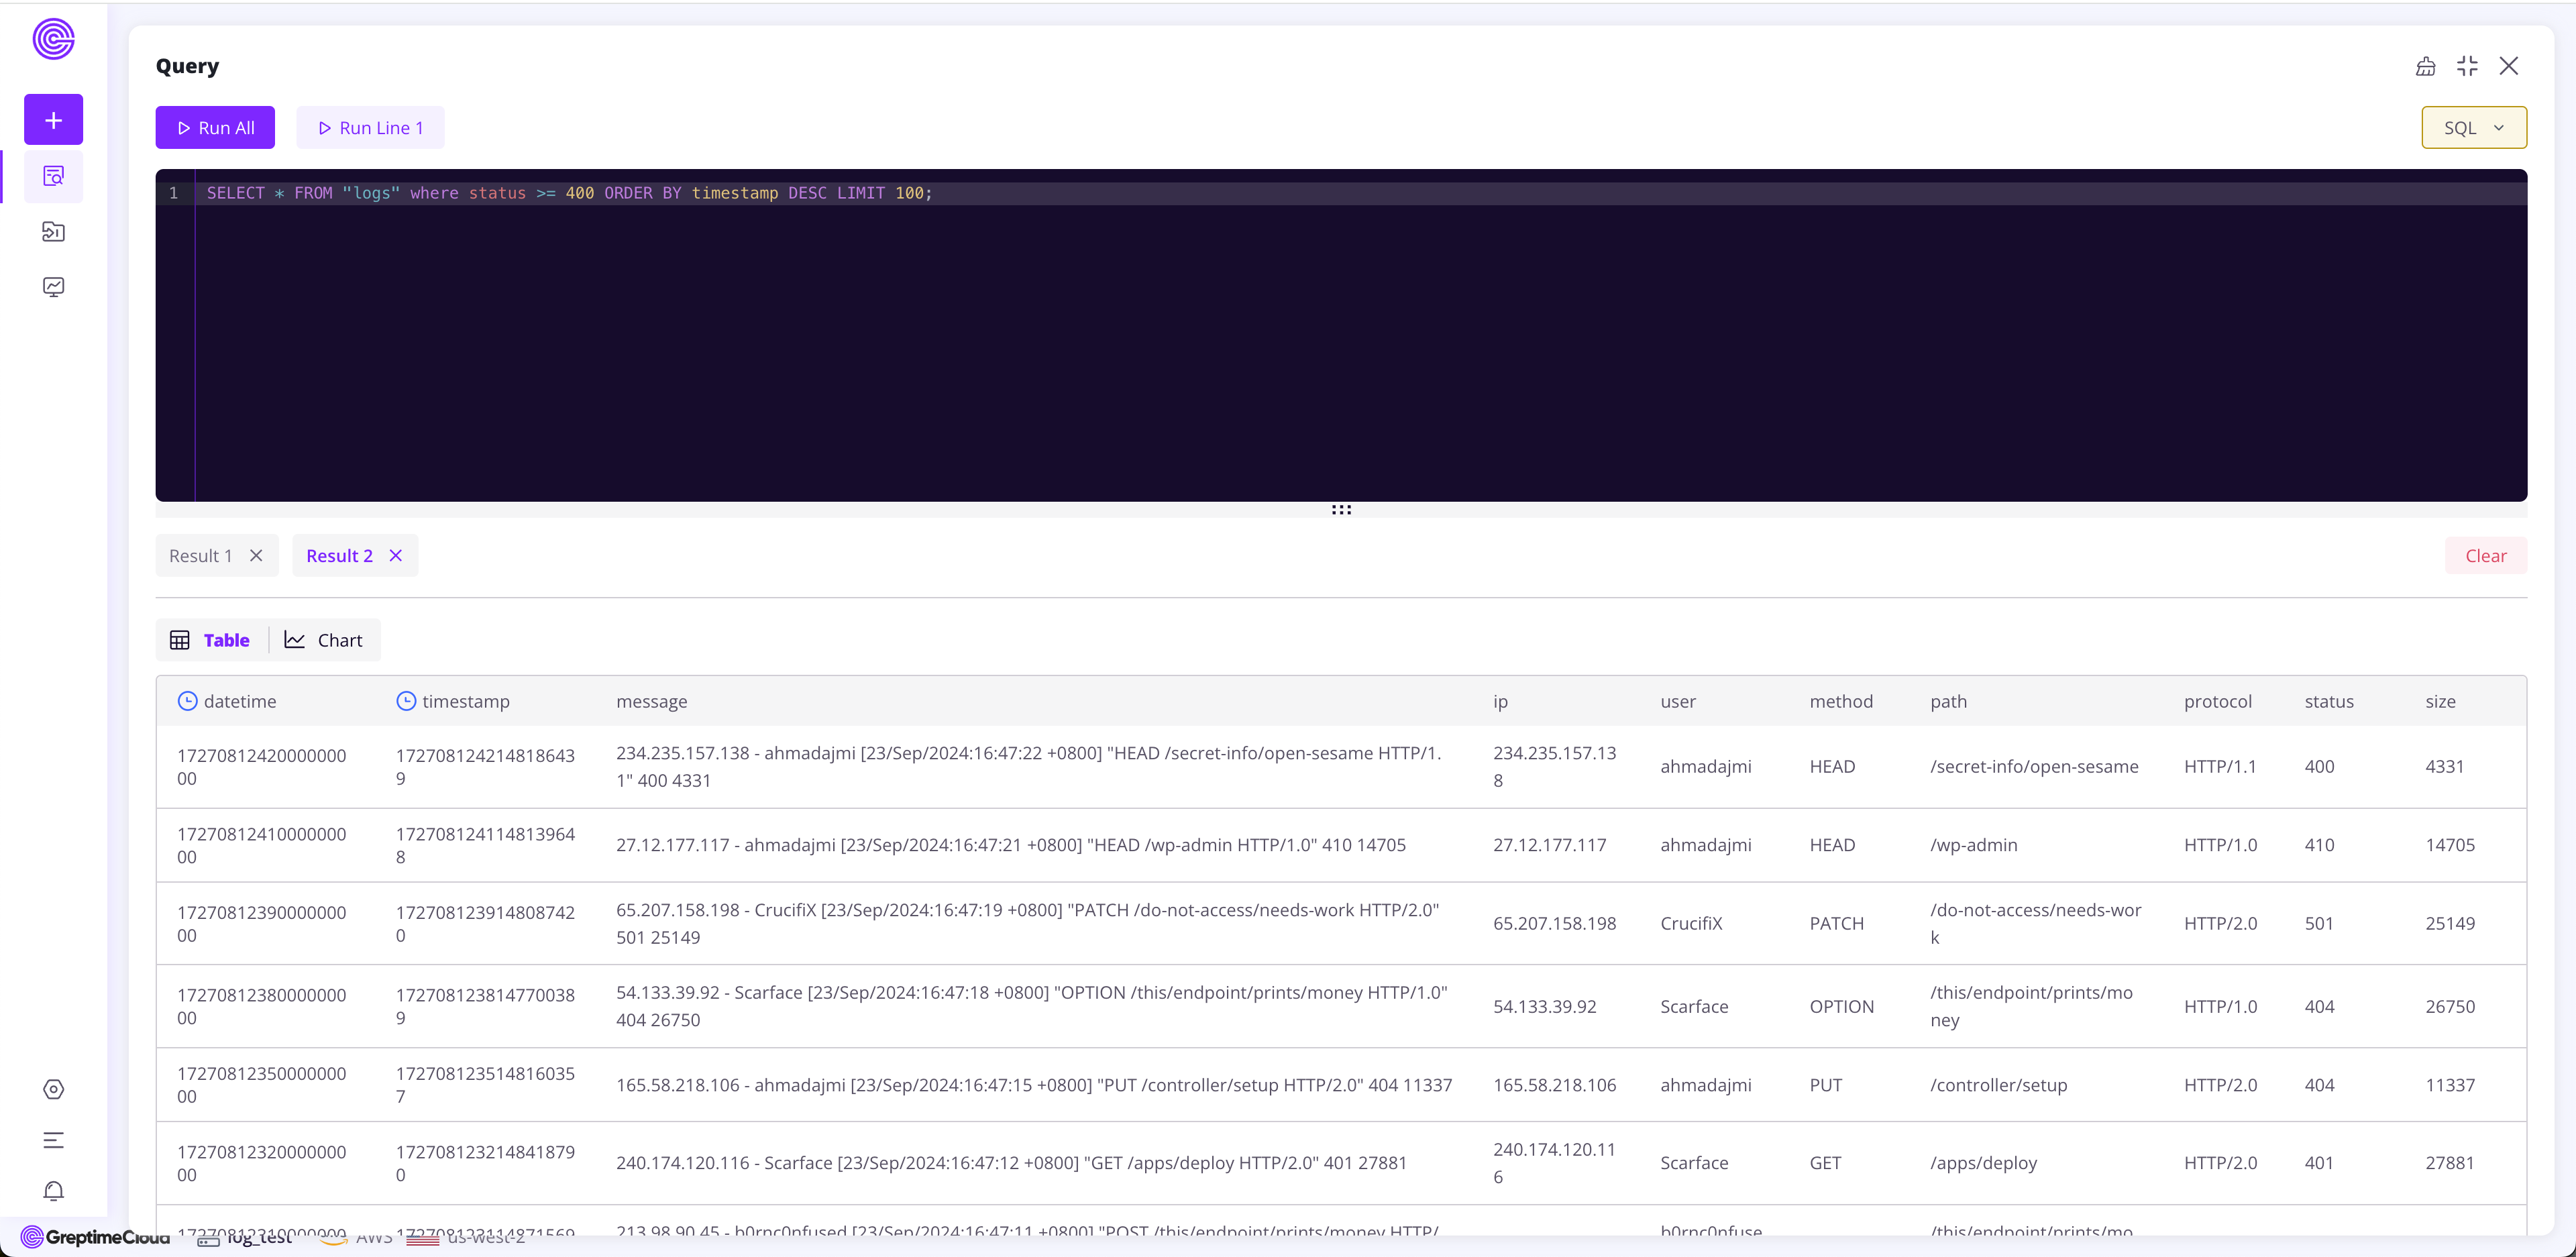
As we have written a copy of the data to GreptimeCloud, you can also query the data through the provided console interface in GreptimeCloud while also performing data visualization.
The following image demonstrates querying all requests with a status greater than 400 using SQL statements to help quickly pinpoint issues.

Conclusion
The integration of the greptime log sink feature within Vector enhances the efficiency of collecting, processing, and storing log data throughout its lifecycle. By leveraging the capabilities of Pipeline in GreptimeDB, users can flexibly handle logs while efficiently storing them in both GreptimeDB and GreptimeCloud, significantly improving log management and query efficiency.
About Greptime
Greptime offers industry-leading time series database products and solutions to empower IoT and Observability scenarios, enabling enterprises to uncover valuable insights from their data with less time, complexity, and cost.
GreptimeDB is an open-source, high-performance time-series database offering unified storage and analysis for metrics, logs, and events. Try it out instantly with GreptimeCloud, a fully-managed DBaaS solution—no deployment needed!
The Edge-Cloud Integrated Solution combines multimodal edge databases with cloud-based GreptimeDB to optimize IoT edge scenarios, cutting costs while boosting data performance.
Star us on GitHub or join GreptimeDB Community on Slack to get connected.


