Background
Prometheus has evolved into the de facto standard for Metrics monitoring in the cloud-native era, as evidenced by the following points:
HTTP Endpoint + Pull Scrape has become the mainstream method for exposing and collecting Metrics (a model originally sourced from Google's Borg).
Along with the Prometheus data model (Gauge / Counter / Histogram / Summary), PromQL has gradually emerged as the predominant query language for Metrics data.
However, Prometheus is not regarded as a high-performance, scalable database. In large-scale scenarios, developers often need to implement complex optimizations on top of native Prometheus to handle vast amounts of monitoring data.
From a technological evolution perspective, Prometheus's essence lies in providing a simple, effective, and practical data model for the Metrics domain, which has fostered a rich technological ecosystem.
As a general time-series database, GreptimeDB not only inherits the technical ecosystem built by Prometheus pioneers but also designs higher-performance features for cloud-native scenarios. In summary, we offer:
1. Full Compatibility with the Prometheus Ecosystem
- Compatibility with PromQL exceeds 90%, making it the time-series database with the highest PromQL compatibility for third-party implementations.
- Supports Prometheus Remote Write and Remote Read, as well as the standard Prometheus HTTP data query interface.
2. Support for SQL Protocol: In addition to supporting PromQL, GreptimeDB also supports SQL, enabling more users to write expressive queries without additional learning costs. Interestingly, we can use PromQL within SQL queries, allowing these two query languages to complement each other.
3. Separation of Storage and Compute Based on Cost-Effective Object Storage: Ensures performance while allowing elastic scaling in storage and compute, offering high cost-performance. Users can use a single-point mode for small-scale operations or a cluster mode for massive data support.
In conclusion, choosing GreptimeDB means opting for a higher-performance and more scalable version of Prometheus.
This article will use Node Exporter as a business scenario to guide users on how to replace the existing Prometheus setup with GreptimeDB in a Kubernetes environment, equipping Prometheus with a high-performance cloud-native time-series data engine.
Preparing the Test Environment
Creating a Kubernetes Test Environment
If you already have a Kubernetes environment available for testing, you can skip this step. We recommend using the excellent Kind tool (please refer to the specific documentation for installation) to create a Kubernetes cluster with 5 nodes locally. The command is as follows:
cat <<EOF | kind create cluster --config=-
kind: Cluster
apiVersion: kind.x-k8s.io/v1alpha4
nodes:
- role: control-plane
- role: worker
- role: worker
- role: worker
- role: worker
EOF
After the cluster is created, you can use kubectl to confirm that you have a 5-node K8s cluster, as shown below:
$ kubectl get nodes
NAME                 STATUS   ROLES           AGE   VERSION
kind-control-plane   Ready    control-plane   42s   v1.27.3
kind-worker          Ready    <none>          19s   v1.27.3
kind-worker2         Ready    <none>          19s   v1.27.3
kind-worker3         Ready    <none>          20s   v1.27.3
kind-worker4         Ready    <none>          24s   v1.27.3
Deploying Node Exporter
Node Exporter is an open-source collector from Prometheus used for monitoring node status. We can install Node Exporter into the node-exporter namespace using Helm:
- First, add the appropriate Helm Repository:
helm repo add prometheus-community https://prometheus-community.github.io/helm-charts
helm repo update- Install Node Exporter:
helm install \
  node-exporter prometheus-community/prometheus-node-exporter \
  --create-namespace \
  -n node-exporter
The above command will install the Node Exporter on each Node to collect node metrics and the collected metrics will be exposed as /metrics on port :9100.
After installation, you should observe the Pod status.
$ kubectl get pods -n node-exporter
NAME                                           READY   STATUS    RESTARTS   AGE
node-exporter-prometheus-node-exporter-4gt6x   1/1     Running   0          10s
node-exporter-prometheus-node-exporter-j8blr   1/1     Running   0          10s
node-exporter-prometheus-node-exporter-kjvzg   1/1     Running   0          10s
node-exporter-prometheus-node-exporter-q2fc9   1/1     Running   0          10s
node-exporter-prometheus-node-exporter-tm9lr   1/1     Running   0          10s
Next, we will use Node Exporter as the business container to collect and observe Metrics via Prometheus.
Installing Prometheus Operator
To use Prometheus in a K8s environment, we need to deploy the prometheus-operator. The Prometheus Operator defines a set of CRDs based on the K8s Operator model, allowing developers to easily monitor their services using Prometheus by writing YAML files. The Prometheus Operator's CRDs are widely used and have become the de facto standard for managing Prometheus in K8s.
You can install the Prometheus Operator directly using the following command with a YAML file:
LATEST=$(curl -s https://api.github.com/repos/prometheus-operator/prometheus-operator/releases/latest | jq -cr .tag_name)
curl -sL https://github.com/prometheus-operator/prometheus-operator/releases/download/${LATEST}/bundle.yaml | kubectl create -f -
This operation will install the following components:
1. CRDs required by the Prometheus Operator, including:
alertmanagerconfigs.monitoring.coreos.com   2024-08-08T07:08:18Z
alertmanagers.monitoring.coreos.com         2024-08-08T07:08:35Z
podmonitors.monitoring.coreos.com           2024-08-08T07:08:18Z
probes.monitoring.coreos.com                2024-08-08T07:08:18Z
prometheusagents.monitoring.coreos.com      2024-08-08T07:08:36Z
prometheuses.monitoring.coreos.com          2024-08-08T07:08:36Z
prometheusrules.monitoring.coreos.com       2024-08-08T07:08:19Z
scrapeconfigs.monitoring.coreos.com         2024-08-08T07:08:19Z
servicemonitors.monitoring.coreos.com       2024-08-08T07:08:19Z
thanosrulers.monitoring.coreos.com          2024-08-08T07:08:37Z
Focus on PrometheusAgent and ServiceMonitor for actual usage.
2. The prometheus-operator service and its related K8s resources (e.g., RBAC, etc.).
After the creation is successful, you will observe the following:
$ kubectl get pods
NAME                                   READY   STATUS    RESTARTS       AGE
prometheus-operator-5b5cdb686d-rdddm   1/1     Running   0              10s
Creating a GreptimeDB Cluster
Installing GreptimeDB Operator
To ensure GreptimeDB runs smoothly on Kubernetes, we have developed and open-sourced the GreptimeDB Operator. This operator abstracts two CRDs, GreptimeDBCluster and GreptimeDBStandalone, to manage GreptimeDB in Cluster and Standalone modes, respectively. Y ou can also install the GreptimeDB Operator using Helm commands:
1. Add the corresponding Helm Repository:
helm repo add greptime https://greptimeteam.github.io/helm-charts/
helm repo update
2. Install the GreptimeDB Operator in the greptimedb-admin namespace:
helm install \
  greptimedb-operator greptime/greptimedb-operator \
  --create-namespace \
  -n greptimedb-admin
Once installed successfully, you will see that the GreptimeDB Operator is now running:
$ kubectl get po -n greptimedb-admin
NAME                                   READY   STATUS    RESTARTS   AGE
greptimedb-operator-75c48676f5-4fjf8   1/1     Running   0          10s
Building the GreptimeDB Cluster
The GreptimeDB Cluster in cluster mode relies on etcd as the metadata service. You can quickly create a 3-node etcd-cluster with the following command:
helm upgrade \
  --install etcd oci://registry-1.docker.io/bitnamicharts/etcd \
  --set replicaCount=3 \
  --set auth.rbac.create=false \
  --set auth.rbac.token.enabled=false \
  --create-namespace \
  -n etcd-cluster
After creation, you can check the status of the etcd-cluster using the following command:
$ kubectl get po -n etcd-cluster
NAME     READY   STATUS    RESTARTS        AGE
etcd-0   1/1     Running          0        20s
etcd-1   1/1     Running          0        20s
etcd-2   1/1     Running          0        20s
Next, we can create a minimal GreptimeDB cluster and observe its elastic scaling process:
cat <<EOF | kubectl apply -f -
apiVersion: greptime.io/v1alpha1
kind: GreptimeDBCluster
metadata:
  name: mycluster
spec:
  base:
    main:
      image: greptime/greptimedb:latest
  frontend:
    replicas: 1
  meta:
    replicas: 1
    etcdEndpoints:
      - "etcd.etcd-cluster:2379"
  datanode:
    replicas: 1
EOF
Upon successful deployment, you will see that this GreptimeDB cluster has 3 Pods:
$ kubectl get greptimedbclusters.greptime.io
NAME        FRONTEND   DATANODE   META   FLOWNODE   PHASE     VERSION    AGE
mycluster 1 1 1 0 Running latest 1m- Frontend: Handles read and write requests from users.
- Datanode: The storage and computing unit that processes requests from the Frontend.
- Metasrv: The metadata service for the cluster.
At this point, the internal K8s domain mycluster-frontend.default.cluster.svc.local will serve as the entry point for exposing the Cluster's capabilities. When using the Remote Write protocol to write Metrics data to the cluster, we need to use the following URL:
http://mycluster-frontend.default.cluster.svc.local:4000/v1/prometheus/write?db=publicWe will use the public database by default.
Starting Our Monitoring
Creating Prometheus Agent
Since Prometheus Metrics monitoring utilizes a passive pull model, we need to configure a Scraper. We can use the Prometheus Operator to create a Prometheus Agent, which will scrape data from Node Exporter and write it to the GreptimeDB Cluster using the Remote Write protocol.
The Prometheus Agent is a special operational mode of Prometheus, effectively decoupling the time-series database capabilities from Prometheus itself and optimizing Remote Write performance, making it a high-performance agent that supports Prometheus' collection semantics.
You can create a Prometheus Agent using the following YAML configuration:
apiVersion: v1
kind: ServiceAccount
metadata:
  name: prometheus-agent
---
apiVersion: rbac.authorization.k8s.io/v1
kind: ClusterRole
metadata:
  name: prometheus-agent
rules:
  - apiGroups: [""]
    resources:
      - nodes
      - nodes/metrics
      - services
      - endpoints
      - pods
    verbs: ["get", "list", "watch"]
  - apiGroups: [""]
    resources:
      - configmaps
    verbs: ["get"]
  - apiGroups:
      - discovery.k8s.io
    resources:
      - endpointslices
    verbs: ["get", "list", "watch"]
  - apiGroups:
      - networking.k8s.io
    resources:
      - ingresses
    verbs: ["get", "list", "watch"]
  - nonResourceURLs: ["/metrics"]
    verbs: ["get"]
---
apiVersion: rbac.authorization.k8s.io/v1
kind: ClusterRoleBinding
metadata:
  name: prometheus-agent
roleRef:
  apiGroup: rbac.authorization.k8s.io
  kind: ClusterRole
  name: prometheus-agent
subjects:
  - kind: ServiceAccount
    name: prometheus-agent
    namespace: node-exporter
---
apiVersion: monitoring.coreos.com/v1alpha1
kind: PrometheusAgent
metadata:
  name: prometheus-agent
spec:
  image: quay.io/prometheus/prometheus:v2.53.0
  replicas: 1
  serviceAccountName: prometheus-agent
  remoteWrite:
    - url: http://mycluster-frontend.default.cluster.svc.local:4000/v1/prometheus/write?db=public
  serviceMonitorSelector:
    matchLabels:
      team: node-exporter
Without delving into prior permission configurations, let’s focus on a few key points of the PrometheusAgent:
- The
remoteWritefield specifies the target address for data writing. - The
serviceMonitorSelectorindicates that the Agent will scrape ServiceMonitor resources labeled withteam=node-exporter, allowing better task partitioning for the scrape job.
We can create the Prometheus Agent in the node-exporter namespace.
kubectl apply -f prometheus-agent.yaml -n node-exporterCreating ServiceMonitor
The prometheus-operator abstracts two models for business monitoring: ServiceMonitor and PodMonitor. The fundamental difference between these models is minimal; both indicate a set of Pods whose Metrics information the Prometheus Operator needs to monitor, generating a configuration file for the Prometheus Agent and updating the configuration in real-time via an HTTP POST request to /--/reload.
Here is an example of a ServiceMonitor created for Node Exporter:
apiVersion: monitoring.coreos.com/v1
kind: ServiceMonitor
metadata:
  labels:
    team: node-exporter
  name: node-exporter
spec:
  endpoints:
    - interval: 5s
      targetPort: 9100
  selector:
    matchLabels:
      app.kubernetes.io/name: prometheus-node-exporter
This configuration indicates that it will scrape the /metrics data from the backend Pods on port 9100 every 5 seconds for the Service labeled with app.kubernetes.io/name=prometheus-node-exporter.
Note that the team=node-exporter in the .metadata.labels field of the ServiceMonitor must match the matchLabels of the corresponding Prometheus Agent.
Let’s create the ServiceMonitor in the node-exporter namespace.
kubectl apply -f service-monitor.yaml -n node-exporterObserving
Once all resources are created, data writing will commence. You can use the kubectl port-forward command to expose the Frontend service and query it using mysql:
kubectl port-forward svc/mycluster-frontend.default.cluster.svc.local 4002:4002After executing the query, you should see a table similar to the following:
mysql> show tables;
+---------------------------------------------+
| Tables                                      |
+---------------------------------------------+
| go_gc_duration_seconds                      |
| go_gc_duration_seconds_count                |
| go_gc_duration_seconds_sum                  |
| go_goroutines                               |
| go_info                                     |
| go_memstats_alloc_bytes                     |
| go_memstats_alloc_bytes_total               |
...
To further demonstrate GreptimeDB's compatibility with PromQL, you can use Grafana and the Node Exporter Dashboard for data visualization. The steps to install Grafana are as follows:
- Add the Grafana Helm Repository:
helm repo add grafana https://grafana.github.io/helm-charts
helm repo update- Deploy Grafana using the default configuration:
helm upgrade \
  --install grafana grafana/grafana \
  --set image.registry=docker.io \
  --create-namespace \
-n grafana- After deployment, use the following command to view the admin user password:
kubectl get secret \
  -n grafana grafana \
-o jsonpath="{.data.admin-password}" | base64 --decode ; echo- Expose Grafana's service to the host machine for easy browser access:
kubectl -n grafana port-forward --address 0.0.0.0 svc/grafana 18080:80At this point, you can directly access the Grafana service in your host machine's browser at http://localhost:18080, logging in with the admin username and the password obtained in the previous step.
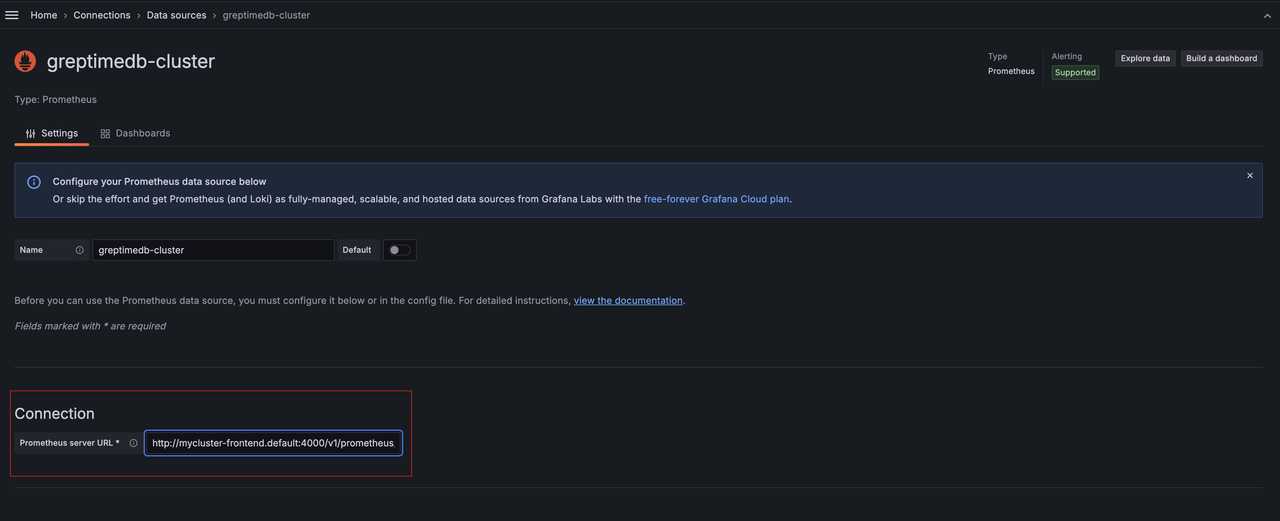
Once Grafana is deployed, you can add the GreptimeDB Cluster as a standard Prometheus source:

Simply enter the internal domain of the Frontend service in the connection field: http://mycluster-frontend.default.cluster.svc.local:4000/v1/prometheus/.
Then click "Save and Test".
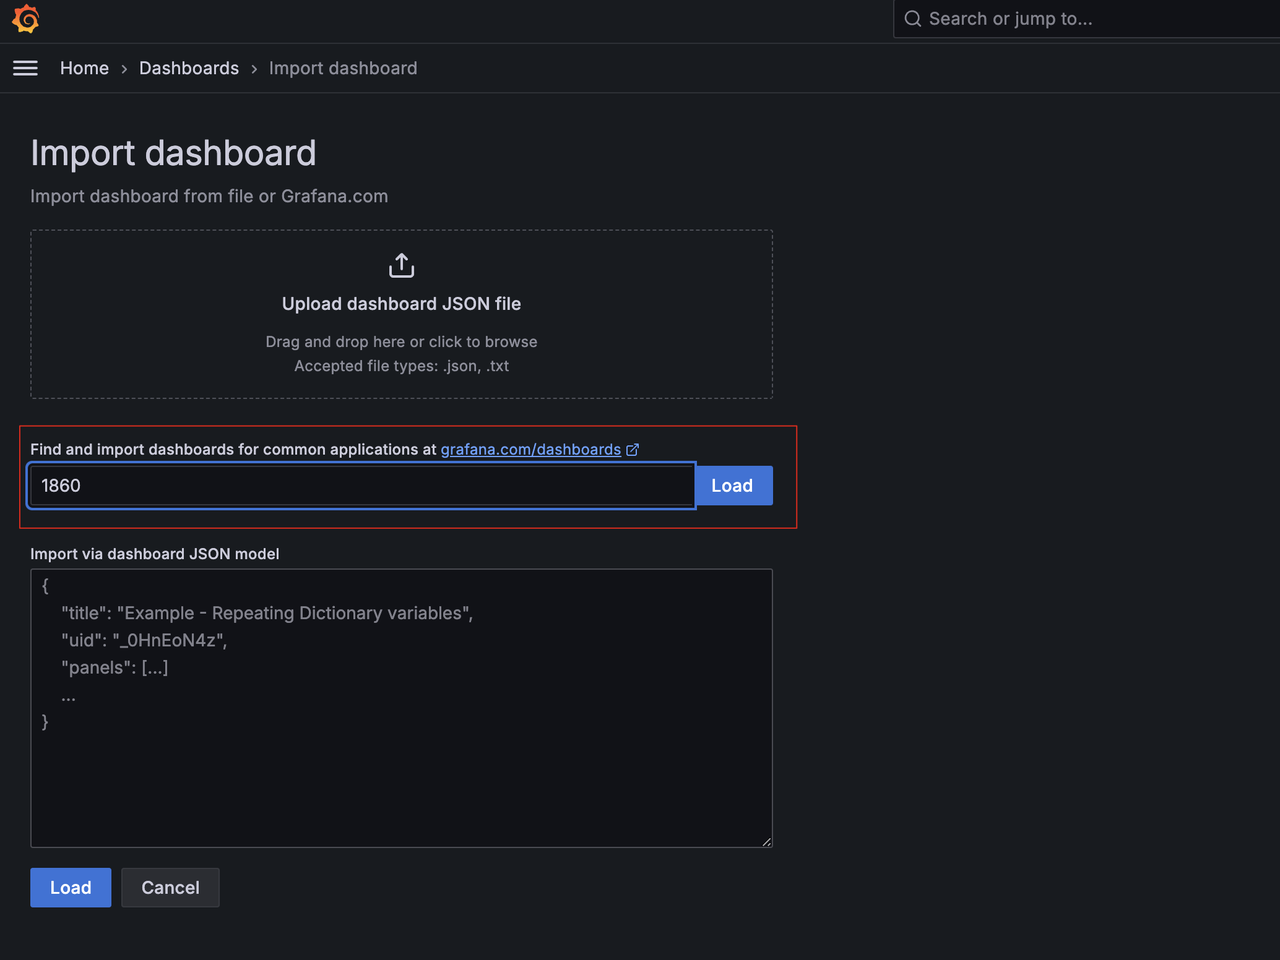
You can import the Node Exporter Dashboard using its ID.

Using the greptimedb-cluster source we just added, you can see the familiar Node Exporter Dashboard:

Moving Forward
From the above experience, it’s clear that GreptimeDB's perfect compatibility with the Prometheus ecosystem allows us to easily reuse existing components. If you are already using Prometheus Operator for data monitoring, you can create new Prometheus Agents and ServiceMonitors for dual writes without changing existing operations. Once verified, you can migrate old data to the new cluster and gradually switch traffic. In the future, we will provide migration tools and articles to further elaborate on this approach.
You may have noticed that we did not use object storage in the earlier steps; instead, we utilized local storage for demonstration convenience. However, we can configure the cluster with object storage, allowing cost-effective object storage to serve as our final backend. If you're interested in this, please look out for our upcoming articles, where we will discuss how to deploy GreptimeDB in a cloud environment.
As business within the cluster increases, the GreptimeDB cluster may also need elastic scaling. At this time, we can design more reasonable partitioning rules to elastically expand the Frontend and Datanode services. In most scenarios, expanding these two types of services is sufficient to handle system pressure effectively. We will detail how to implement more reasonable elastic scaling strategies in future articles.
About Greptime
We help industries that generate large amounts of time-series data, such as Connected Vehicles (CV), IoT, and Observability, to efficiently uncover the hidden value of data in real-time.
Visit the latest version from any device to get started and get the most out of your data.
- GreptimeDB, written in Rust, is a distributed, open-source, time-series database designed for scalability, efficiency, and powerful analytics.
- Edge-Cloud Integrated TSDB is designed for the unique demands of edge storage and compute in IoT. It tackles the exponential growth of edge data by integrating a multimodal edge-side database with cloud-based GreptimeDB Enterprise. This combination reduces traffic, computing, and storage costs while enhancing data timeliness and business insights.
- GreptimeCloud is a fully-managed cloud database-as-a-service (DBaaS) solution built on GreptimeDB. It efficiently supports applications in fields such as observability, IoT, and finance.
Star us on GitHub or join GreptimeDB Community on Slack to get connected. Also, you can go to our contribution page to find some interesting issues to start with.


