On this page
Part 1 - Exporting Metrics from the Tesla Owner API into Greptime
OpenTelemetry has quickly become the top standard for monitoring applications and networks by enabling developers to capture and track useful data to understand the state of their system. If you are unfamiliar with OpenTelemetry and its applications, check out our previous blog post that gives an overview of what it's all about.
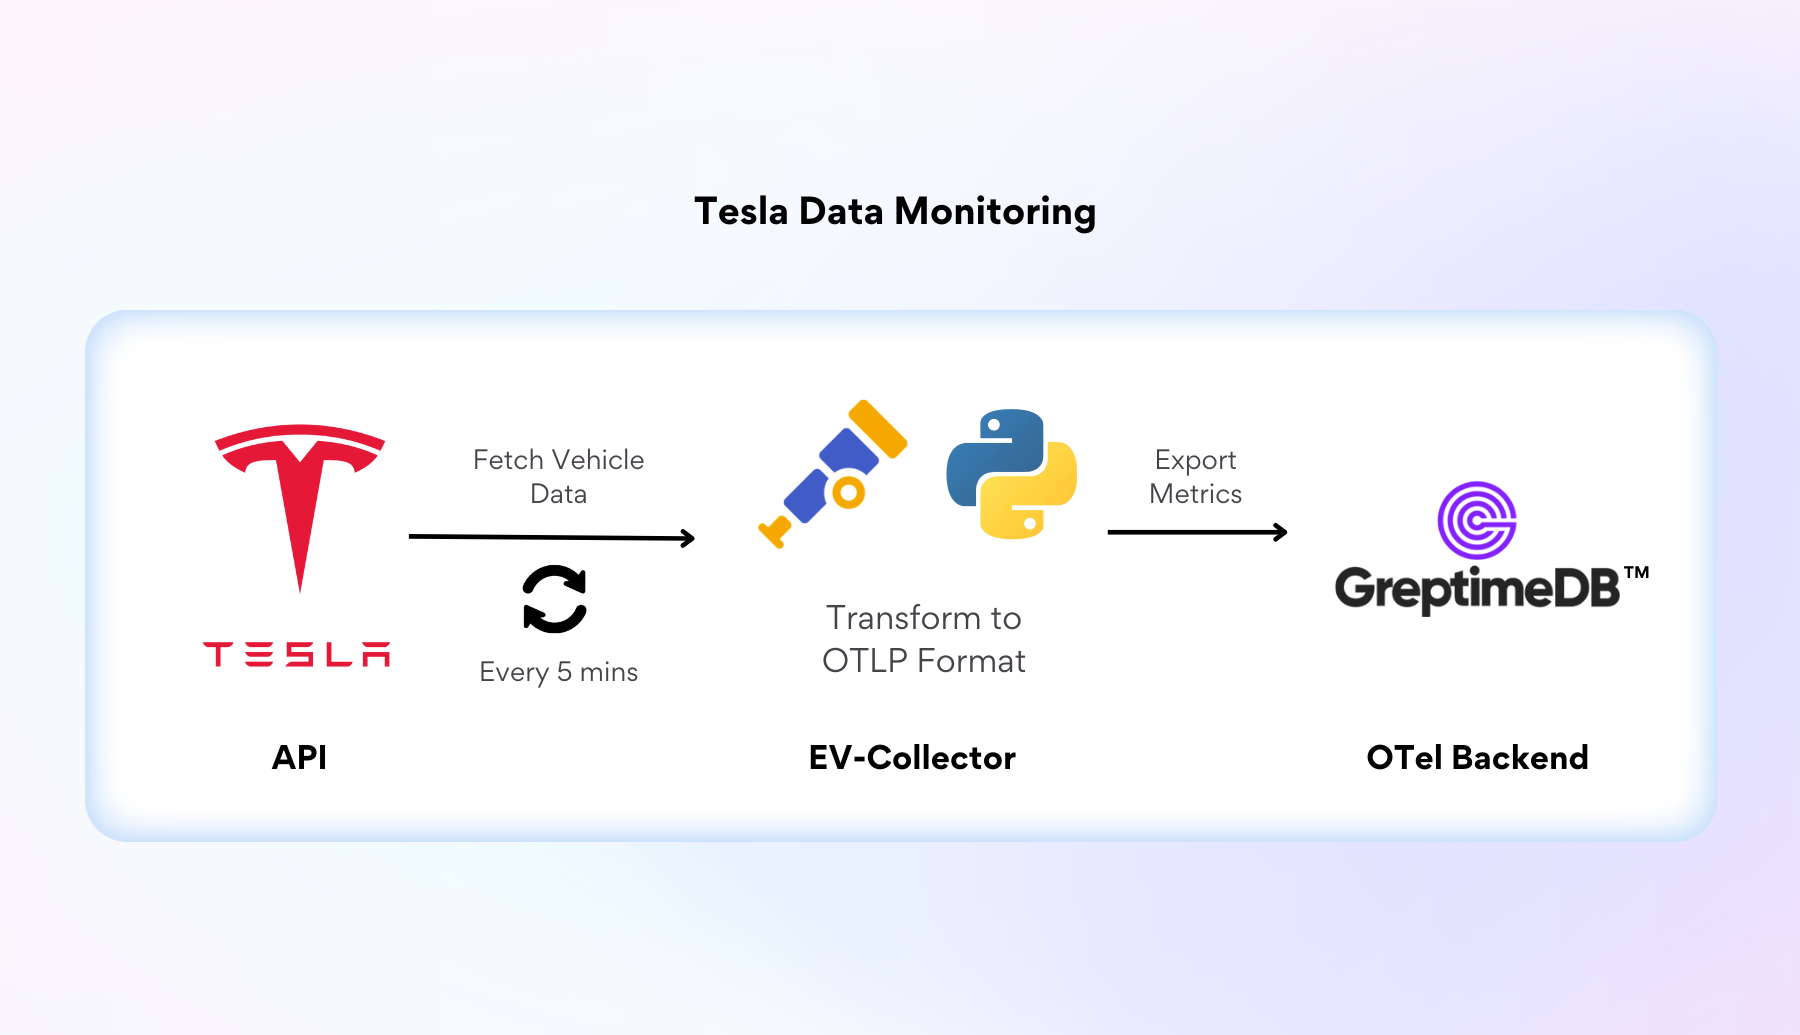
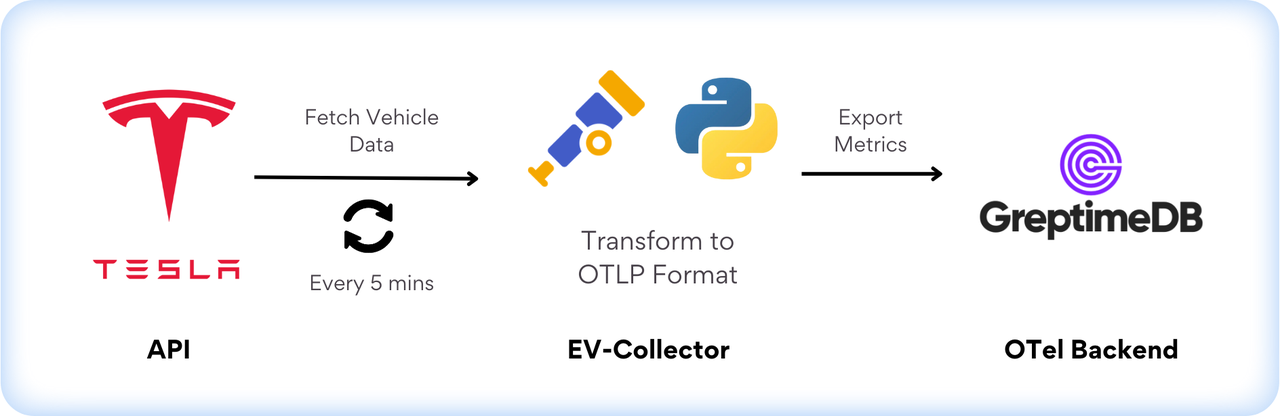
This blog post gives a practical application of using OpenTelemetry to monitor charging and driving statistics from a Tesla Model 3. The project data flow is fairly simple: It instruments a Python service with OpenTelemetry, and connects to the Tesla Owner API to capture metrics every 5 minutes. The project also contains a docker hosted GreptimeDB instance that serves as a target for the instrumented application to export the metrics to.
Setting the application with GreptimeDB demo
To get started, download our code from the Greptime demos repository.
git clone https://github.com/GreptimeTeam/demo-scene.git
cd demo-scene/ev-open-telemetry
The project is set up to run with minimal dependencies by deploying the Python service inside its own Docker container. So if you don't have Docker on your machine install Docker.
Verify your docker installation with below command:
docker -v
=> Docker version ...
For those interested in running the code on their host machine instead of Docker, make sure to set up your python environment:
- set up the Python dependency management system, Poetry
- set up the Python version management system, pyenv
- download Python 3.9 with:
pyenv install 3.9 - build projects virtual environment with pinned dependencies:
poetry install(from within./ev-open-telemetry/ev-observer)
The relevant dependencies in the file at ./ev-open-telemetry/ev_observer/pyproject.toml declares the standard OpenTelemetry modules necessary to: capture the metrics, marshal the data into the OpenTelemetry Protocol HTTP Format, and post the data to our OTLP compatible backend - GreptimeDB.
This dependency list also pulls in the python tesla api client and pydantic, a library for helping enforce type hints in Python.
How to use OpenTelemetry
OpenTelemetry's instrumentation libraries provide developers with hooks to interact with the OpenTelemetry API and capture the metrics of interest. OpenTelemetry requires a bit of boiler plate to set up the instrumentation. At the end of this setup, you will create a meter which is used to acquire instruments that actually capture the telemetry metrics.
Creating the Meter
Instruments are acquired through meters, The configuration for how the meter operates, like how often data is read, and where the data is exported to is done by configuring Readers within the MeterProvider.
It's a bit of an annoying process, but to recap everything:
- configure
exportersandreadersand use them as arguments to initialize theprovider. - set the global
metricsobject with theproviderthat was configured - get the
meterfrom this global metrics object - use the
meterto declare yourinstrumentsthat give interfaces to do the observing
If you want to change details such as how often you export the metrics, how to mutate/filter/sample the data being read, or where you export those metrics, those configurations would be done within this meter instantiation.
In our application we have initialized the PeriodicExportingMetricReader to scrape every SCRAPE_INTERVAL (Default 300) seconds, and export those metrics to our GreptimeDB OTLP backend via the OTLPMetricExporter.
The configuration of the meter is done in ev-open-telemetry/ev_observer/ev_observer/init.py.
Making Instruments
So now that we have seen how to create the meter, we will describe the process of how to actually use that meter to make instruments and use those instruments to capture the metrics and write them to our database.
This process can be done synchronously or asynchronously. Our service uses the asynchronous collection method. To set up an asynchronous collection process, one must use the meter to create an asynchronous instrument and pass in a callback function that will be executed upon every time the data is read.
An example of setting up such an instrument is below:
def cpu_time_callback(options: CallbackOptions) -> Iterable[Observation]:
    observations = []
    with open("/proc/stat") as procstat:
        procstat.readline()  # skip the first line
        for line in procstat:
            if not line.startswith("cpu"): break
            cpu, *states = line.split()
            observations.append(Observation(int(states[0]) // 100, {"cpu": cpu, "state": "user"}))
            observations.append(Observation(int(states[1]) // 100, {"cpu": cpu, "state": "nice"}))
            observations.append(Observation(int(states[2]) // 100, {"cpu": cpu, "state": "system"}))
            # ... other states
    return observations

meter.create_observable_counter(
    "system.cpu.time",
    callbacks=[cpu_time_callback],
    unit="s",
    description="CPU time"
)
The above snippet, uses the configured meter to create the instrument system.cpu.time. The cpu_time_callback function passed in during initialization is then invoked by the PeriodicMetricReader every N milliseconds as configured on the MetricsProvider shown in the previous __init__.py file.
Encapsulating the Instrument Creation Process
Creating and managing all of these different instruments can be rather tedious. To abstract this boilerplate logic we have created the MetricCollector base class, which makes the instruments and creates the callbacks required to read and export the metrics to the OpenTelemetry API. This MetricCollector's main functions are used to initialize all of the instruments and create the metric reader callback functions that are properly scoped in closures so the most recent value of the MetricCollector property is read and exported to OpenTelemetry.
Abstract the OpenTelemetry Instrument creation in ev-open-telemetry/ev_observer/ev_observer/metrics.py
Below is a snippet of the ChargingState data that will capture the relevant Battery Level and Charging statistics of the Tesla. This subclass of MetricsCollector uses the custom_tag="metric" on the property field to indicate to the MetricsCollector that it should have an instrument created to read the value of this property.
python
class ChargeState(MetricCollector):
    battery_level: Optional[int] = Field(None, custom_tag="metric")
    charge_energy_added: Optional[float] = Field(None, custom_tag="metric")
    charge_miles_added_ideal: Optional[float] = Field(None, custom_tag="metric")
    charge_miles_added_rated: Optional[float] = Field(None, custom_tag="metric")
    ...
    charging_state: Optional[str] = None
Implementing the OpenTelemetry Collection Process
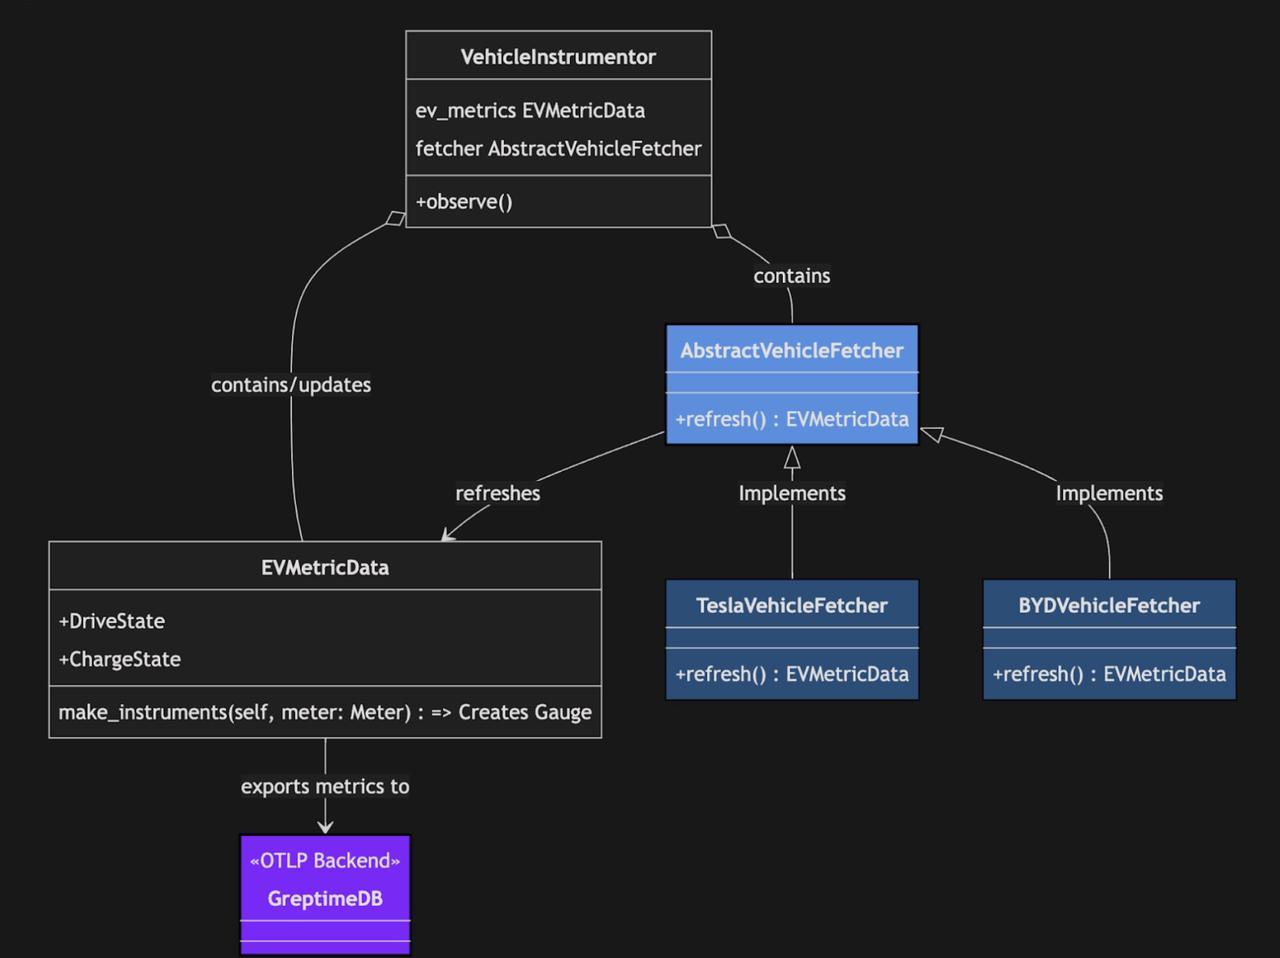
The main pieces of code to update are around the EVMetricData and the implementations of the AbstractVehicleFetcher. By updating these two modules and configuring the VehicleInstrumentor with the desired VehicleFetcher, the metrics will flow through to our dedicated GreptimeDB instance.
An overview of the components involved in the collection process is summarized in the below:
Identifying Metrics to Collect
The EVMetricData class is used to wrap several MetricCollectors that all read and export metrics. This class initializes all of the instruments and updates the values on the class. The EVMetricData also contains an attributes property that adds additional detailed dimensionality to the data being collected.
In this case we are labeling the attribute with the name of the car being monitored.
The DriveState and ChargeState subclass the MetricsProvider which is used to create the instruments as we discussed above. To collect additional metrics, we would just have to create another subclass of MetricsProvider and set it on the EvMetricsData class.
The full set of EV Metrics to collect is shown here.
Monitoring your Tesla with the Python API
The Tesla Owner API provides Tesla owners with an easy way to programmatically access the state of the vehicle and control the operations of the car.
We use this API in the TeslaMetricFetcher to implement the abstract base class. All of the logic to fetch the data from the Tesla API is set in this implementation of the AbstractVehicleDataFecher. This abstract base class must return the EVMetrics data which will be refreshed by the VehicleInstrumentor (more on that in the next section). This design provides an easy way to capture other EV Metrics in the future by simply implementing the refresh function on the AbstractVehicleDataFetcher.
Abstract Base Class and Tesla Implementation Here.
The main manager of the state and refresh cycle is the VehicleInstrumentor. The VehicleInstrumentor contains an AbstractVehicleDataFetcher instance and an EVMetricData instance. The VehicleInstrumentor class sets up the instruments and uses the fetcher to keep the data of the vehicle fresh.
VehicleInstrumentor code shown here.
Running the Project
As mentioned above, the project leverages docker containers to deliver a zero dependency experience, allowing users to get up and running quickly. The docker compose file sets up the entire network including the Tesla Metric OpenTelemetry exporter, an OTel compatible Greptime DB backend for storing metrics, and a Grafana dashboard for visualizing the metrics that were collected .
App Containerization Docker Compose file shown here
To run the Python metric collection process, you must have valid Tesla Login credentials with a registered vehicle. You will need to use these credentials to Authenticate to Tesla's servers within the process. The below command builds the containers, waits for the app container to start up, and accepts a user input token to run the process.
TESLA_USER_EMAIL={Your_Tesla_Email} docker compose up -d && \
while [ "$(docker inspect -f '{{.State.Running}}' ev-open-telemetry-ev_observer-1)" != "true" ]; do
  echo "Waiting for container ev-open-telemetry-ev_observer-1 to be up..."
  sleep 1
done && docker logs ev-open-telemetry-ev_observer-1 & docker attach ev-open-telemetry-ev_observer-1
Authenticate to Tesla
When the container is running, you will see the output in the logs
Open this URL to authenticate:
https://auth.tesla.com/oauth2/v3/authorize?...
Follow this URL in your browser window and login with your Tesla credentials. Upon successful authentication, you will be redirected to a blank page. Copy and paste the url from your browser into your terminal, which will use the token to authenticate for you. After you complete this process once, the cache.json file will be able to use the refresh token to keep the authenticated session active while the container is running.
After the app is running, data will begin flowing from your Tesla vehicle to your local GreptimeDB hosted docker image.
Setting up GreptimeDB as an OpenTelemetry Backend
A huge benefit of OpenTelemetry lies in its declarative, semantic standard which many databases adhere to for transmitting data. We are using GreptimeDB as our OTel backend to capture the EV metrics, but you can use any OpenTelemetry compatible back end to capture your data.
Greptime DB supports the Postgres wire protocol (and many others), so you can use a normal postgres client to explore the data. After building the containers as shown above, verify the data capture with the following steps:
Connect to the Database with psql:
psql -h 0.0.0.0 -p 4003 -d publicAfter you successfully connect to GreptimeDB, you can view all of the data being collected within their own automatically generated tables.
Run the query in your Postgres Client:
SELECT table_schema, table_name
public-> FROM information_schema.tables
=>
 table_schema |               table_name
--------------+----------------------------------------
 public       | chargestate_charge_rate
 public       | chargestate_battery_range
 public       | drivestate_power
 public       | chargestate_max_range_charge_counter
 public       | chargestate_charger_pilot_current
 public       | chargestate_minutes_to_full_charge
 public       | drivestate_native_location_supported
 public       | chargestate_charge_limit_soc_max
 public       | chargestate_charge_limit_soc_min
 public       | chargestate_timestamp
 public       | chargestate_charge_current_request
 public       | chargestate_charger_voltage
 public       | chargestate_ideal_battery_range
 public       | chargestate_usable_battery_level
 public       | drivestate_heading
 public       | chargestate_time_to_full_charge
 public       | drivestate_latitude
 public       | chargestate_charge_miles_added_ideal
 public       | drivestate_native_longitude
 public       | drivestate_gps_as_of
 public       | chargestate_est_battery_range
 public       | chargestate_charge_miles_added_rated
 public       | chargestate_charge_current_request_max
 public       | chargestate_charge_limit_soc
 public       | drivestate_timestamp
 public       | chargestate_charger_power
 public       | chargestate_battery_level
 public       | drivestate_native_latitude
 public       | chargestate_charge_limit_soc_std
 public       | chargestate_charge_energy_added
 public       | chargestate_charger_actual_current
 public       | drivestate_longitude
 public       | chargestate_charge_amps
(33 rows)
Explore The Metrics:
SELECT vehicle_id, greptime_timestamp, greptime_value
FROM chargestate_battery_range
ORDER BY greptime_timestamp DESC
LIMIT 10;
=>
vehicle_id |     greptime_timestamp     | greptime_value
------------+----------------------------+----------------
 Ju         | 2024-10-08 00:13:49.145132 |         117.02
 Ju         | 2024-10-08 00:12:49.136252 |         117.02
 Ju         | 2024-10-08 00:11:49.127737 |         117.02
 Ju         | 2024-10-08 00:10:49.115796 |         117.02
 Ju         | 2024-10-08 00:09:49.098576 |         117.02
 Ju         | 2024-10-08 00:08:49.085364 |         117.02
 Ju         | 2024-10-08 00:07:49.072459 |         117.02
 Ju         | 2024-10-08 00:06:49.055776 |         117.02
 Ju         | 2024-10-08 00:05:49.042333 |          117.6
 Ju         | 2024-10-08 00:04:49.022890 |          117.6
GreptimeDB’s implementation of the OpenTelemetry Protocol allows for a seamless collection of metrics. This standardization provided by OpenTelemetry allows users to easily switch between database providers and avoid vendor lock in with their observability infrastructure.
Next Time: Visualizing OpenTelemetry Metrics in Grafana
In our next post, We will utilize this data to visualize the vehicle data in Grafana. With standards like OpenTelemetry, and supporting tooling like GreptimeDB and the Python SDK, capturing time series data from an electric vehicle becomes a predictable and scalable process, and visualizing that data with OTel compatible back ends in a compatible data visualization tool like Grafana is only a short step away.
FAQ
Q: What is OpenTelemetry?
A: OpenTelemetry is a collection of APIs, SDKs, and tools. Use it to instrument, generate, collect, and export telemetry data (metrics, logs, and traces) to help you analyze your software’s performance and behavior.
Q: What is Meter in OpenTelemetry?
A: A Meter creates metric instruments, capturing measurements about a service at runtime. Meters are created from Meter Providers. Learn more here.
Q: What is Instrument in OpenTelemetry?
A: In OpenTelemetry measurements are captured by metric instruments. A metric instrument is defined by:
- Name
- Kind
- Unit (optional)
- Description (optional) Learn more here.
Q: What is Grafana?
A: Grafana is an open-source platform that helps users analyze, monitor, and visualize data from various sources.
About Greptime
Greptime offers industry-leading time series database products and solutions to empower IoT and Observability scenarios, enabling enterprises to uncover valuable insights from their data with less time, complexity, and cost.
GreptimeDB is an open-source, high-performance time-series database offering unified storage and analysis for metrics, logs, and events. Try it out instantly with GreptimeCloud, a fully-managed DBaaS solution—no deployment needed!
The Edge-Cloud Integrated Solution combines multimodal edge databases with cloud-based GreptimeDB to optimize IoT edge scenarios, cutting costs while boosting data performance.
Star us on GitHub or join GreptimeDB Community on Slack to get connected.


