In building monitoring systems, one of the most critical tasks is transferring application monitoring data efficiently from sources to storage. The market is rich with open-source tools designed for this purpose, such as Grafana's Alloy, InfluxDB's Telegraf, or classic Log collectors like Fluentd and Logstash. However, at Greptime, Vector is our go-to tool of choice. While our shared roots in Rust may have played a part in this preference, the more significant reasons lie in Vector's exceptional capabilities in functionality, performance, and ease of use. Its dual support for Logs and Metrics data, coupled with a diverse array of built-in data sources, makes it an outstanding solution for our needs.
Vector originated in 2018 and has been actively maintained for over six years. Despite being acquired by Datadog in 2021, its development has continued unhindered. Vector now serves as the core of Datadog's Observability Pipeline product while remaining an independent open-source project with regular updates.
Core Concepts
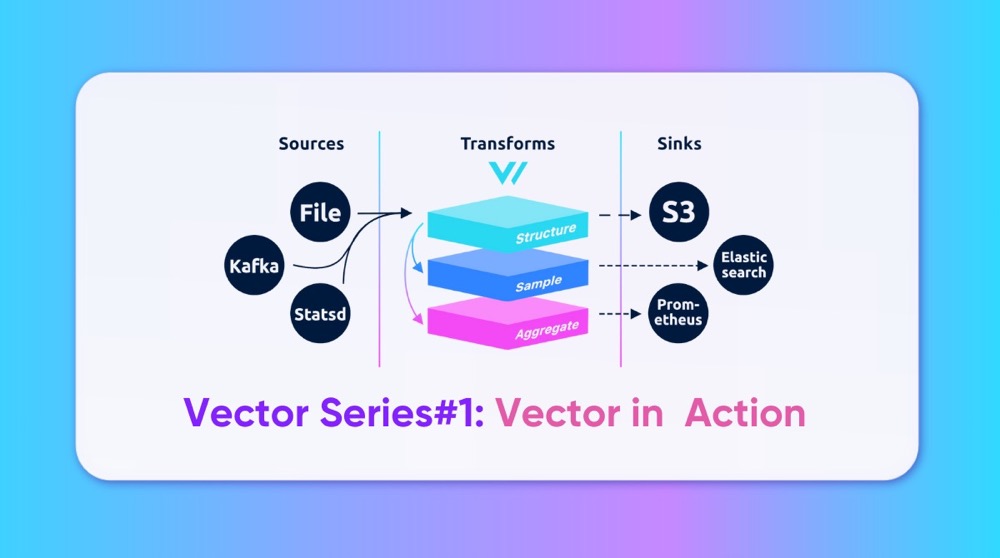
Vector abstracts its workflow into three primary modules: Sources, Transforms (optional), and Sinks. All observable data in Vector is unified under a single abstraction called Event, which encompasses two primary types: Metrics and Logs. Metrics are further categorized into familiar types like Gauge, Counter, Distribution, Histogram, and Summary—paralleling the concepts in Prometheus.

Vector supports over 50 types of Log and Metric sources and around 15 destination types. Additionally, its compatibility with general-purpose formats and protocols ensures easy integration with a wide range of tools. For data transformation, Vector includes an embedded Vector Remap Language (VRL) that enables users to define flexible transformation logic.
Internally, Vector incorporates end-to-end acknowledgment, retry mechanisms, and local buffering to ensure reliable data transmission. For scenarios requiring strict data integrity, users can combine Vector with reliable destinations to achieve dependable transmission and storage.
Collecting Metrics with Vector
Vector provides multiple options for collecting Metric data, catering to virtually any monitoring scenario. Below are some examples:
For Prometheus Users
Prometheus users employing a pull-based model have two configuration options with Vector:
- Configure Vector as a scrape target for Prometheus Agent.
- Use multiple Prometheus instances to forward data via Remote Write to Vector for processing and downstream delivery.
Here’s a simple configuration example for scraping data from a Prometheus exporter running on port 9100:
# sample.toml

[sources.prom]
type = "prometheus_scrape"
endpoints = [ "http://localhost:9100/metrics" ]
For Push-Based Models
Push-based models, such as those used by InfluxDB, can leverage Vector's http_server source and its ability to decode line protocol. Similarly, Vector supports the OpenTelemetry Protocol (OTLP), allowing it to act as an OpenTelemetry Collector and seamlessly integrate with the broader observability ecosystem.
Built-In Metric Collectors
Vector includes tools for directly collecting Metrics from systems or popular software, similar to Prometheus' exporters. Regardless of the source—Prometheus, InfluxDB, or specific software—Vector standardizes the data structure internally. This design allows for flexible many-to-many relationships between sources and sinks, enabling seamless format transformations.
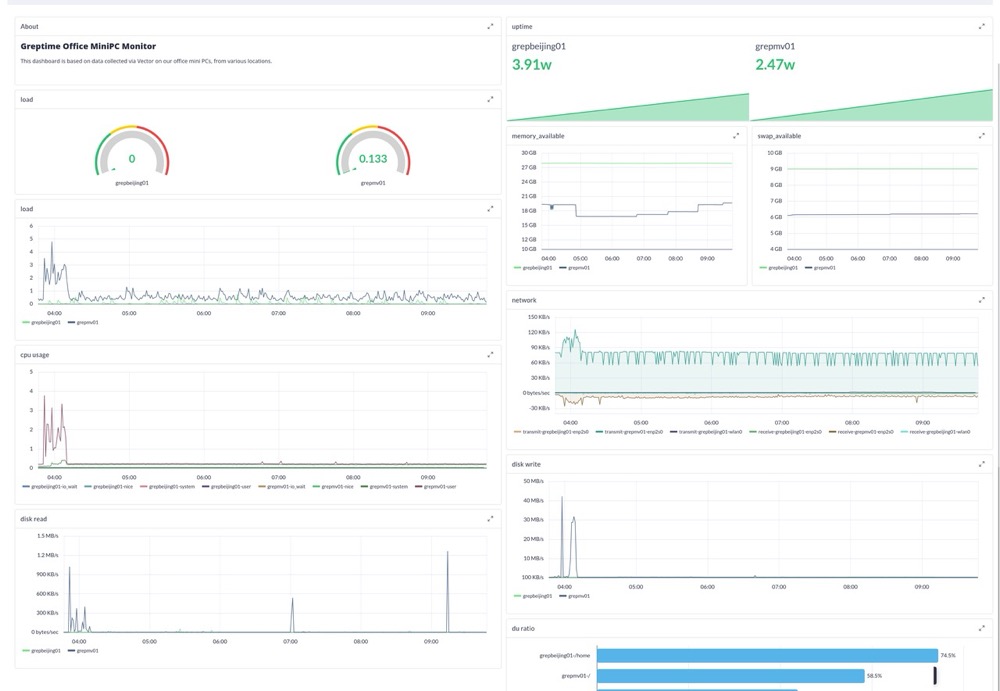
For example, the following configuration collects CPU and memory metrics from the host system and stores them in GreptimeDB:
# sample.toml
[sources.in]
type = "host_metrics"
scrape_interval_secs = 30

[sinks.out]
inputs = ["in"]
type = "greptimedb"
endpoint = "localhost:4001"
Once configured, tools like Grafana or Perses can visualize these Metrics directly.

Log Collection with Vector
Besides Metrics, Vector excels at collecting and processing Log data. Logs can either be structured key-value pairs or unstructured raw text lines.
Example: Parsing Nginx Access Logs
Here’s a configuration to track local Nginx access Logs, transform them into structured key-value pairs, and transmit them:
[sources.file_source]
type = "file"
include = [ "/logs/the-access.log" ]

[transforms.nginx]
type = "remap"
inputs = ["file_source"]
source = '''
  . = parse_nginx_log!(.message, "combined")
'''
Unstructured Logs are standardized into key-value formats within Vector, with raw Logs stored in the message field.
{
  "custom": "field",
  "host": "my.host.com",
  "message": "Hello world",
  "timestamp": "2020-11-01T21:15:47+00:00"
}
The transformed fields are available as top-level JSON keys, ready to be serialized or stored based on the sink’s requirements.
Persisting Logs
To persist Logs, simply configure a compatible Log destination. For example, the following setup sends Logs to GreptimeDB:
[sinks.sink_greptime_logs]
type = "greptimedb_logs"
table = "ngx_access_log"
pipeline_name = "demo_pipeline"
compression = "gzip"
inputs = [ "nginx" ]
endpoint = "http://greptimedb:4000"
Since we have configured a transform step, the
inputsparameter here should be set to the name of the transform node.
Sample Code and Visualization
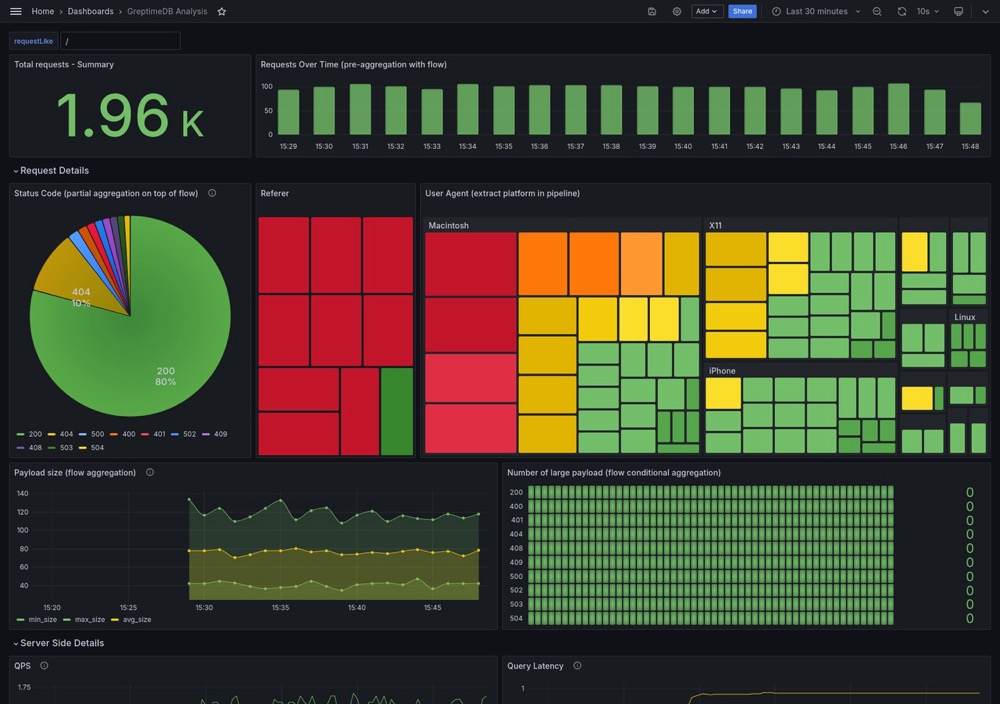
For a complete example of collecting Nginx access Logs and storing them in GreptimeDB, visit our GitHub repository.

Converting Logs to Metrics
In Vector, Logs and Metrics are interchangeable via Transforms or source decoding. For instance, a Kafka topic containing Metrics encoded in InfluxDB line protocol can be consumed, decoded, and stored in a time-series database like GreptimeDB or InfluxDB.
Here’s a simple configuration example: the decoding.codec parameter has already been set up to handle data format conversion, so you can directly use a Metrics destination to receive this type of data (in this example, GreptimeDB is configured as the destination):
[sources.metric_mq]
type = "kafka"
group_id = "vector0"
topics = ["test_metric_topic"]
bootstrap_servers = "kafka:9092"
decoding.codec = "influxdb"

[sinks.sink_greptime_metrics]
type = "greptimedb"
inputs = [ "metric_mq" ]
endpoint = "greptimedb:4001"
Here’s a breakdown:
Metric_mqsource: Consumes Kafka messages fromtest_Metric_topicand decodes them with InfluxDB format.sink_greptime_Metrics: Writes the decoded Metrics to GreptimeDB.
The full configuration example is available in our GitHub demo repository.
What’s Next?
This article introduced Vector’s core concepts and basic configuration examples to help you get started. In future posts, we’ll delve deeper into using Vector’s Transforms for advanced data processing, unlocking its potential as a powerful data-cleaning tool.
About Greptime
Greptime offers industry-leading time series database products and solutions to empower IoT and Observability scenarios, enabling enterprises to uncover valuable insights from their data with less time, complexity, and cost.
GreptimeDB is an open-source, high-performance time-series database offering unified storage and analysis for metrics, logs, and events. Try it out instantly with GreptimeCloud, a fully-managed DBaaS solution—no deployment needed!
The Edge-Cloud Integrated Solution combines multimodal edge databases with cloud-based GreptimeDB to optimize IoT edge scenarios, cutting costs while boosting data performance.
Star us on GitHub or join GreptimeDB Community on Slack to get connected.


