In our previous article, What is Log Aggregation? Key Factors to consider for a good Log Management System, we explored the foundational aspects of log aggregation, discussing its importance and the criteria for evaluating log aggregation solutions.
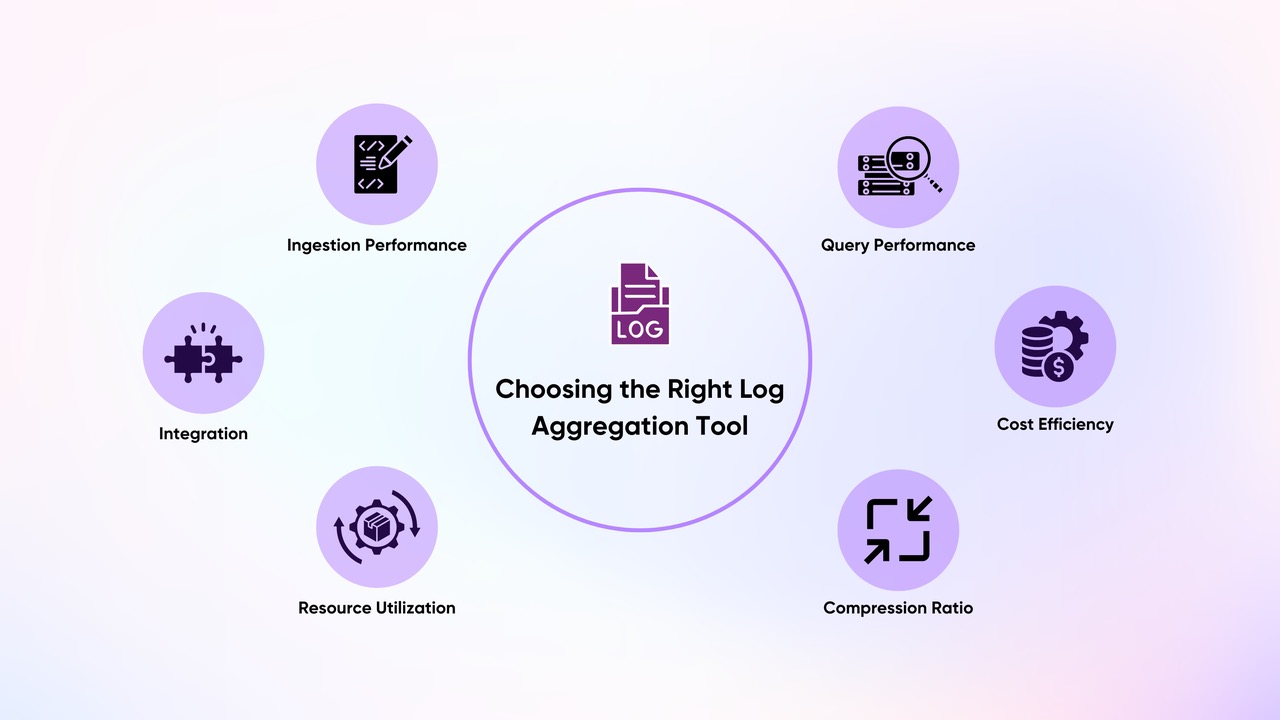
By examining key metrics like resource utilization, compression efficiency, ingestion and query performance, and third-party integrations, we aim to provide a comprehensive evaluation to help you make an informed choice for your log aggregation needs. Whether you're focused on cost efficiency, blazing-fast queries, or a unified observability platform, this comparison will highlight the strengths and trade-offs of each tool.
Here, we will take 3 major players and compare them across the above criteria. The three platforms we are looking at are:
- ElasticSearch: Index Everything, Retrieve Quickly
- ClickHouse: Trailblazing architecture, Balanced Performance
- GreptimeDB: Unified Observability Platform, Optimized for Cost Savings
Benchmark Comparison
Resource Utilization
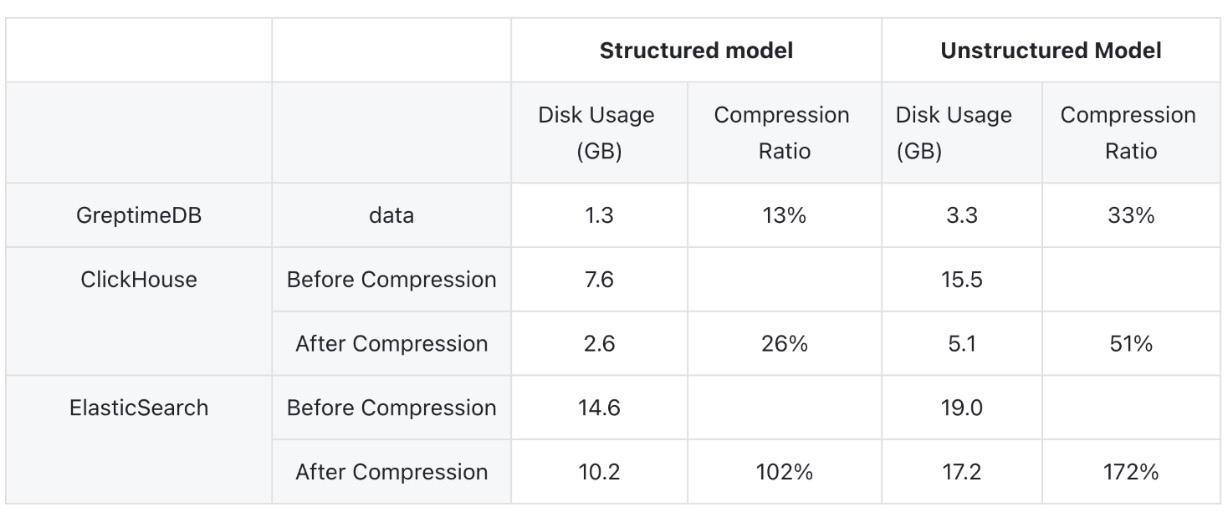
📍 GreptimeDB offers the most efficient resource utilization, while ElasticSearch's large index size is the most expensive. GreptimeDB is optimized for cost savings by making remote object storage a first class citizen.

ElasticSearch
ElasticSearch's Lucene-based engine offers powerful full-text search capabilities but tends to be resource-intensive. Running on the Java Virtual Machine (JVM), it incurs overhead from garbage collection and memory management, leading to higher CPU and memory usage. The architecture relies on creating large inverted indexes, which consume significant disk space and increase I/O operations. Frequent index updates and segment merges add to CPU load and can impact performance. These factors make ElasticSearch more demanding in terms of CPU, memory, and disk resources compared to alternatives like ClickHouse and GreptimeDB. Careful tuning and robust hardware are often required to maintain optimal performance in log aggregation scenarios.
ClickHouse
ClickHouse's columnar storage format allows it to read only the necessary columns for a query, reducing disk I/O and memory usage. Implemented in C++, ClickHouse benefits from low-level memory management, resulting in lower memory overhead and efficient CPU usage without the extra layers of a virtual machine. It processes data using vectorized query execution, handling batches of data to take advantage of modern CPU architectures and enhance throughput.
GreptimeDB
GreptimeDB is engineered specifically for time-series data, focusing on efficient resource utilization to handle high-throughput log ingestion and real-time querying. Written in Rust, it benefits from the language's performance and memory safety, resulting in low memory overhead and efficient CPU usage without the overhead of a virtual machine or garbage collection.
A noteworthy advantage of using GreptimeDB is its focus on saving data to object storage. Object Storage usually runs at a fraction of the cost as local ssd which allows for much more efficient scaling- allowing the system to decouple its storage needs from its compute needs.
Compression
📍 GreptimeDB has the best compression ratio out of the box and ElasticSearch has the worst.

ElasticSearch
Elasticsearch supports two types of compressions: LZ4 and DEFLATE. The compression occurs by index, opposed to by column and its statically set at the creation of the index. The inflexibility and size of the index contributes to its relatively poor compression ratio.
ClickHouse
ClickHouse uses a columnar storage format, which allows it to apply compression algorithms effectively on a per-column basis. It supports several compression codecs, including LZ4, ZSTD, Delta, and DoubleDelta. Users can configure the best codec based on the data type and desired compression ratio, and performance trade-offs. ClickHouse can achieve an excellent compression ratio but requires the user to understand the nuances of fitting each compression type to the particular data being collected and design+configure their table accordingly
GreptimeDB
GreptimeDB is designed specifically for time-series data. It dynamically employs compression algorithms to best suit the type and cardinality of the data being stored. This clever selection process and range of compression algorithms like dictionary compression and Chimp Algorithm helps GreptimeDB achieve the best compression score out of the box.
Ingestion Performance
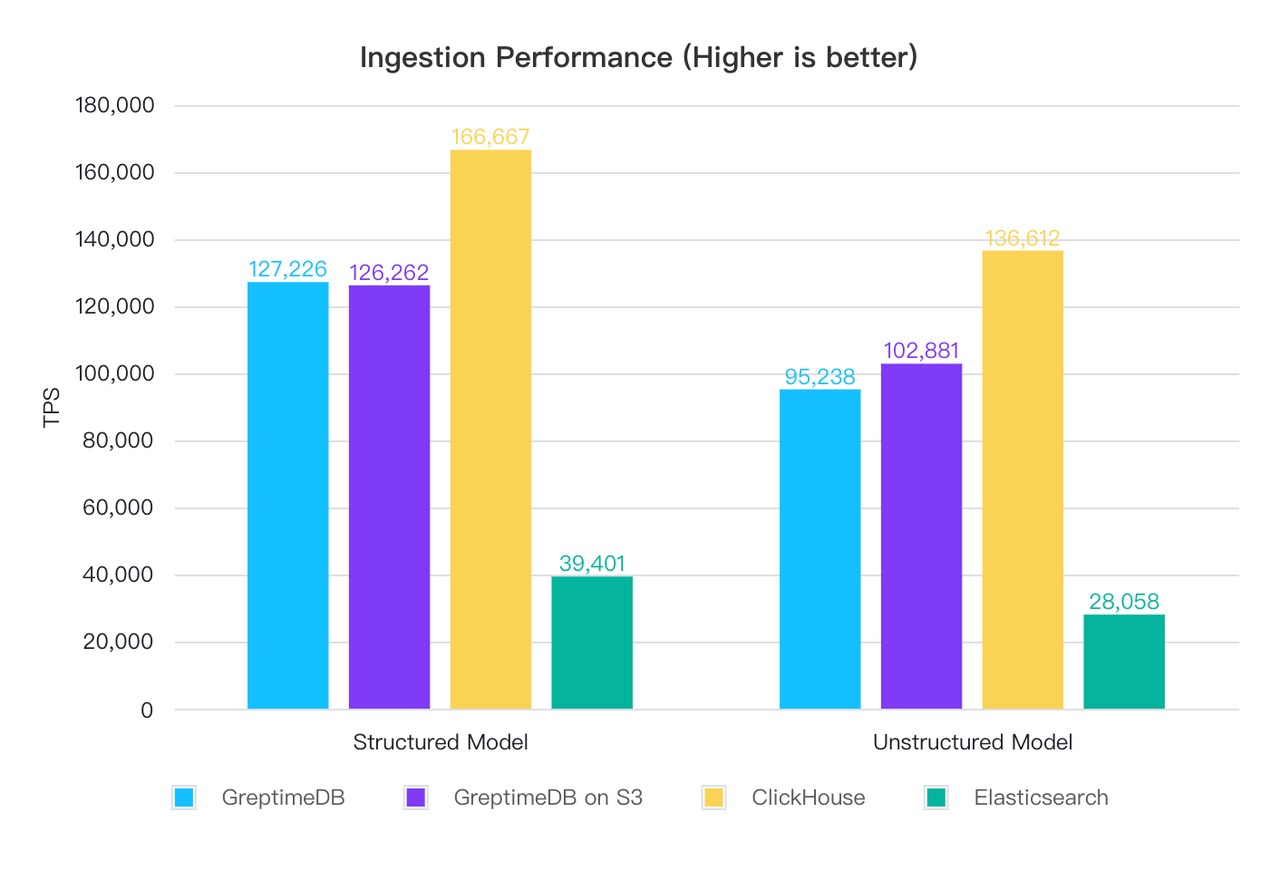
📍 ClickHouse offers the highest ingestion performance, followed by GreptimeDB while ElasticSearch lags behind in high-throughput scenarios.

ElasticSearch
ElasticSearch is designed for flexible search and analytics, but when it comes to ingestion performance, it can struggle with very high volumes of log data. Its architecture relies on creating and updating inverted indices, which are resource-intensive operations. The process involves parsing incoming logs, and updating indices in near real-time, which can become a bottleneck under heavy write loads. Additionally, the need for frequent segment merges during indexing can further degrade ingestion performance. ElasticSearch is generally capable of handling moderate ingestion rates but may require significant tuning and scaling efforts to keep up with very high ingestion rates typical in large-scale log aggregation scenarios.
ClickHouse
ClickHouse is optimized for high-throughput data ingestion, especially for structured, columnar data. Its MergeTree architecture utilizes partitioning, primary key indexing, and background merging to enhance ingestion through parallelization and batch inserts. However, ClickHouse may require careful schema design and data preprocessing to achieve optimal ingestion rates. The necessity to match the data types, partition keys, and indexes can introduce additional overhead in the configuration of your data pipeline.
GreptimeDB
GreptimeDB excels in high-ingestion performance, particularly for time-series log data. Greptime’s LSM-Tree based, Mito engine uses efficient encoding and compression techniques during ingestion without sacrificing speed. Its architecture supports horizontal scaling, allowing it to maintain high ingestion rates even as data volumes grow. Furthermore, GreptimeDB requires minimal data transformation before ingestion, simplifying the data pipeline and reducing latency. This makes GreptimeDB particularly well-suited for environments where logs are generated at a high velocity and need to be ingested in real-time.
Query Performance
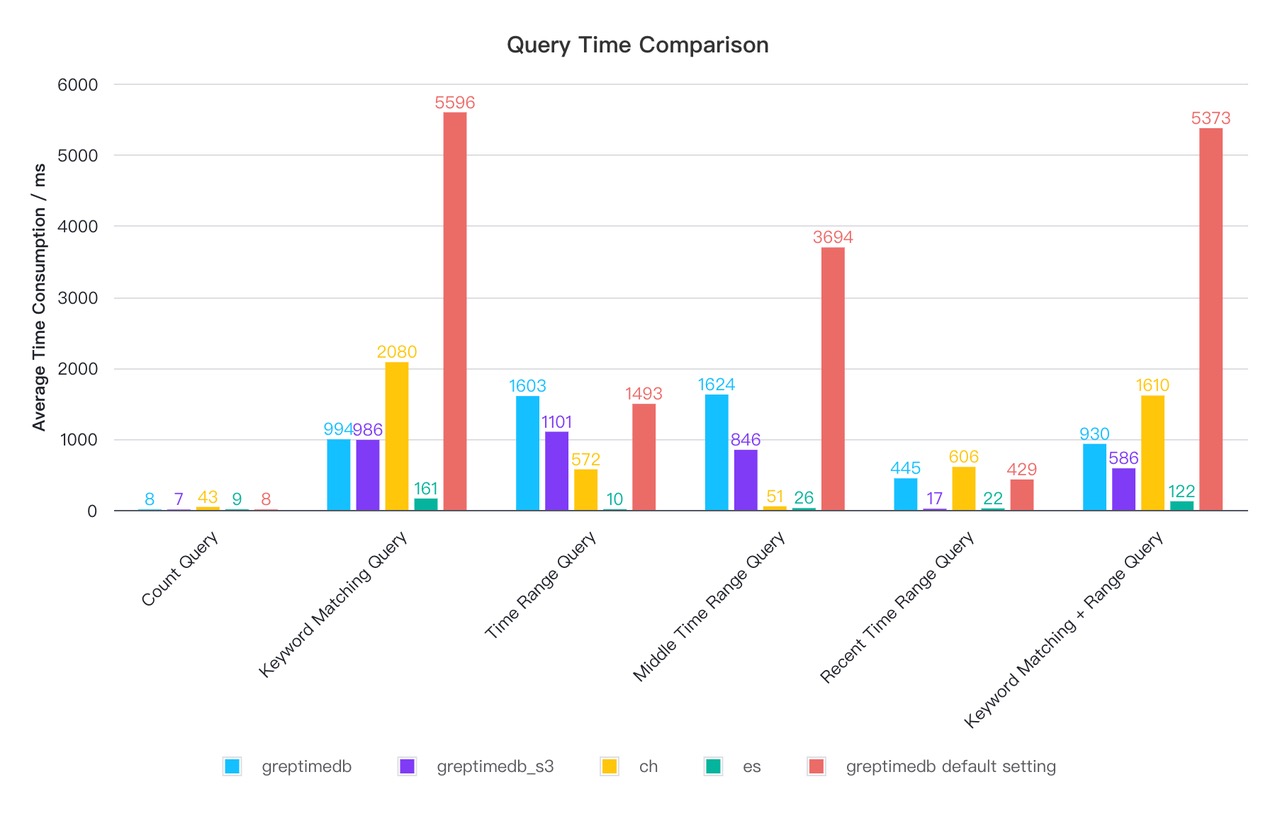
📍 ElasticSearch offers the best query performance, benefitting from its higher cpu utilization and heavier indexing, Greptime’s tuned instance rivals ClickHouse and even outperforms in some cases. Notably, GreptimeDB’s performance remains comparable even when querying against remote s3 object storage.

Elasticsearch
ElasticSearch excels in full-text search and real-time data indexing. It supports complex queries, including term queries, range queries, aggregations, and geo-spatial queries. For search operations, Elasticsearch can return results in milliseconds, even when working with large datasets. However, for analytical queries involving heavy aggregations or joins (which Elasticsearch does not natively support), performance may degrade. Elasticsearch uses doc values and inverted indices to optimize query speed, but it may not match the performance of columnar databases for analytical workloads.
ClickHouse
Clickhouse’s impressive query processing and storage layers offer the most balanced performance thanks to features like intelligent merge-time operations, vectorized query execution, and parallel processing. Clickhouse architecture has meticulous attention to detail in its low level operations management.
GreptimeDB
GreptimeDB’s query engine is built on top of Apache DataFusion. DataFusion features a full query planner, a columnar, streaming, multi-threaded, vectorized execution engine, and partitioned data sources. These components are extensible which Greptime has leveraged to optimize performance for its Time Series use cases.
Query Interface
📍 GreptimeDB implements SQL compatibility to the level of supporting postgres and mysql server protocol, whereas ElasticSearch has its own domain specific json based query language. Clickhouse is SQL-like with ANSI-SQL based syntax.
Elasticsearch
Elasticsearch uses its own Query DSL which is JSON-based. While powerful and expressive, it can be less intuitive for users accustomed to SQL. Writing complex queries may require a deep understanding of the DSL's structure and capabilities. For example, a simple term query in Elasticsearch DSL looks like:
{
  "query": {
    "term": {
      "user": "kimchy"
    }
  }
}
Learning this DSL can require additional training and may slow down adoption for teams not familiar with it.
ClickHouse
ClickHouse uses a SQL like interface which is very similar to standard ANSI SQL. This familiarity reduces the learning curve and allows users to leverage existing SQL knowledge. Clickhouse includes some custom aggregation functions for easily rolling up data for its OLAP usecase
SELECT
        year,
        month,
        day,
        count(*)
FROM t GROUP BY ROLLUP(year, month, day);
GreptimeDB
GreptimeDB offers an (almost) fully compliant SQL interface. In fact, you can use mysql or psql clients to connect directly to GreptimeDB, due to the support of the underlying server protocols. Greptime also exposes Apache DataFusion window/scalar/aggregate function and geospatial functions, like H3 Index Querying.
-- Select all rows from the system_metrics table and idc_info table where the idc_id matches, and include null values for idc_info without any matching system_metrics
SELECT b.*
FROM system_metrics a
RIGHT JOIN idc_info b
ON a.idc = b.idc_id;

-- Encode coordinate (latitude, longitude) into h3 index at given resolution
SELECT h3_latlng_to_cell(37.76938, -122.3889, 1);
Supported Third-Party Integrations
📍 ElasticSearch and Clickhouse have the most mature ecosystems with a huge range of integrations. Greptime stands out by supporting a unified database for observability signals by turning your logs into metrics.
ElasticSearch
Being one of the oldest technologies in this comparison, Elasticsearch has a rich ecosystem of partners and developers building on top of it. A scroll through the supported integrations page will be a nice workout for your index fingers. Though one downside of ElasticSearch is its integration into OpenTelemetry, through the well known ELK stack, involves setting up another service called the Elastic APM server. This additional component will allow you to integrate directly with the OpenTelemetry ecosystem, but it complicates your overall deployment.
ClickHouse
ClickHouse also has a large number of core, 3rd party, and community integrations. They have full OpenTelemetry support with logs, allowing users to instrument services with OpenTelemetry to write logs directly into ClickHouse. Clickhouse Cloud can support tight integrations with Kafka Brokers through its ClickPipe feature.
GreptimeDB
As a newer entrant, GreptimeDB is in the process of expanding its integrations, but it already has core support for major observability tooling like Prometheus, Grafana, Vector, and EMQX. GreptimeDB’s support for capturing both Metrics and Logs allows users to use one database as an OpenTelemetry backend to forward all observability metrics to. This can greatly simplify an observability stack for monitoring use cases.
Choosing The Right Solution
Like most software decisions, choosing the appropriate log management tool depends on your organization's specific needs and priorities:
If you desire to have the fastest retrieval on unstructured search scenarios and doesn’t mind spending a bit more on infrastructure to achieve it, Elasticsearch might be a good choice.
If you want to achieve high-performance analytical querying over large datasets, and have a dedicated engineering resource to configure and tune the tables to for your specific needs ClickHouse is a strong choice.
If saving on costs, or simplifying your observability deployment by unifying metrics and logs into one platform sounds attractive, GreptimeDB’s architecture and leveraging of object storage will help to accomplish this.
Ultimately, the best log management solution is one that aligns with your technical requirements, budget, and long-term observability goals.
Sources
- Elastic Storage Resource Requirements: https://www.elastic.co/blog/elasticsearch-storage-the-true-story-2.0
- ElasticSearch has a big index: https://serverfault.com/questions/635014/elasticsearch-is-using-way-too-much-disk-space
- ElasticSearch Compression config: https://www.elastic.co/guide/en/elasticsearch/reference/current/index-modules.html
- Compression in ClickHouse: https://clickhouse.com/docs/en/data-compression/compression-in-clickhouse
- Clickhouse Design: https://clickhouse.com/docs/en/concepts/why-clickhouse-is-so-fast https://clickhouse.com/docs/en/engines/table-engines/mergetree-family/mergetree
- Greptime Mito Engine: https://www.greptime.com/blogs/2023-10-30-mito-engine
- Benchmarks: https://greptime.com/blogs/2024-08-22-log-benchmark
- Apache Data Fusion: https://datafusion.apache.org/
About Greptime
Greptime offers industry-leading time series database products and solutions to empower IoT and Observability scenarios, enabling enterprises to uncover valuable insights from their data with less time, complexity, and cost.
GreptimeDB is an open-source, high-performance time-series database offering unified storage and analysis for metrics, logs, and events. Try it out instantly with GreptimeCloud, a fully-managed DBaaS solution—no deployment needed!
The Edge-Cloud Integrated Solution combines multimodal edge databases with cloud-based GreptimeDB to optimize IoT edge scenarios, cutting costs while boosting data performance.
Star us on GitHub or join GreptimeDB Community on Slack to get connected.


