On this page
In GreptimeDB version 0.9, we introduced log storage and fulltext index, allowing users to handle metrics, logs, and events using the same data model and query language (SQL). You can refer to this blog for detailed feature introduction.
This report provides an assessment of the standalone performance for log storage and fulltext fuzzy searching, including ingest/query performance, resource usage, and compression ratio. In observability, commonly used log systems include the classic ELK stack (ElasticSearch) and the widely used ClickHouse. We choose these two systems for a horizontal comparison. Since GreptimeDB is designed for cloud-native environments, we also tested the ingest/query performance based on S3 object storage.
GreptimeDB vs. Elasticsearch vs. ClickHouse Performance Benchmark Results
GreptimeDB demonstrates the best or second-best performance in terms of ingestion performance and resource usage (CPU, memory, and disk). Moreover, its performance remains consistent when using S3 object storage, with no degradation compared to local disk. On a single machine with 8 cores and 16GB of memory, it achieves a ingest rate of 120,000 log lines per second, which is 3x faster than ES, with the best compression ratio of 13% and memory usage only 1/32 of ES.
Elasticsearch has the highest resource consumption and the slowest ingest rate, but in return, it offers the best query performance.
GreptimeDB performs similarly to ClickHouse in terms of query speed, making it a good choice for handling log data. The performance differences across these various dimensions are primarily due to the different usage scenarios targeted by these three products, which we will discuss further in the summary. Below is the detailed test report.
Test Scenario
Test Data and Procedure
We choose the Nginx access log as our log data format, with a sample log entry as follows:
129.37.245.88 - meln1ks [01/Aug/2024:14:22:47 +0800] "PATCH /observability/metrics/production HTTP/1.0" 501 33085We use the open-source observability data pipeline vector to generate and ingest the data mentioned above. The overall testing process is as follows:
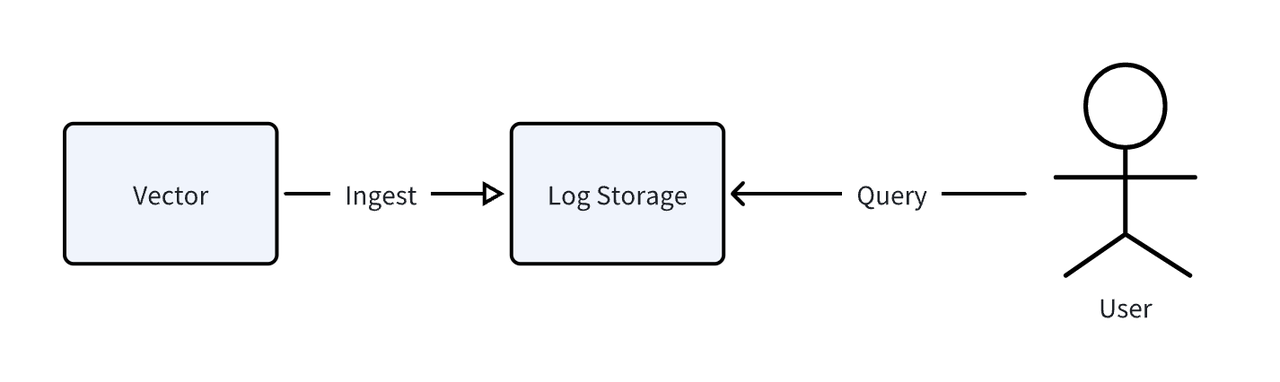
After data ingestion, we conduct query tests using SQL (for GreptimeDB and ClickHouse) and the Elasticsearch HTTP protocol.
Ingestion Methods
We differentiated between two ingestion methods:
structured model: Each log line is split into multiple fields. For example, from the above log line, we can extract fields like
http_version,ip,method,path,status, etc. We use vector for parsing and splitting logs.Unstructured model: The log data is stored as a complete
messagetext field (excluding the timestamp) with full-text indexing enabled.
We will also compare the differences between these two modes.
Hardware and Software Specifications
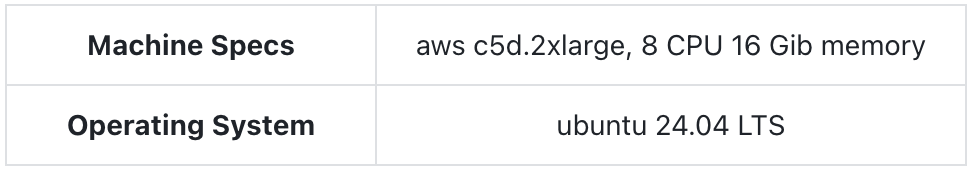
Hardware Environment
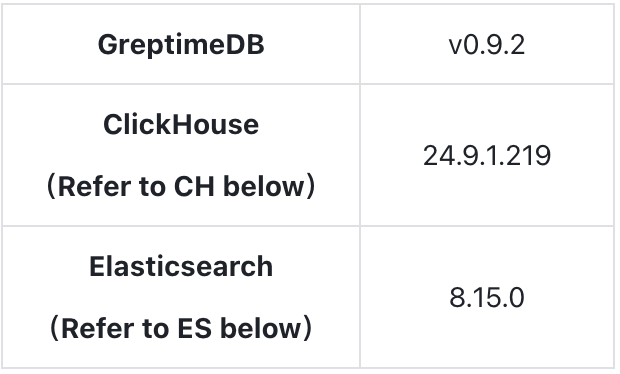
Software Versions and Settings
Unless otherwise noted, all three databases use default configurations. GreptimeDB S3 configuration with object storage read/write Buffer/Cache enabled:
toml
[storage]
type = "S3"
bucket = "ap-southeast-1-test-bucket"
root = "logitem_data"
access_key_id = "xxx"
secret_access_key = "xxx"
endpoint = "endpoint"
region = "ap-southeast-1"
cache_path = "/home/ubuntu/s3cache"
cache_capacity = "20G"

[[region_engine]]
[region_engine.mito]
enable_experimental_write_cache = true
experimental_write_cache_size = "20G"
Structured Model Configuration
Vector parsing configuration:
toml
[transforms.parse_logs]
type = "remap"
inputs = ["demo_logs"]
source = '''
. = parse_regex!(.message, r'^(?P<ip>\S+) - (?P<user>\S+) \[(?P<timestamp>[^\]]+)\] "(?P<method>\S+) (?P<path>\S+) (?P<http_version>\S+)" (?P<status>\d+) (?P<bytes>\d+)$')

# Convert timestamp to a standard format
.timestamp = parse_timestamp!(.timestamp, format: "%d/%b/%Y:%H:%M:%S %z")

# Convert status and bytes to integers
.status = to_int!(.status)
.bytes = to_int!(.bytes)
'''
GreptimeDB table creation statement:
sql
-- Enabled append mode, and set user, path, and status as Tag types (primary keys)
CREATE TABLE IF NOT EXISTS `test_table` (
    `bytes` Int64 NULL,
    `http_version` STRING NULL,
    `ip` STRING NULL,
    `method` STRING NULL,
    `path` STRING NULL,
    `status` SMALLINT UNSIGNED NULL,
    `user` STRING NULL,
    `timestamp` TIMESTAMP(3) NOT NULL,
    PRIMARY KEY (`user`, `path`, `status`),
    TIME INDEX (`timestamp`)
)
ENGINE=mito
WITH(
    append_mode = 'true'
);
ClickHouse table creation statement:
sql
-- Using default MergeTree engine, with the same sorting key.
CREATE TABLE IF NOT EXISTS test_table
(
    bytes UInt64 NOT NULL,
    http_version String NOT NULL,
    ip String NOT NULL,
    method String NOT NULL,
    path String NOT NULL,
    status UInt8 NOT NULL,
    user String NOT NULL,
    timestamp String NOT NULL,
)
ENGINE = MergeTree()
ORDER BY (user, path, status);
Elasticsearch table creation statement (mapping):
json
{
  "vector-2024.08.19": {
    "mappings": {
      "properties": {
        "bytes": {
          "type": "long"
        },
        "http_version": {
          "type": "text",
          "fields": {
            "keyword": {
              "type": "keyword",
              "ignore_above": 256
            }
          }
        },
        "ip": {
          "type": "text",
          "fields": {
            "keyword": {
              "type": "keyword",
              "ignore_above": 256
            }
          }
        },
        "method": {
          "type": "text",
          "fields": {
            "keyword": {
              "type": "keyword",
              "ignore_above": 256
            }
          }
        },
        "path": {
          "type": "text",
          "fields": {
            "keyword": {
              "type": "keyword",
              "ignore_above": 256
            }
          }
        },
        "status": {
          "type": "long"
        },
        "timestamp": {
          "type": "date"
        },
        "user": {
          "type": "text",
          "fields": {
            "keyword": {
              "type": "keyword",
              "ignore_above": 256
            }
          }
        }
      }
    }
  }
}
Unstructured Model Configuration
GreptimeDB table creation statement:
sql
--message column with FULLTEXT option, full-text indexing enabled
CREATE TABLE IF NOT EXISTS `test_table` (
    `message` STRING NULL FULLTEXT WITH(analyzer = 'English', case_sensitive = 'false'),
    `timestamp` TIMESTAMP(3) NOT NULL,
    TIME INDEX (`timestamp`)
)
ENGINE=mito
WITH(
    append_mode = 'true'
);
ClickHouse table creation statement:
sql
-- Similarly, create a full-text index on the message column
SET allow_experimental_full_text_index = true;
CREATE TABLE IF NOT EXISTS test_table
(
    message String,
    timestamp String,
    INDEX inv_idx(message) TYPE full_text(0) GRANULARITY 1
)
ENGINE = MergeTree()
ORDER BY tuple();
Elasticsearch:
json
{
  "vector-2024.08.19": {
    "mappings": {
      "properties": {
        "message": {
          "type": "text",
          "fields": {
            "keyword": {
              "type": "keyword",
              "ignore_above": 256
            }
          }
        },
        "service": {
          "type": "text",
          "fields": {
            "keyword": {
              "type": "keyword",
              "ignore_above": 256
            }
          }
        },
        "source_type": {
          "type": "text",
          "fields": {
            "keyword": {
              "type": "keyword",
              "ignore_above": 256
            }
          }
        },
        "timestamp": {
          "type": "date"
        }
      }
    }
  }
}
Ingestion Performance
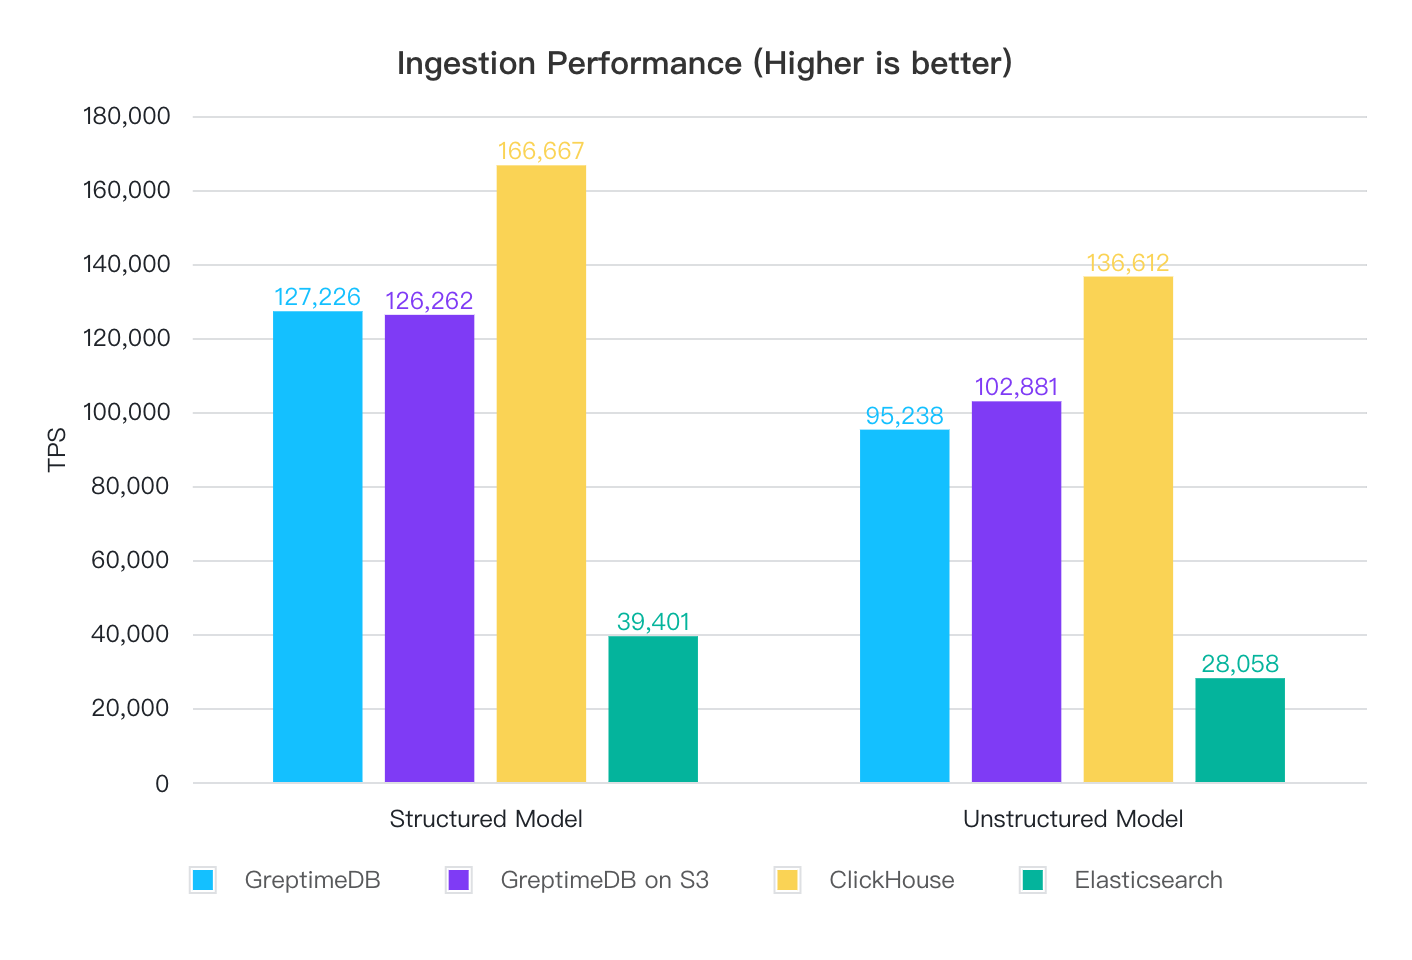
Ingest 100 million records with no speed limitation:
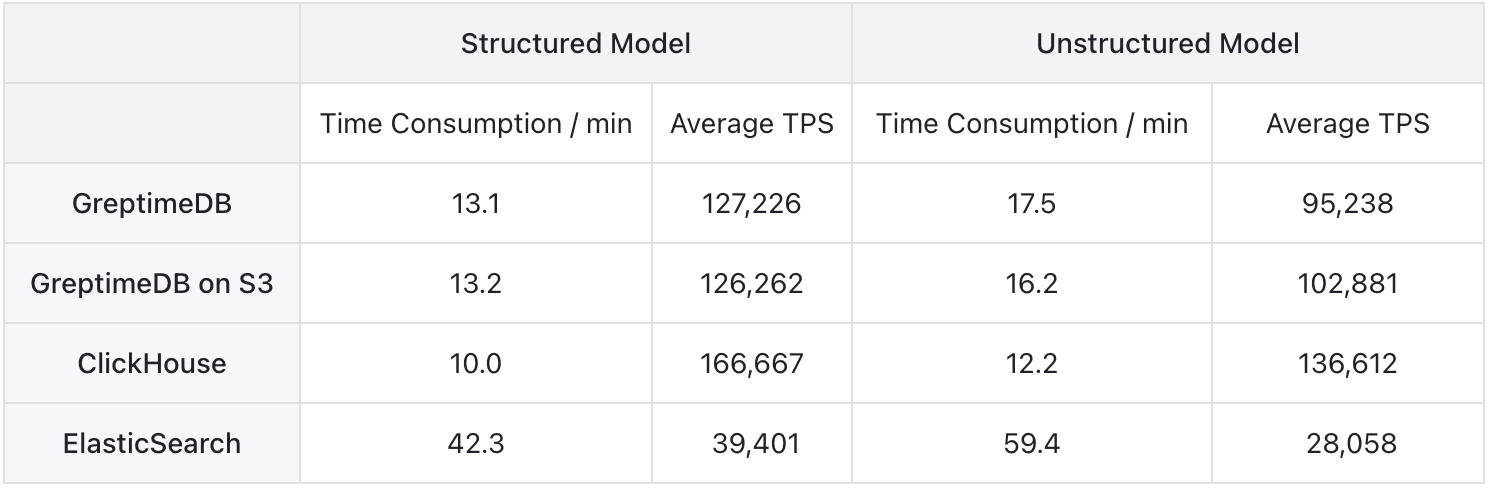
In structured model, CH has the best ingestion performance, while GreptimeDB's local disk mode and S3 mode have similar ingestion performance, both around 120,000 to 130,000 rows per second. ES performs the worst, with a significant gap, achieving only one-third of GreptimeDB's performance and one-quarter of ClickHouse's performance.
In unstructured model, the overall comparison remains unchanged, but ingestion performance decreases across the board: GreptimeDB's performance drops by 25%, ClickHouse's by 18%, and ES's by 29%. This shows that full-text indexing has a significant impact on ingestion performance.
Resource Utilization and Compression Ratio
Resource Utilization
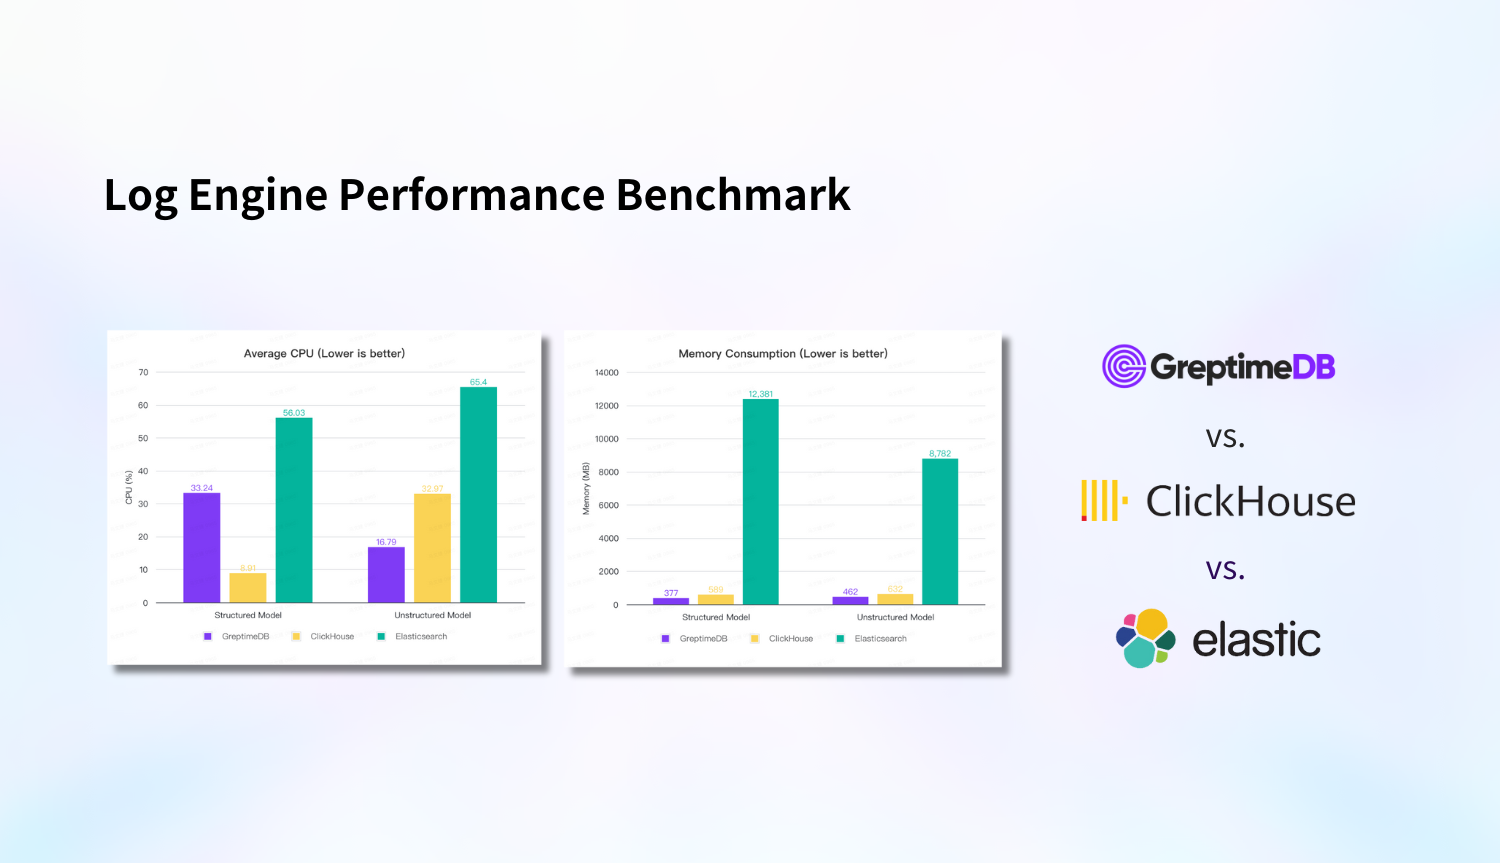
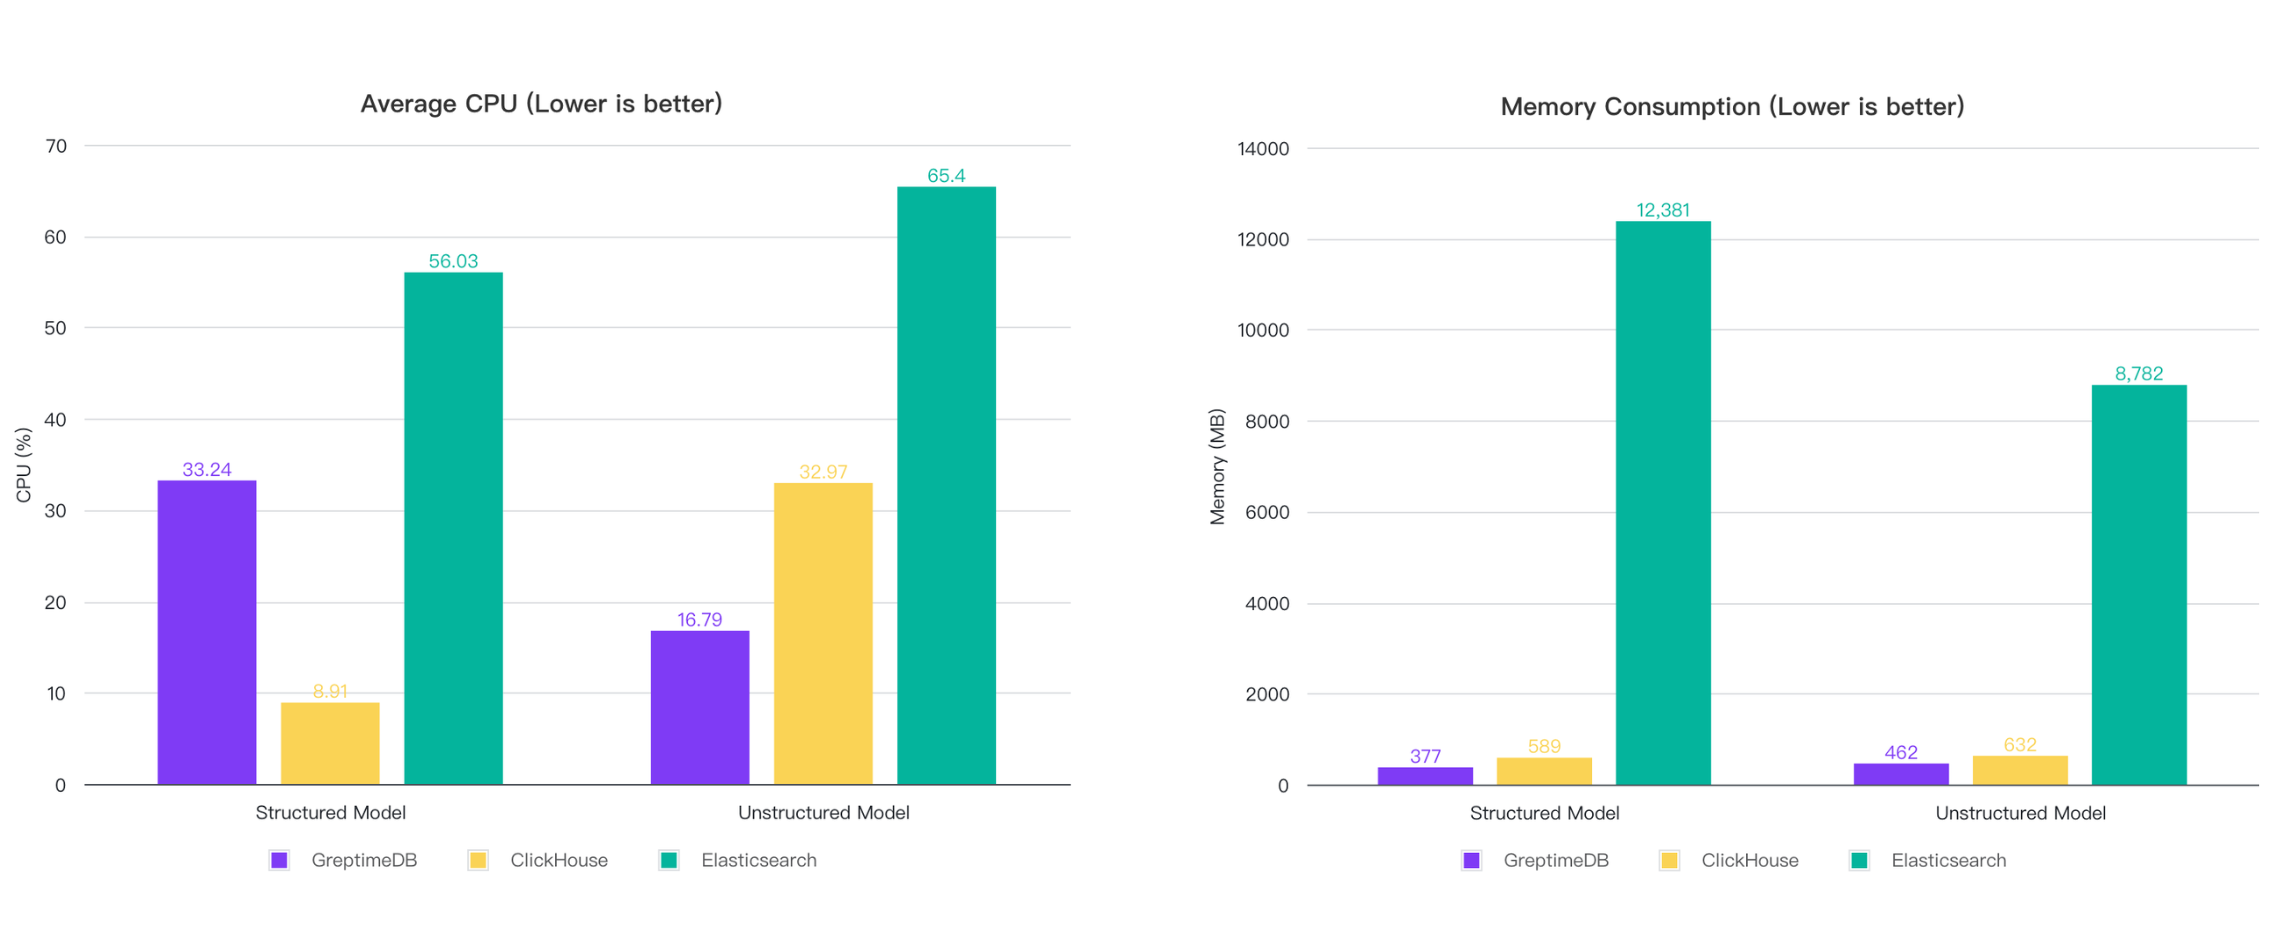
To observe resource utilization during the writing process, we limited the writing speed to 20,000 rows per second and then collected CPU and memory usage data:
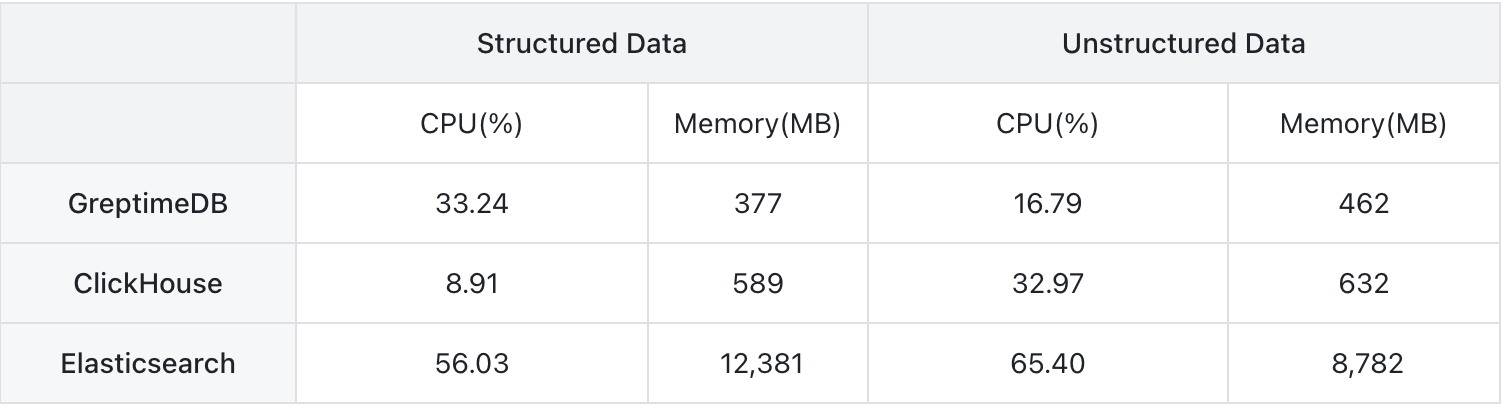
In structured model, ClickHouse has the lowest CPU consumption, followed by GreptimeDB. ES consumes significantly more, with CPU usage being 6x that of ClickHouse and 1.7x that of GreptimeDB. In terms of memory, GreptimeDB consumes the least, followed by ClickHouse, while ES's memory usage exceeds 12 GB, which is 21x that of ClickHouse and 32x that of GreptimeDB.
In unstructured model, GreptimeDB is the most efficient in terms of both CPU and memory usage, followed by ClickHouse. ES continues to have the highest consumption, particularly in memory.
During the testing process, it was found that ClickHouse's CPU usage fluctuated the most, reaching a peak of 139%.
These results are related to the architecture of each system and the specific scenarios they are optimized for, which we will analyze at the end.
Compression Ratio
The original 1 billion rows of data take up around 10 GB. Let's look at the compression ratios of the three systems:
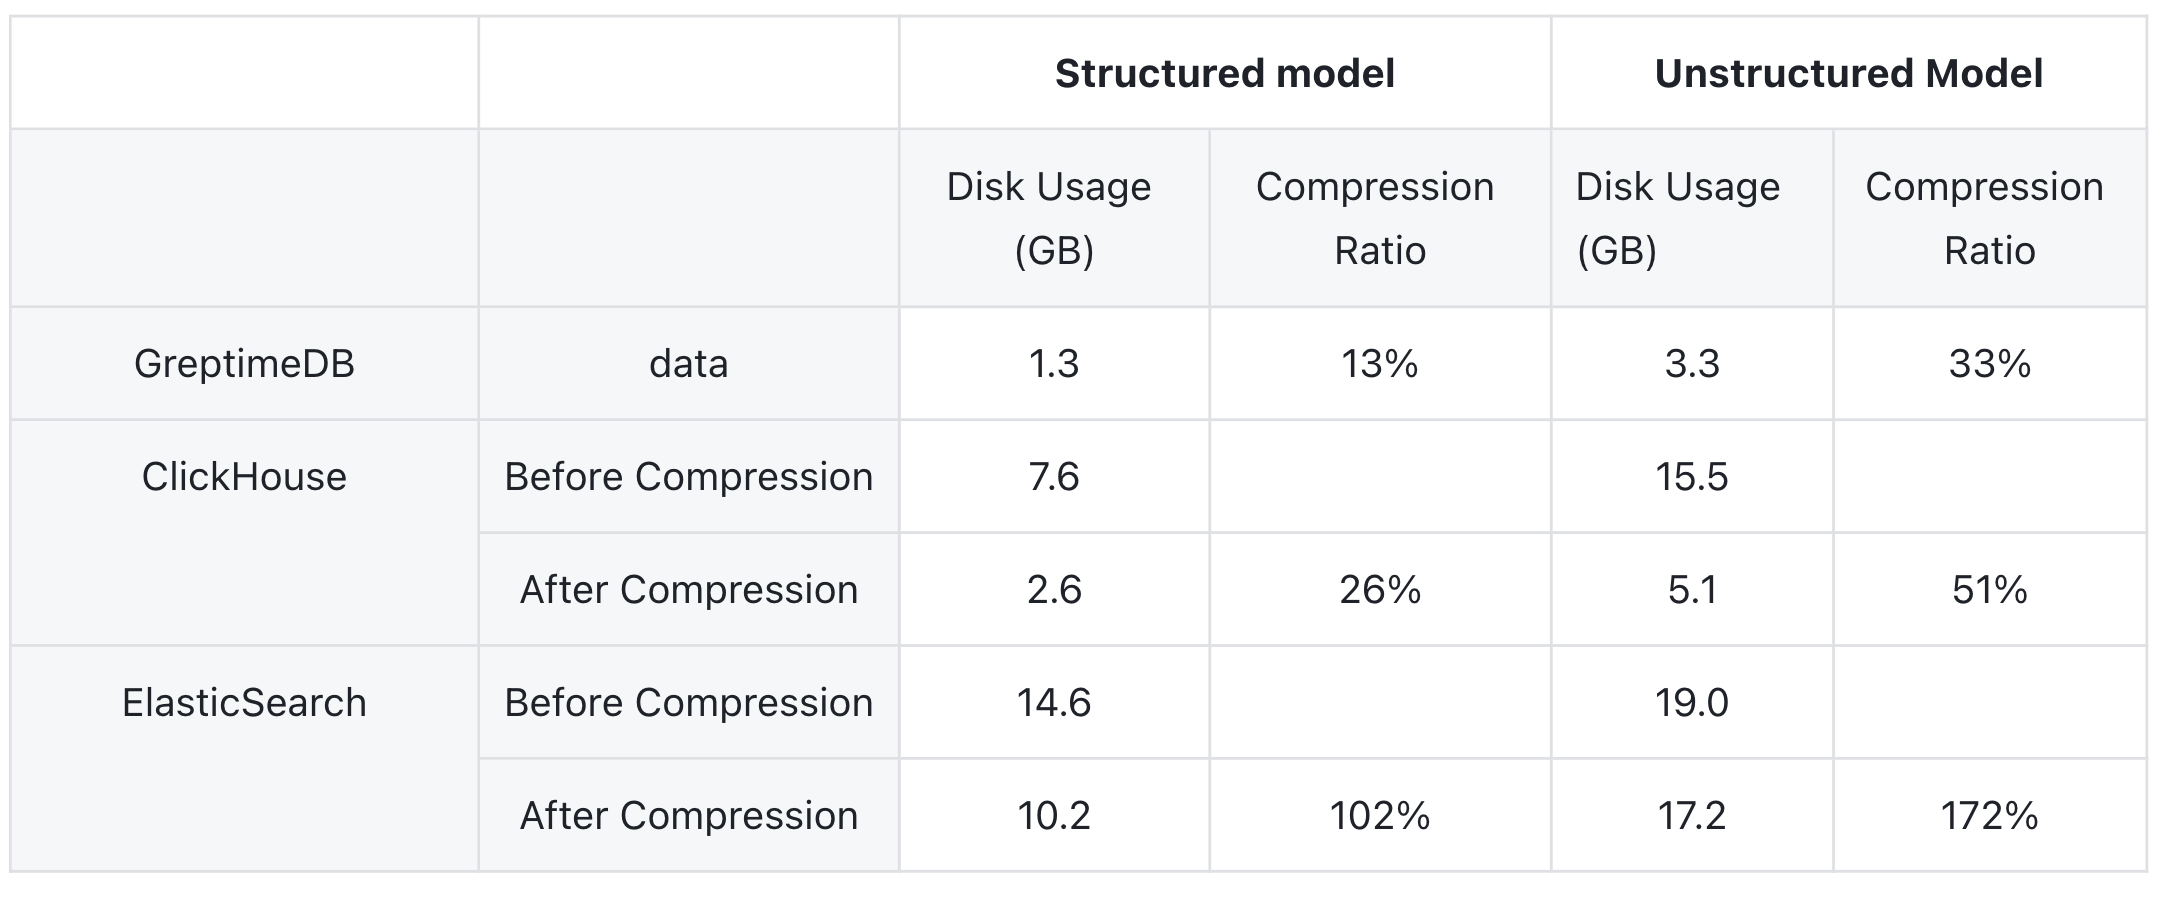
Since both ClickHouse and Elasticsearch continue compressing data after the writing process is completed, we recorded the data size both immediately after writing completion and after the data size stabilized.
The key observations are:
In both mode, GreptimeDB has the best compression ratio, reducing the data to 13% of the original size in structured model and to 33% in unstructured model. ClickHouse comes next, also reducing the data size significantly, while Elasticsearch performs the worst. Due to the overhead of index construction, the overall data size for ES is larger than that of the original.
The compression ratios in structured model are better than in unstructured model. In structured model, more columns are extracted, and since GreptimeDB uses a columnar storage structure, its compression ratio is superior.
Query Performance
Query Scenarios
We categorized the query scenarios into six types, covering typical log usage cases:
- Count Query: Count the number of rows in the entire table.
- Keyword Match Query: Match specific values for
user,method,endpoint,version, andcodein the logs. - Range Query: Query for a time range covering approximately half of the data (50 million rows).
- Middle Time Range Query: Query for one minute in the middle of the time range, retrieving 1,000 rows of data.
- Recent Time Range Query: Query for the most recent one minute of time range, retrieving 1,000 rows of data.
- Keyword Match + Range Query: Query for matching fields within a specific time range.
GreptimeDB and ClickHouse both use SQL for querying, with the former using the MySQL client tool and the latter using ClickHouse’s own command-line client. For Elasticsearch, we used the REST API for search.
Query Performance in Structured Model
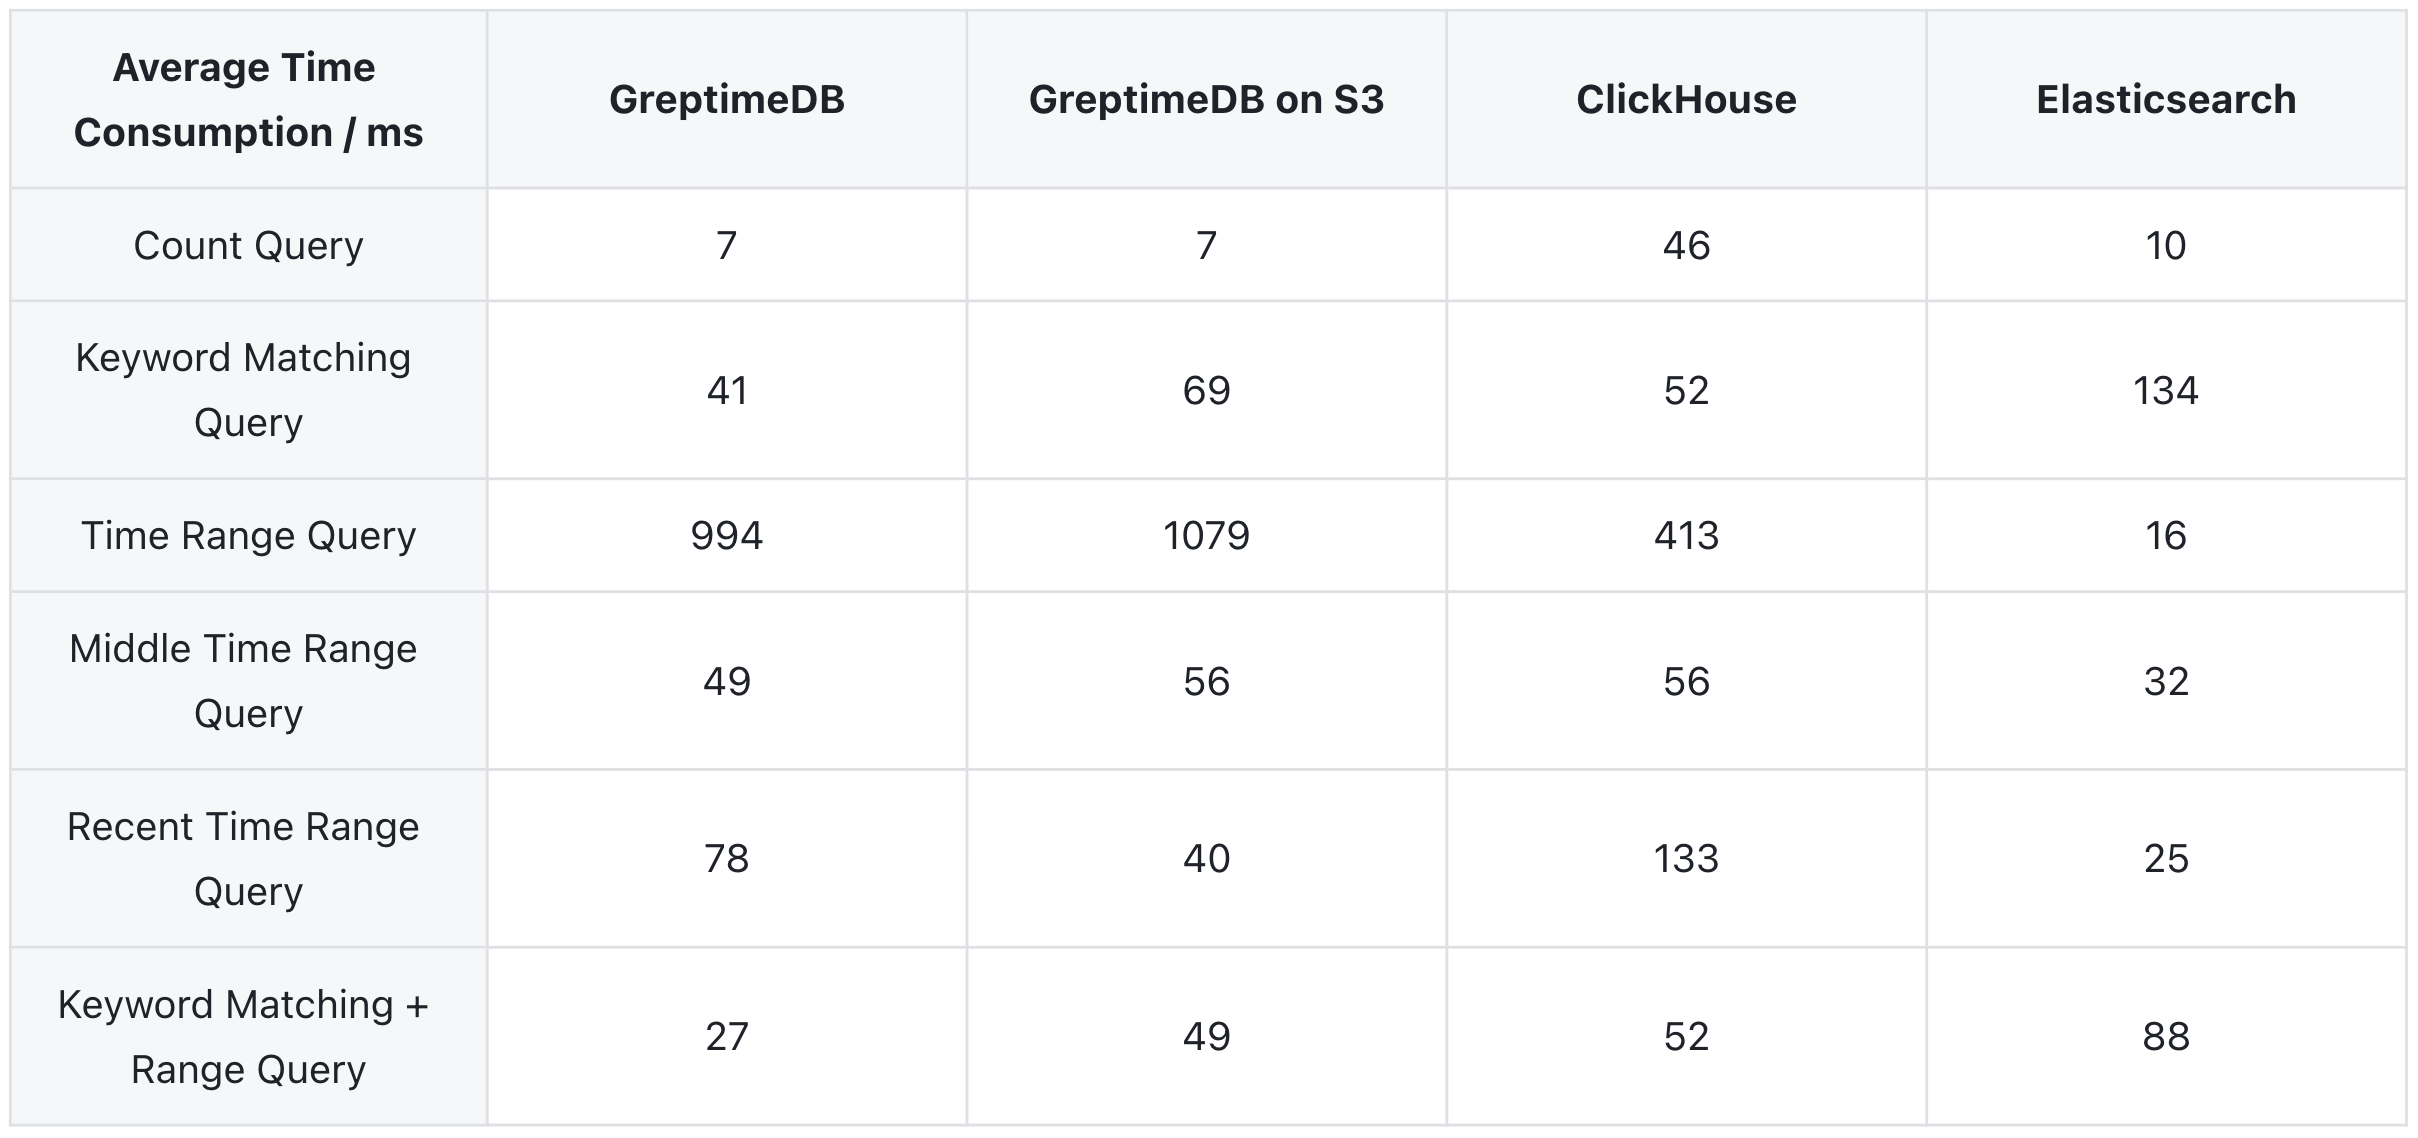
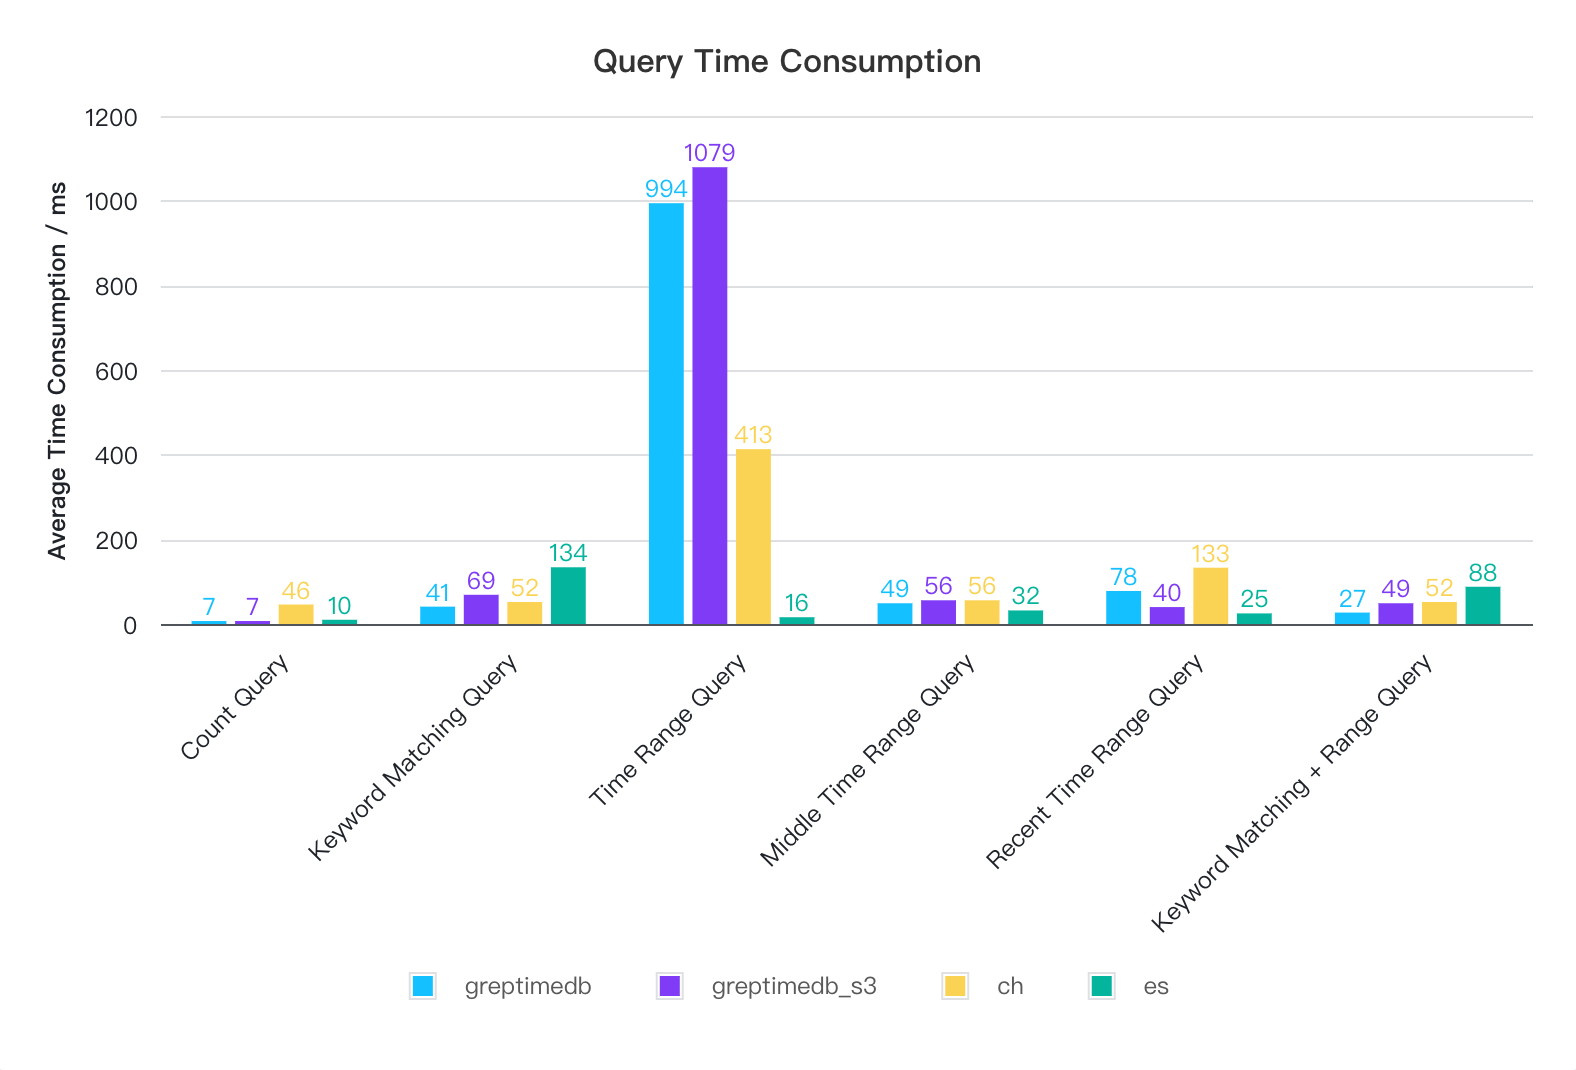
In structurerd mode, the query performance of all three systems is quite close, with most queries being completed within 1 second. For time range queries, both GreptimeDB and ClickHouse require full table scans, resulting in slower performance compared to Elasticsearch. We are currently optimizing this issue. The query performance of GreptimeDB is nearly identical in both local disk and S3 modes.
Query Performance in Unstructured Model
GreptimeDB's default full-text index configuration is relatively conservative, designed to maintain stable online ingest/query performance without fully utilizing memory and CPU resources. In contrast, ClickHouse and Elasticsearch fully leverage memory and indexing capabilities. Therefore, we also provide an optimized configuration in this mode for better performance.
In the optimized result, the following two configurations were adjusted in GreptimeDB:
page_cache_size = "10GB": Increased the page cache size for SST to 10GB.scan_parallelism = 8: Increased the scan parallelism for SST, which is by default one-fourth of the CPU cores, to 8 in order to utilize all CPU cores.
We also provide query results under the default configuration.

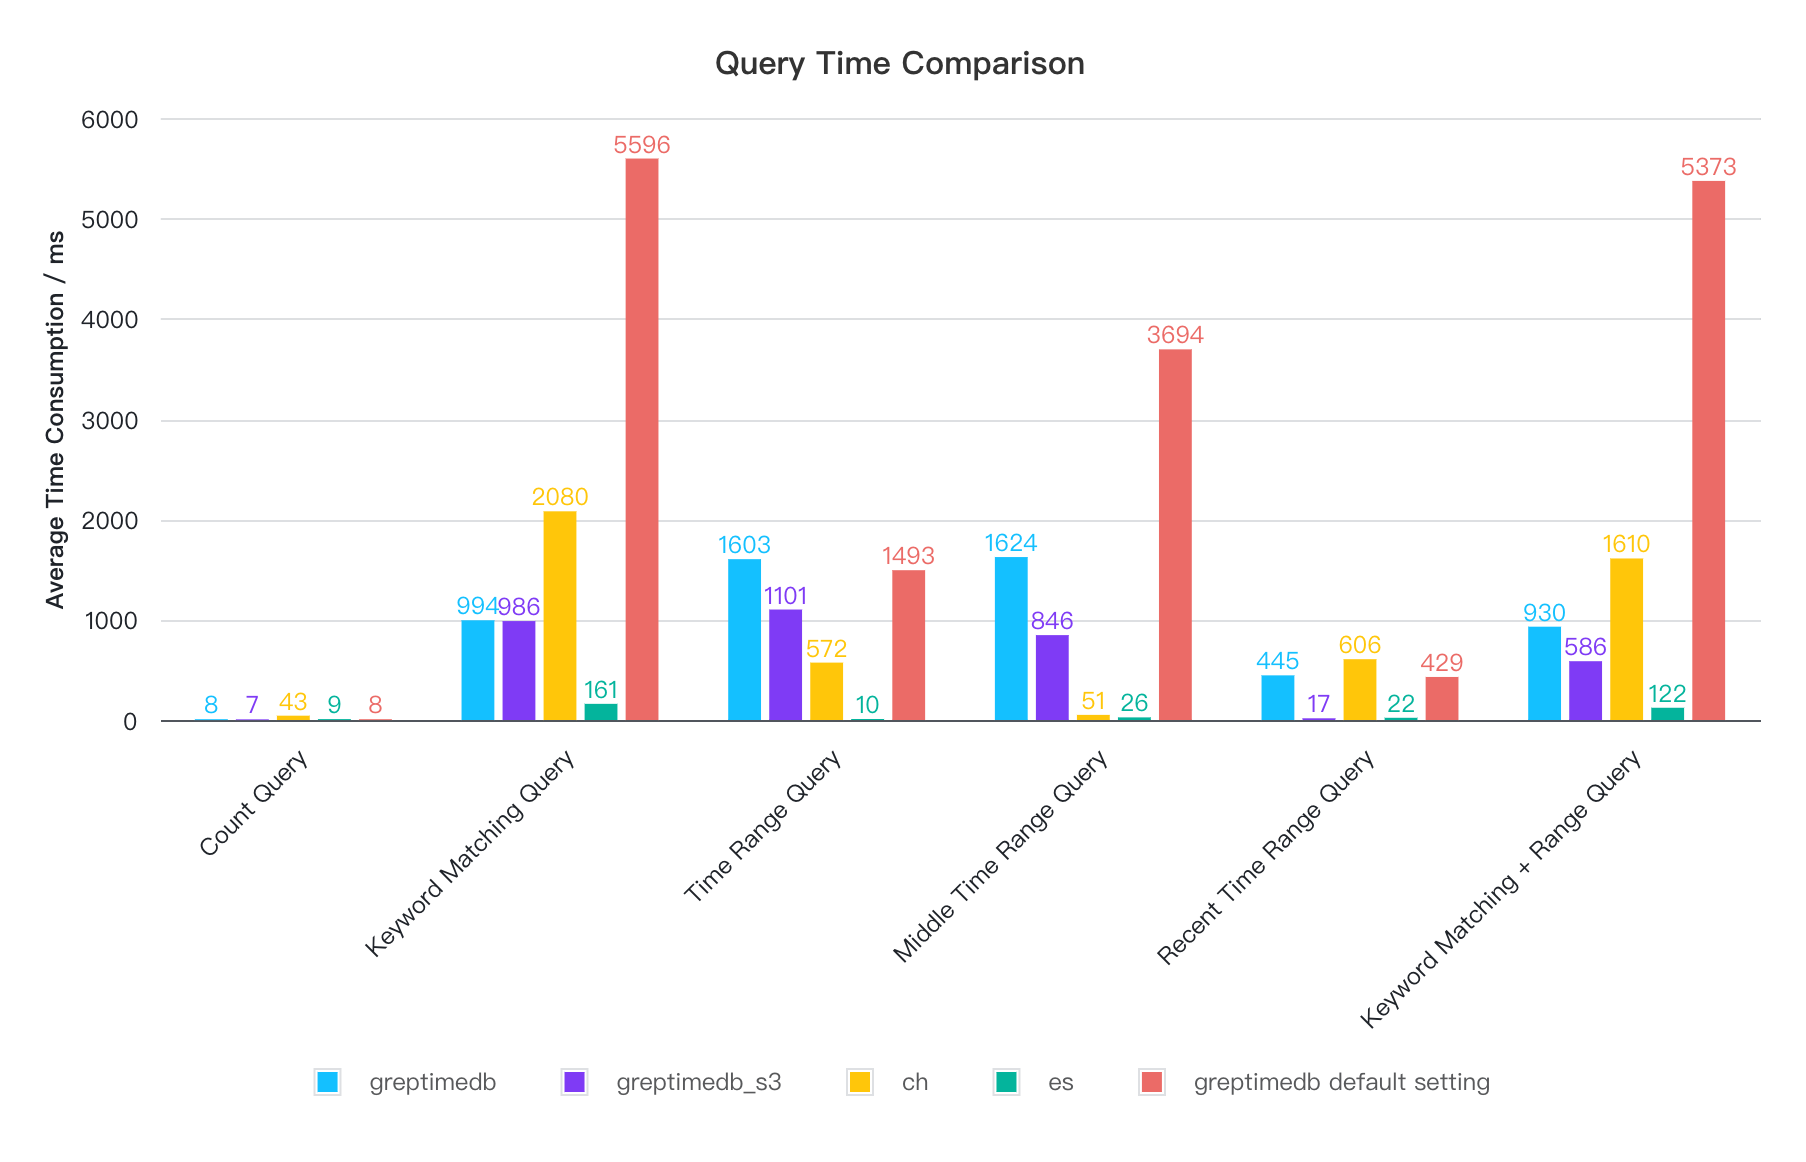
In the default configuration, GreptimeDB's query performance is the weakest for all queries except the most recent time range query. However, after modifying the default settings, all queries can be completed within 1.6 seconds, with some even outperforming ClickHouse—for instance, the most commonly used keyword matching + time range query. Elasticsearch offers the best query performance, benefiting from its larger memory usage and optimized indexing implementation, while ClickHouse provides a more balanced performance.
GreptimeDB is actively enhancing its query performance. We anticipate that its default configuration will soon match ClickHouse's performance levels. Stay tuned for these exciting developments.
Summary
GreptimeDB's log engine excels in ingestion performance, resource usage, and compression ratio. CH is relatively balanced, while ES performs the worst in these aspects and has high resource consumption.
In terms of query performance, GreptimeDB is comparable to CH and ES in structured model. In unstructured model, GreptimeDB's performance is on average, but after optimization, most queries can be completed within 1.6 seconds. ES has the best query performance, and CH is more balanced on data ingestion and query.
GreptimeDB performs consistently in both local disk and S3 object storage modes.
The structured model enhances ingest/query performance and compression ratio. Both GreptimeDB and ES feature Ingestion Pipeline capabilities, allowing unstructured text to be converted into structured data.
These results are closely tied to the scenarios each of these systems is designed for:
- GreptimeDB is designed for online observability applications, such as intelligent operations and monitoring scenarios, particularly for handling massive data sets, such as those found in connected vehicle systems or large-scale monitoring networks. It also offers the capability to store data directly in object storage. Given the need for continuous availability in online monitoring, GreptimeDB employs resources judiciously, aiming to deliver stable 24/7 ingest/query services while ensuring excellent horizontal scalability.
- ClickHouse is designed for offline data warehousing services, where ad hoc queries and long-term data analysis are common. In these scenarios, sensitivity to query time and failure rates is lower, allowing ClickHouse to fully leverage resources like CPU and memory.
- Elasticsearch is designed for both online and offline search applications, featuring excellent indexing capabilities and comprehensive search functionality (built on the robust Apache Lucene project). It aggressively utilizes resources, especially memory and disk space, which leads to the highest resource consumption and subpar ingestion performance.
In summary, for large-scale log scenarios, GreptimeDB is the most cost-effective choice. It leverages cloud-native architecture, allowing for large-scale log storage with lower resource consumption (CPU, memory, and disk) and excellent horizontal scalability. However, as this is the first version with log engine ability, we're still working on the optimization of query performance. ClickHouse is also a strong option, though its reliance on traditional distributed architecture limits its ability to fully leverage cloud infrastructure, particularly in terms of elasticity and cost-efficient object storage. Elasticsearch, on the other hand, is more suited for online search services, where latency and result recall ranking are more critical. It is not ideal for log scenarios, as it has the highest resource consumption and the worst ingestion performance. Additionally, managing and deploying distributed clusters for both CH and ES can be quite complex.
GreptimeDB's log engine is still in its first version, and we will continue to optimize it. You can find detailed configuration and steps to reproduce the test here. Stay tuned and feedback welcomed!
About Greptime
Greptime offers industry-leading time series database products and solutions to empower IoT and Observability scenarios, enabling enterprises to uncover valuable insights from their data with less time, complexity, and cost.
GreptimeDB is an open-source, high-performance time-series database offering unified storage and analysis for metrics, logs, and events. Try it out instantly with GreptimeCloud, a fully-managed DBaaS solution—no deployment needed!
The Edge-Cloud Integrated Solution combines multimodal edge databases with cloud-based GreptimeDB to optimize IoT edge scenarios, cutting costs while boosting data performance.
Star us on GitHub or join GreptimeDB Community on Slack to get connected.


