What is Vector
In modern application architectures, data collection, processing, and transmission play a vital role in maintaining system efficiency. With the explosive growth in data volumes, scalable, efficient, and flexible solutions have become increasingly important.
Vector is an open-source, high-performance data collection and transmission tool designed to deliver exceptional performance and reliability in production environments. This article explores how to use Vector in production to build efficient data pipelines.
Deployment Models
Distributed Topology
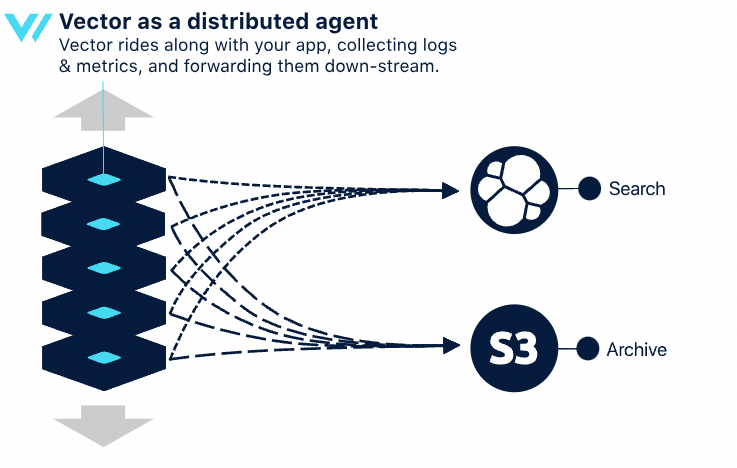
In a distributed topology, a Vector agent is deployed on each client node, directly communicating between the client and downstream services. Each client node acts as a data collection and forwarding point, processing local data sources (e.g., application logs or system metrics). This design minimizes intermediate layers, simplifying direct data transmission to the target system.
Advantages
Simplicity: Easy to implement and understand.
Elasticity: Scales resources with application growth.
Disadvantages
Lower efficiency: Complex pipelines may consume more resources, affecting other applications.
Limited durability: Cached data may be lost in the event of an unrecoverable crash.
Downstream pressure: Increases load on downstream services due to smaller, frequent requests.
Lack of cross-host context: Cannot perform cross-host operations.
Centralized Topology
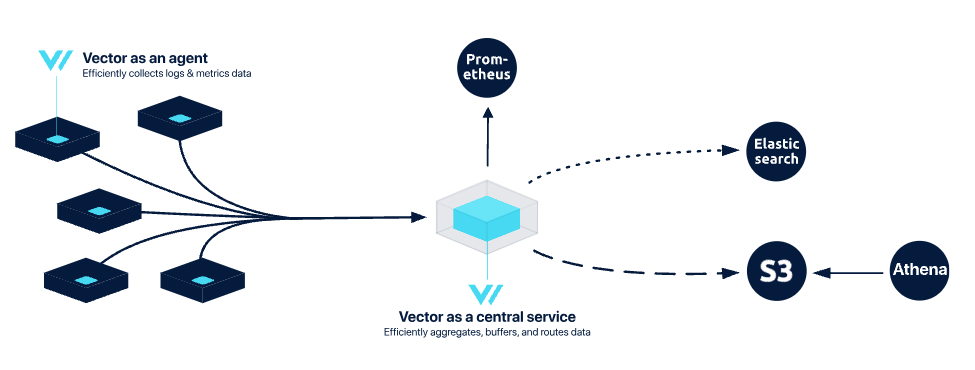
This topology balances simplicity, stability, and control. Data is collected by Vector agents on client nodes and then sent to centralized Vector aggregators for processing. This architecture improves overall efficiency and reliability through centralized data management.
Advantages
Higher efficiency: Aggregators buffer data, optimize requests, and reduce load on client nodes and downstream services.
Improved reliability: Smooth buffering and flush strategies protect downstream services from traffic spikes.
Cross-host context: Enables operations across hosts, suitable for large-scale deployments.
Disadvantages
Increased complexity: Requires managing both Vector agents and aggregators.
Durability limitations: Centralized failures can result in buffered data loss.
Stream-Based Topology
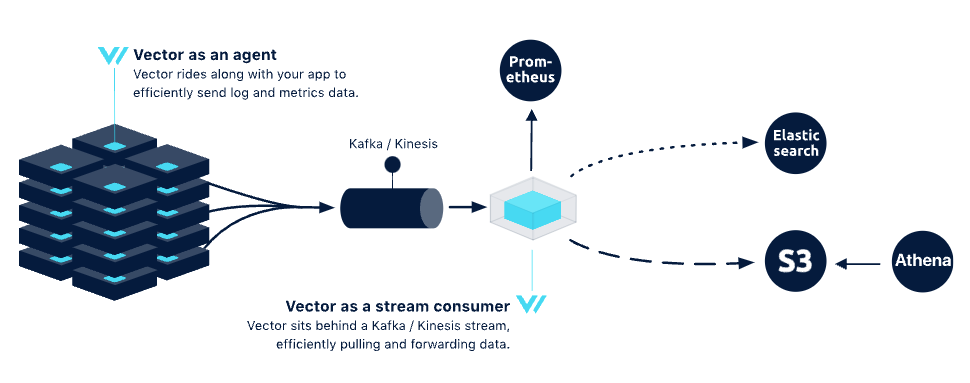
Designed for environments demanding high durability and resilience, this topology is ideal for large-scale data streams. Vector agents collect data and forward it to streaming systems like Kafka. Configuration files specify data sources, stream parameters, and downstream connections. Kafka then distributes the data to consumers.
Advantages
Durability and reliability: Streaming services (e.g., Kafka) are built for high durability, replicating data across nodes.
Efficiency: Agents focus on routing without handling durability.
Replay capabilities: Data can be replayed based on stream retention periods.
Disadvantages
Operational overhead: Requires experienced teams to manage streaming systems.
Higher complexity: Demands in-depth knowledge of production-grade stream management.
Increased costs: Resources and management of streaming clusters can raise operational expenses.
Vector API Modules
The API module in Vector provides the capability to interact with external systems, supporting a variety of operations and monitoring tasks. These APIs allow users to easily manage Vector instances, retrieve system status information, and perform data queries and configuration management.
Health Check API
To ensure the instance is available, enable the API and probes in Vector to monitor its health status. You can enable the API using the following configuration:
role: "Agent"

tolerations:
  - operator: Exists

livenessProbe:
  httpGet:
    path: /health
    port: api

readinessProbe:
  httpGet:
    path: /health
    port: api

customConfig:
  data_dir: /vector-data-dir
  api:
    enabled: true
    address: 0.0.0.0:8686
    playground: true

  sources:
    kubernetes_logs:
      type: kubernetes_logs

  sinks:
    stdout:
      type: console
      inputs:
        - kubernetes_logs
      encoding:
        codec: json
To check Vector’s health status, use:
curl 127.0.0.1:8686/health
{"ok":true}
GraphQL API
The GraphQL API provides flexible data querying and operational control via GraphQL endpoints.
Note: The GraphQL endpoint is only enabled when the Playground endpoint is activated.
- Retrieve current Vector configuration:
curl -X POST http://127.0.0.1:8686/graphql \
-H "Content-Type: application/json" \
-d '{"query": "query { sources { edges { node { componentId componentType } } } sinks { edges { node { componentId componentType } } } }"}'

{"data":{"sources":{"edges":[{"node":{"componentId":"kubernetes_logs","componentType":"kubernetes_logs"}}]},"sinks":{"edges":[{"node":{"componentId":"stdout","componentType":"console"}}]}}}- Check the Vector's version:
curl -X POST http://127.0.0.1:8686/graphql \
-H "Content-Type: application/json" \
-d '{"query": "query { meta { versionString hostname } }"}'

{"data":{"meta":{"versionString":"0.42.0 (aarch64-unknown-linux-gnu 3d16e34 2024-10-21 14:10:14.375255220)","hostname":"vector-2p6ts"}}}
Playground API
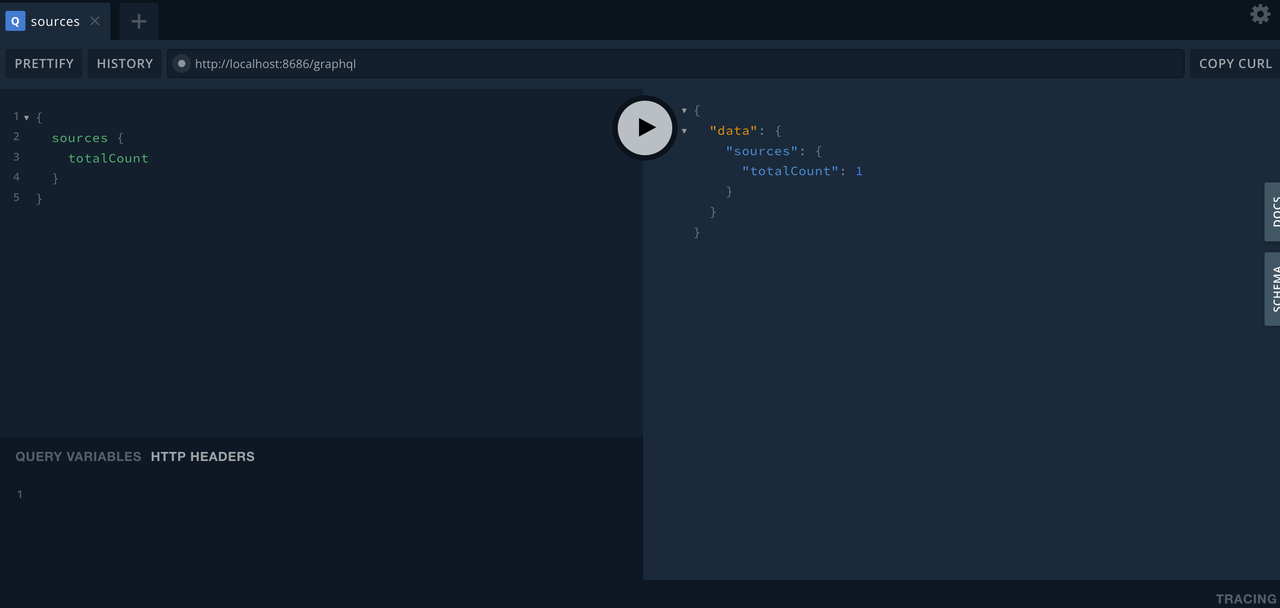
Vector’s Playground API offers an interactive UI for executing queries and retrieving information at: http://localhost:8686/playground
Vector Self-Monitoring
Metrics Collection
Vector collects and exports internal metrics using the internal_metrics source. These metrics provide insights into performance and health:
role: "Agent"

tolerations:
  - operator: Exists

service:
  ports:
    - name: prom-exporter
      port: 9598

containerPorts:
  - name: prom-exporter
    containerPort: 9598
    protocol: TCP

customConfig:
  data_dir: /vector-data-dir
  sources:
    vector_metrics:
      type: internal_metrics
      scrape_interval_secs: 10

  sinks:
    prom-exporter:
      type: prometheus_exporter
      inputs:
        - vector_metrics
address: 0.0.0.0:9598curl 127.0.0.1:9598/metrics
# HELP vector_buffer_byte_size buffer_byte_size
# TYPE vector_buffer_byte_size gauge
vector_buffer_byte_size{buffer_type="memory",component_id="prom-exporter",component_kind="sink",component_type="prometheus_exporter",host="vector-xbw7f",stage="0"} 0 1731949489084
# HELP vector_buffer_events buffer_events
# TYPE vector_buffer_events gauge
vector_buffer_events{buffer_type="memory",component_id="prom-exporter",component_kind="sink",component_type="prometheus_exporter",host="vector-xbw7f",stage="0"} 0 1731949489084
# HELP vector_buffer_max_event_size buffer_max_event_size
# TYPE vector_buffer_max_event_size gauge
vector_buffer_max_event_size{buffer_type="memory",component_id="prom-exporter",component_kind="sink",component_type="prometheus_exporter",host="vector-xbw7f",stage="0"} 500 1731949489084
# HELP vector_buffer_received_bytes_total buffer_received_bytes_total
# TYPE vector_buffer_received_bytes_total counter
vector_buffer_received_bytes_total{buffer_type="memory",component_id="prom-exporter",component_kind="sink",component_type="prometheus_exporter",host="vector-xbw7f",stage="0"} 73519 1731949489084
...The following are references to Metrics:
| Metric | Type | Description |
|---|---|---|
| adaptive_concurrency_averaged_rtt | Histogram | Average round-trip time (RTT) for the current window. |
| adaptive_concurrency_in_flight | Histogram | Number of outbound requests awaiting a response. |
| adaptive_concurrency_limit | Histogram | Concurrency limit determined by the adaptive concurrency feature for the window. |
| adaptive_concurrency_observed_rtt | Histogram | Observed round-trip time (RTT) of requests. |
| aggregate_events_recorded_total | Counter | Total number of events recorded by the aggregation transformation. |
| aggregate_failed_updates | Counter | Number of failed metric updates and additions during aggregation. |
| aggregate_flushes_total | Counter | Total number of completed flushes for aggregation transformations. |
| api_started_total | Counter | Total number of times the Vector GraphQL API was started. |
| buffer_byte_size | Gauge | Current number of bytes in the buffer. |
| buffer_discarded_events_total | Counter | Total number of events discarded by the non-blocking buffer. |
| buffer_events | Gauge | Total number of events currently in the buffer. |
| buffer_received_event_bytes_total | Counter | Total number of bytes received by the buffer. |
| buffer_received_events_total | Counter | Total number of events received by the buffer. |
| buffer_send_duration_seconds | Histogram | Time taken to send payloads to the buffer. |
| buffer_sent_event_bytes_total | Counter | Total number of bytes sent from the buffer. |
| buffer_sent_events_total | Counter | Total number of events sent from the buffer. |
| build_info | Gauge | Build version information. |
| checkpoints_total | Counter | Total number of checkpoint files. |
| checksum_errors_total | Counter | Total number of errors identified via checksum. |
| collect_completed_total | Counter | Total number of completed metric collections for the component. |
| collect_duration_seconds | Histogram | Time spent collecting metrics for the component. |
| command_executed_total | Counter | Total number of commands executed. |
| command_execution_duration_seconds | Histogram | Duration of command executions in seconds. |
| component_discarded_events_total | Counter | Total number of events discarded by the component. |
| component_errors_total | Counter | Total number of errors encountered by the component. |
| component_received_bytes | Histogram | Byte size of each event received by the source. |
| component_received_bytes_total | Counter | Total raw bytes received by the component from the source. |
| component_received_event_bytes_total | Counter | Total event bytes received by the component from marked sources (e.g., files, URIs). |
| component_received_events_count | Histogram | Histogram of events passed in each internal batch within Vector's topology. |
| component_received_events_total | Counter | Total number of events received by the component from marked sources or others. |
| component_sent_bytes_total | Counter | Total raw bytes sent to the target receiver by the component. |
| component_sent_event_bytes_total | Counter | Total event bytes sent by the component to the target. |
| component_sent_events_total | Counter | Total number of events sent by the component to the target. |
| connection_established_total | Counter | Total number of established connections. |
| connection_read_errors_total | Counter | Total number of read errors encountered while processing data packets. |
| connection_send_errors_total | Counter | Total number of send errors encountered while transmitting data. |
| connection_shutdown_total | Counter | Total number of connection shutdowns. |
| container_processed_events_total | Counter | Total number of container events processed. |
| containers_unwatched_total | Counter | Total number of times Vector stopped monitoring container logs. |
| containers_watched_total | Counter | Total number of times Vector started monitoring container logs. |
| events_discarded_total | Counter | Total number of events discarded by the component. |
| files_added_total | Counter | Total number of files being monitored by Vector. |
| files_deleted_total | Counter | Total number of files deleted from monitoring. |
| files_resumed_total | Counter | Total number of times files resumed monitoring. |
| files_unwatched_total | Counter | Total number of times files stopped being monitored. |
| grpc_server_handler_duration_seconds | Histogram | Time taken to handle gRPC requests. |
| grpc_server_messages_received_total | Counter | Total number of gRPC messages received. |
| grpc_server_messages_sent_total | Counter | Total number of gRPC messages sent. |
| http_client_requests_sent_total | Counter | Total number of HTTP requests sent, labeled by request method. |
| http_client_response_rtt_seconds | Histogram | Round-trip time (RTT) for HTTP requests. |
| http_client_responses_total | Counter | Total number of HTTP client responses. |
| http_client_rtt_seconds | Histogram | Round-trip time (RTT) for HTTP requests. |
| http_requests_total | Counter | Total number of HTTP requests made by the component. |
| http_server_handler_duration_seconds | Histogram | Time taken to process HTTP requests. |
| http_server_requests_received_total | Counter | Total number of HTTP requests received by the server. |
| http_server_responses_sent_total | Counter | Total number of HTTP responses sent by the server. |
| internal_metrics_cardinality | Gauge | Total number of metrics emitted from the internal metrics registry. |
| invalid_record_total | Counter | Total number of invalid records discarded. |
(Chart 1: Metrics Reference)
Logs
Vector's internal_logs collects and processes the internal logs generated by Vector itself, which helps us understand Vector's operational status and diagnose any issues.
role: "Agent"
tolerations:
  - operator: Exists
service:
  ports:
    - name: prom-exporter
      port: 9598
containerPorts:
  - name: prom-exporter
    containerPort: 9598
    protocol: TCP
customConfig:
  data_dir: /vector-data-dir
  sources:
    vector_logs:
      type: internal_logs
  sinks:
    stdout:
      type: console
      inputs:
        - vector_logs
      encoding:
        codec: json
Alerts
By exposing Vector's internal_metrics, we can retrieve metrics from Vector and create Prometheus rules for alerting.
Interruptions
If data sending is interrupted for more than one minute, an alert is triggered:
apiVersion: monitoring.coreos.com/v1
kind: PrometheusRule
metadata:
  name: vector-sink-down
spec:
  groups:
    - name: vector
      rules:
        - alert: "VectorSinkDown"
          annotations:
            summary: "Vector sink down"
            description: "Vector sink down, sinks: {{ $labels.component_id }}"
          expr: |
            rate(vector_buffer_sent_events_total{component_type="${SINK_NAME}"}[30s]) == 0
          for: 1m
          labels:
            severity: critical
Latency
If the 95th percentile latency exceeds 0.5 seconds for more than one minute, an alert is triggered:
apiVersion: monitoring.coreos.com/v1
kind: PrometheusRule
metadata:
  name: vector-high-latency
spec:
  groups:
    - name: vector
      rules:
        - alert: "VectorHighLatency"
          annotations:
            summary: "High latency in Vector"
            description: "The 95th percentile latency for HTTP client responses is above 0.5 seconds."
          expr: |
            histogram_quantile(0.95, rate(vector_http_client_response_rtt_seconds_bucket[5m])) > 0.5
          for: 1m
          labels:
            severity: warning
Error Rate
If the error rate for HTTP requests (status 5xx) exceeds 5% for more than two minutes, an alert is triggered:
apiVersion: monitoring.coreos.com/v1
kind: PrometheusRule
metadata:
  name: vector-high-error
spec:
  groups:
    - name: vector
      rules:
        - alert: "VectorHighERROR"
          annotations:
            summary: "High error rate in Vector"
            description: "The error rate for HTTP client responses exceeds 5% over the last 5 minutes."
          expr: |
            rate(vector_http_client_responses_total{status=~"5.*"}[5m]) / rate(vector_http_client_responses_total[5m]) > 0.05
          for: 2m
          labels:
            severity: warning
Vector Debugging
Log Level
The default log level in Vector is info, but it supports the following levels:
tracedebuginfowarnerror
To facilitate debugging or capture more detailed information, you can change the log level to debug and set the log format to json for easier processing and viewing. Here’s how to configure it:
role: "Agent"

tolerations:
  - operator: Exists

logLevel: "debug"

env:
  - name: VECTOR_LOG_FORMAT
    value: "json"
VRL Syntax
Vector Remap Language (VRL) is the language used in Vector for data transformation and processing. Its goal is to simplify the handling of data flows, allowing for more flexible and intuitive manipulation of data pipelines.
VRL provides powerful data manipulation capabilities, including field transformations, conditional logic, loops, data mapping, and more. It is widely used in various scenarios such as log processing, metrics aggregation, and event filtering.
To verify the correctness of VRL syntax, you can visit the following link to test and validate your code: VRL Playground

Vector: a robust tool for varied data processing needs
Vector provides versatile deployment models and powerful APIs for efficient and reliable data pipelines in modern production environments. Its flexibility across distributed, centralized, and streaming topologies makes it a robust tool for varied data processing needs.
About Greptime
Greptime offers industry-leading time series database products and solutions to empower IoT and Observability scenarios, enabling enterprises to uncover valuable insights from their data with less time, complexity, and cost.
GreptimeDB is an open-source, high-performance time-series database offering unified storage and analysis for metrics, logs, and events. Try it out instantly with GreptimeCloud, a fully-managed DBaaS solution—no deployment needed!
The Edge-Cloud Integrated Solution combines multimodal edge databases with cloud-based GreptimeDB to optimize IoT edge scenarios, cutting costs while boosting data performance.
Star us on GitHub or join GreptimeDB Community on Slack to get connected.


