OpenTelemetry (OTel) is an open-source standard designed specifically for monitoring the health of applications. By collecting metrics, logs, and traces, it provides a comprehensive view of the system, helping operations teams quickly identify and resolve issues.
In our previous blog What is OpenTelemetry — Metrics, Logs, and Traces for Application Health Monitoring we introduced the different components of OTel and how they work together.
In this article, we’ll focus on logs, one of the three pillars of observability. Logs are essential for understanding events within a system, providing detailed, time-stamped records of operations. However, the unstructured nature of logs can make it challenging to extract meaningful insights. That’s where OpenTelemetry’s standardized Log Data Model steps in, offering a structured framework to make logs easier to capture, query, and analyze.
Let’s dive into how OpenTelemetry transforms raw log data into actionable insights and the tools it provides for efficient log collection and processing.
Capturing Logs in OpenTelemetry
Logs are one of the most fundamental ways developers observe events happening within their systems. Logs are fundamentally unstructured data streams which provide developers with the flexibility to emit signals about their applications as they see fit. Though the lack of structure makes it hard to create standardization across tooling to support the capturing, parsing, and saving of log files.
This is where the OpenTelemetry Log Model provides significant value. Its standardized structure offers a deeper understanding of each log's context, helping to answer questions about when, where, why, and how a log was emitted.
Log Data Model fields
| Field Name | Description |
|---|---|
| Timestamp | Time when the event occurred. |
| ObservedTimestamp | Time when the event was observed. |
| TraceId | Request trace id. |
| SpanId | Request span id. |
| TraceFlags | W3C trace flag. |
| SeverityText | The severity text (also known as log level). |
| SeverityNumber | Numerical value of the severity. |
| Body | The body of the log record. |
| Resource | Describes the source of the log. |
| InstrumentationScope | Describes the scope that emitted the log. |
| Attributes | Additional information about the event. |
Examples of log data model fields and what types of questions they answer
- Tracing Context
- The
TraceIdandSpanIdfields allow logs to be correlated with distributed traces, enabling developers to follow the path of a request across multiple services. - Example question: "What other events occurred during this specific user transaction?"
- Temporal Information
- The
TimestampandObservedTimestampfields help answer questions about when events occurred and how long they took to be processed. - Example question: "Is there a delay between when events occur and when they're observed in our system?"
- Severity and Importance
SeverityTextandSeverityNumberfields allow for easy filtering and prioritization of logs.- Example question: "How many critical errors occurred in the last hour?"
- Contextual Attributes
- The
Attributesfield allows for custom key-value pairs to be added, providing additional context. - Example question: "What was the user ID associated with this error?"
- Source Identification
- The
Resourcefield helps identify where the log came from (e.g., which service, host, or container). - Example question: "Which specific microservice is generating the most errors?"
- Instrumentation Details
- The
InstrumentationScopefield provides information about the library or module that generated the log. - Example question: "Are there any patterns in errors coming from a specific third-party library?"
- Flexible Message Content
- The
Bodyfield allows for structured or unstructured log messages, supporting both legacy logging practices and more modern structured logging approaches. - Example question: "What are the most common errors we're seeing around our widget service?"
By adhering to this model, logs become much more than just text entries. They become rich, queryable data points that can be easily correlated with other telemetry data (like traces and metrics) to provide a comprehensive view of system behavior and performance.
Converting Logs to the Log Data Model

OpenTelemetry provides two main mechanisms for converting logs to this data model.
Log SDK
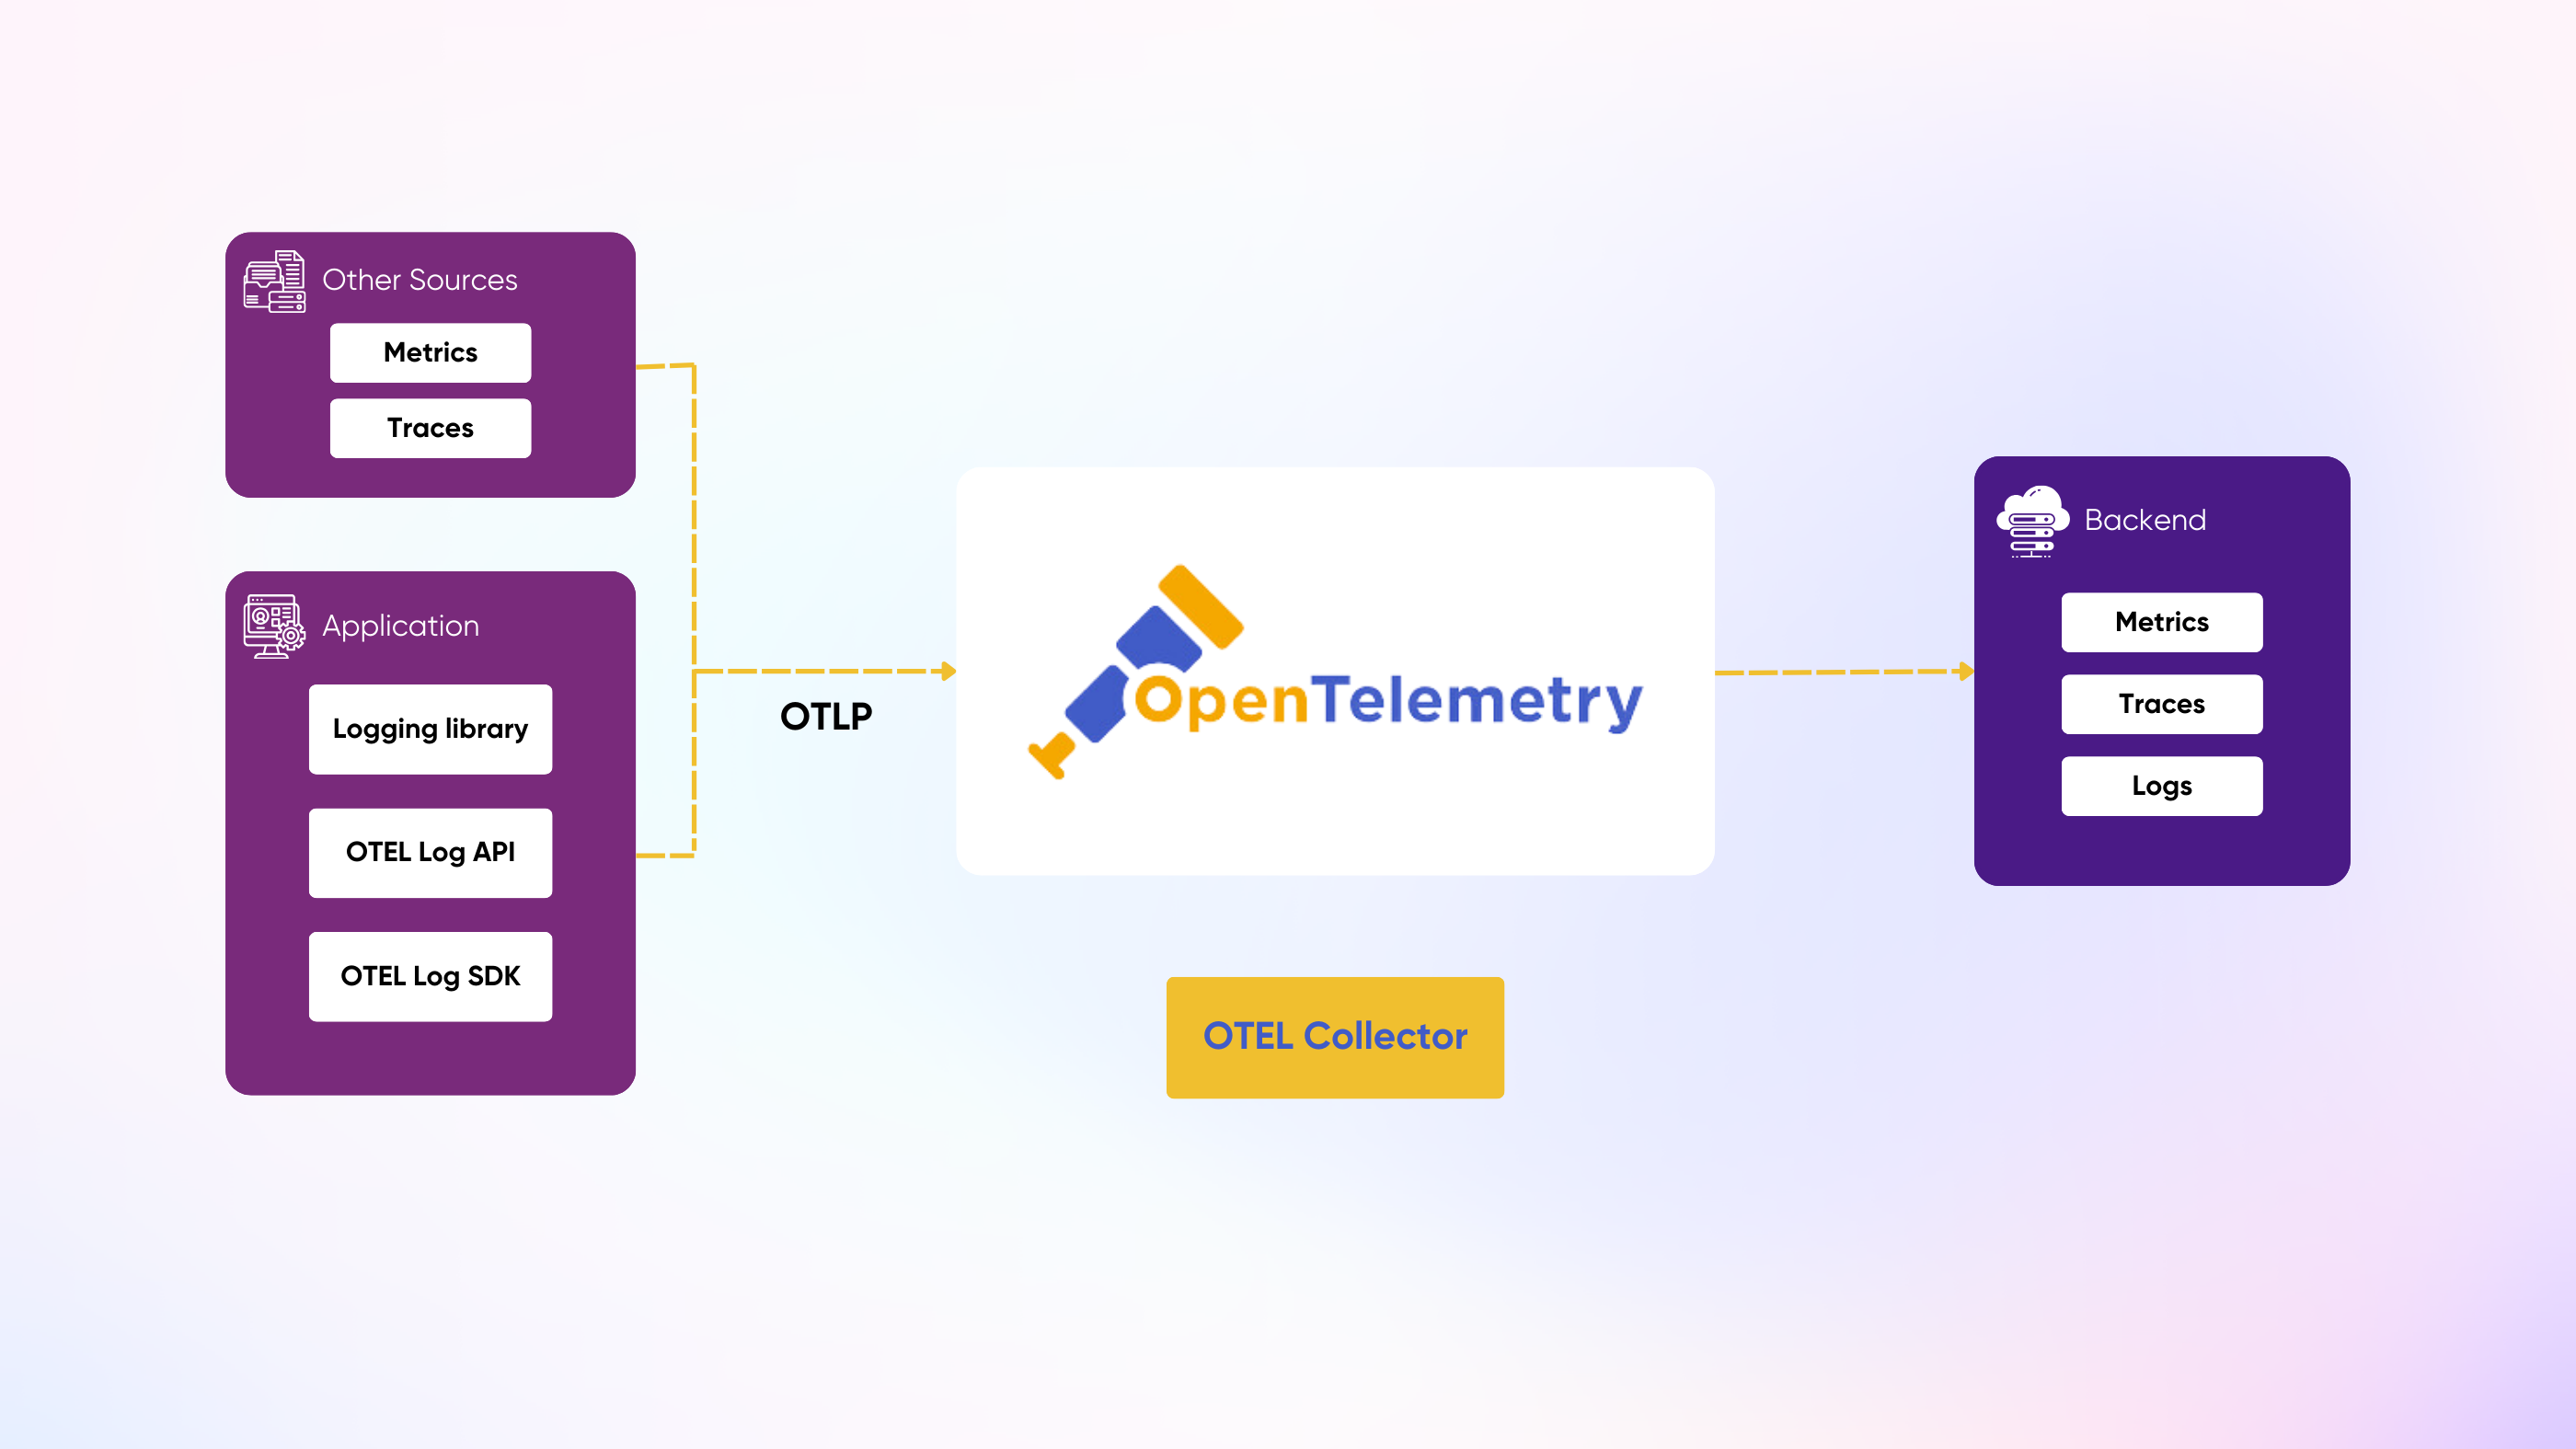
The Log SDK consists of libraries provided by OpenTelemetry which help bridge existing logging libraries to the OTLP format expected by the other downstream OpenTelemetry systems. Directly using the SDK is best for simple, straightforward implementations where developers want to save the logs into a database with minimal setup and maintenance of other components.
Setting up the Log SDK involves configuring existing language logging frameworks like Python's logging, Go's log, or Java's Log4j with an OpenTelemetry LogHandler. After configuring your standard logging library with important details like the name of the log, what kind of logs you want to capture (stdout, stderr, debug), and the destination of your logs (any OTLP compatible backend), invocations of those loggers throughout your application will be sent to the configured destination with the configured attributes.
Below is an example instrumenting a Python application with the OpenTelemetry Logging SDK.
import logging
from opentelemetry.sdk._logs import LogEmitterProvider, LoggingHandler
from opentelemetry.sdk._logs.export import BatchLogProcessor, ConsoleLogExporter, OTLPLogExporter
from opentelemetry.sdk.resources import Resource
from opentelemetry.exporter.otlp.proto.grpc._log_exporter import OTLPLogExporter
from opentelemetry.sdk._logs import set_log_emitter_provider

log_emitter_provider = LogEmitterProvider(resource=Resource.create({"service.name": "my-python-app"}))

# Set the global log emitter provider (this will bridge the Python logging with OpenTelemetry)
set_log_emitter_provider(log_emitter_provider)

# Configure the OTLP exporter (sending to OpenTelemetry-compatible backend)
otlp_exporter = OTLPLogExporter(endpoint="http://greptimedb:4000", insecure=True)

# Add a batch log processor for sending logs asynchronously
log_processor = BatchLogProcessor(otlp_exporter)
log_emitter_provider.add_log_processor(log_processor)

# Optionally, add a ConsoleLogExporter for debugging
# console_exporter = ConsoleLogExporter()
# log_emitter_provider.add_log_processor(BatchLogProcessor(console_exporter))

# Set up logging integration
handler = LoggingHandler(level=logging.INFO, log_emitter_provider=log_emitter_provider)
logging.getLogger().addHandler(handler)

# Example usage of logging with OpenTelemetry bridge
logger = logging.getLogger(__name__)
logger.setLevel(logging.INFO)

# Example log message
logger.info("This is an OpenTelemetry log message!")
Log Collector
The OpenTelemetry Collector is a powerful component that can be used to collect, process, and export logs from various sources. It's particularly useful in more complex environments or when you need additional flexibility in handling logs, though setting it up comes with extra challenges and components to maintain. Here are some key points about using the Collector for logs:
- Versatile Log Collection
The Collector can ingest logs from multiple sources, including:
- Application logs sent directly via OTLP
- Log files on disk
- System logs (e.g., syslog)
- Container logs (e.g., from Docker or Kubernetes)
- Processing Capabilities
The Collector can perform various operations on logs before forwarding them:
- Filtering: Remove unnecessary logs
- Transformation: Modify log structure or content
- Enrichment: Add metadata or attributes to logs
- Multiple Export Options
Logs can be sent to various backends, including:
- OpenTelemetry-native backends
- Popular logging systems (e.g., Elasticsearch, Splunk)
- Cloud provider services (e.g., AWS CloudWatch, Google Cloud Logging)
- Scalability and Performance
The Collector can handle high volumes of logs and provides features like batching and retry mechanisms for reliable delivery.
- Configuration Flexibility
You can easily adjust the Collector's behavior through YAML configuration files, allowing for quick changes without modifying application code.
Here's a basic example of a Collector configuration for logs:
receivers:
  otlp:
    protocols:
      grpc:
      http:

processors:
  batch:

exporters:
  logging:
    loglevel: debug
  otlp:
    endpoint: 'otel-collector:4317'
    tls:
      insecure: true

service:
  pipelines:
    logs:
      receivers: [otlp]
      processors: [batch]
      exporters: [logging, otlp]
This configuration sets up the Collector to receive logs via OTLP, batch them for efficiency, and then export them to both a logging exporter (for debugging) and another OTLP endpoint.
Using the Collector provides a centralized way to manage logs across your entire infrastructure, offering greater flexibility and control over log processing and routing compared to the Log SDK approach.
GreptimeDB as OpenTelemetry Log Collector
GreptimeDB is a cloud-native time-series database designed for real-time, efficient data storage and analysis, especially in observability scenarios. With native support for OpenTelemetry, GreptimeDB can act as a collector, allowing users to easily ingest, store, and analyze observability data. This simplifies log pipelines while providing a scalable and powerful backend for monitoring.
For more details, check out the GreptimeDB OpenTelemetry documentation.
Choosing Collector vs Exporter
These two mechanisms help developers support log capture for any usecase that is needed. The main questions to ask yourself when determining what is the best option are around the complexity of your environment.
For example:
- Will I be collecting logs from many different sources?
- Do I have several additional transformations to perform against these logs?
- Am I willing to invest the development effort to manage this additional component?
If you need to collect from several sources and desire to perform many complex operations, it will be best to invest upfront in setting up a log collection agent like fluent bit or Grafana alloy. Otherwise, if you just want to simply collect logs from a few sources with lower overhead and complexity, try out the logging sdk.
If you need help setting up your Logging pipeline with OpenTelemetry, reach out to our team to discuss how you can get started with collecting your logs and building a more resilient deployment.
About Greptime
Greptime offers industry-leading time series database products and solutions to empower IoT and Observability scenarios, enabling enterprises to uncover valuable insights from their data with less time, complexity, and cost.
GreptimeDB is an open-source, high-performance time-series database offering unified storage and analysis for metrics, logs, and events. Try it out instantly with GreptimeCloud, a fully-managed DBaaS solution—no deployment needed!
The Edge-Cloud Integrated Solution combines multimodal edge databases with cloud-based GreptimeDB to optimize IoT edge scenarios, cutting costs while boosting data performance.
Star us on GitHub or join GreptimeDB Community on Slack to get connected.


