On this page
GreptimeDB has committed to transforming event management by developing a unified metrics and events database, enhancing real-time processing, correlation analysis, and reducing maintenance costs for a more efficient monitoring experience.
Since GreptimeDB v0.9, a log pipeline was introduced for log search capabilities, and improved views and flows.
In this article, I'll show you how to analyze unified metrics and logs using an example of monitoring an RPC service in a microservice architecture.
To follow along with the demo, ensure you have GreptimeDB installed or access it online through GreptimeCloud.
You can run the SQL in the example by MySQL Command-Line Client or the embedded dashboard in GreptimeDB.
Now, I'll start start demonstration.
Step 1: Create Request Metrics Table
Here's a table for request metrics:
sql
create table app_metrics (
    ts timestamp time index,
    dc string,
    host string,
    latency double,
    primary key (dc, host)
);tsis the metric timestamp when collected.dcis the datacenter name.hostis the application server hostname.latencyis the RPC request latency.
dc and host serve as the primary key and tag semantic types.
Step 2: Create Application Logs Table
The next table is the application logs:
sql
create table app_logs (
    ts timestamp time index,
    host string,
    dc string,
    `path` string,
    `error` string FULLTEXT,
    primary key (dc, host)
);
The columns are very straightforward:
ts: the log timestamphost: the application server hostname, just likeapp_metrics.hostpath: the RPC request URL patherror: the log error message, which enables theFULLTEXToption for log searching
The primary key is the same as the app_metrics table.
Step 3: Insert Mock Data
Next, let's insert some mock data to simulate collected metrics and error logs:
sql
INSERT INTO app_metrics (ts, dc, host, latency) VALUES
('2024-07-11 20:00:00', 'dc1', 'host1', 100.0),
('2024-07-11 20:00:01', 'dc1', 'host1', 100.5),
('2024-07-11 20:00:02', 'dc1', 'host1', 101.0),
('2024-07-11 20:00:03', 'dc1', 'host1', 101.5),
('2024-07-11 20:00:04', 'dc1', 'host1', 102.0),
('2024-07-11 20:00:05', 'dc1', 'host1', 102.5),
('2024-07-11 20:00:06', 'dc1', 'host1', 103.0),
('2024-07-11 20:00:07', 'dc1', 'host1', 103.5),
('2024-07-11 20:00:08', 'dc1', 'host1', 104.0),
('2024-07-11 20:00:09', 'dc1', 'host1', 104.5),
--- The requested latency is starting to become unstable
--- and noticeably higher.
('2024-07-11 20:00:10', 'dc1', 'host1', 150.0),
('2024-07-11 20:00:11', 'dc1', 'host1', 200.0),
('2024-07-11 20:00:12', 'dc1', 'host1', 1000.0),
('2024-07-11 20:00:13', 'dc1', 'host1', 80.0),
('2024-07-11 20:00:14', 'dc1', 'host1', 4200.0),
('2024-07-11 20:00:15', 'dc1', 'host1', 90.0),
('2024-07-11 20:00:16', 'dc1', 'host1', 3000.0),
('2024-07-11 20:00:17', 'dc1', 'host1', 320.0),
('2024-07-11 20:00:18', 'dc1', 'host1', 3500.0),
('2024-07-11 20:00:19', 'dc1', 'host1', 100.0),
('2024-07-11 20:00:20', 'dc1', 'host1', 2500.0),
('2024-07-11 20:00:21', 'dc1', 'host1', 1100.0),
('2024-07-11 20:00:22', 'dc1', 'host1', 2950.0),
('2024-07-11 20:00:23', 'dc1', 'host1', 75.0),
('2024-07-11 20:00:24', 'dc1', 'host1', 1550.0),
('2024-07-11 20:00:25', 'dc1', 'host1', 2800.0);
--- Error logs are starting to appear.
INSERT INTO app_logs (ts, dc, host, path, error) VALUES
('2024-07-11 20:00:10', 'dc1', 'host1', '/api/v1/resource', 'Error: Connection timeout'),
('2024-07-11 20:00:11', 'dc1', 'host1', '/api/v1/resource', 'Error: Database unavailable'),
('2024-07-11 20:00:12', 'dc1', 'host1', '/api/v1/resource', 'Error: Service overload'),
('2024-07-11 20:00:13', 'dc1', 'host1', '/api/v1/resource', 'Error: Connection reset'),
('2024-07-11 20:00:14', 'dc1', 'host1', '/api/v1/resource', 'Error: Timeout'),
('2024-07-11 20:00:15', 'dc1', 'host1', '/api/v1/resource', 'Error: Disk full'),
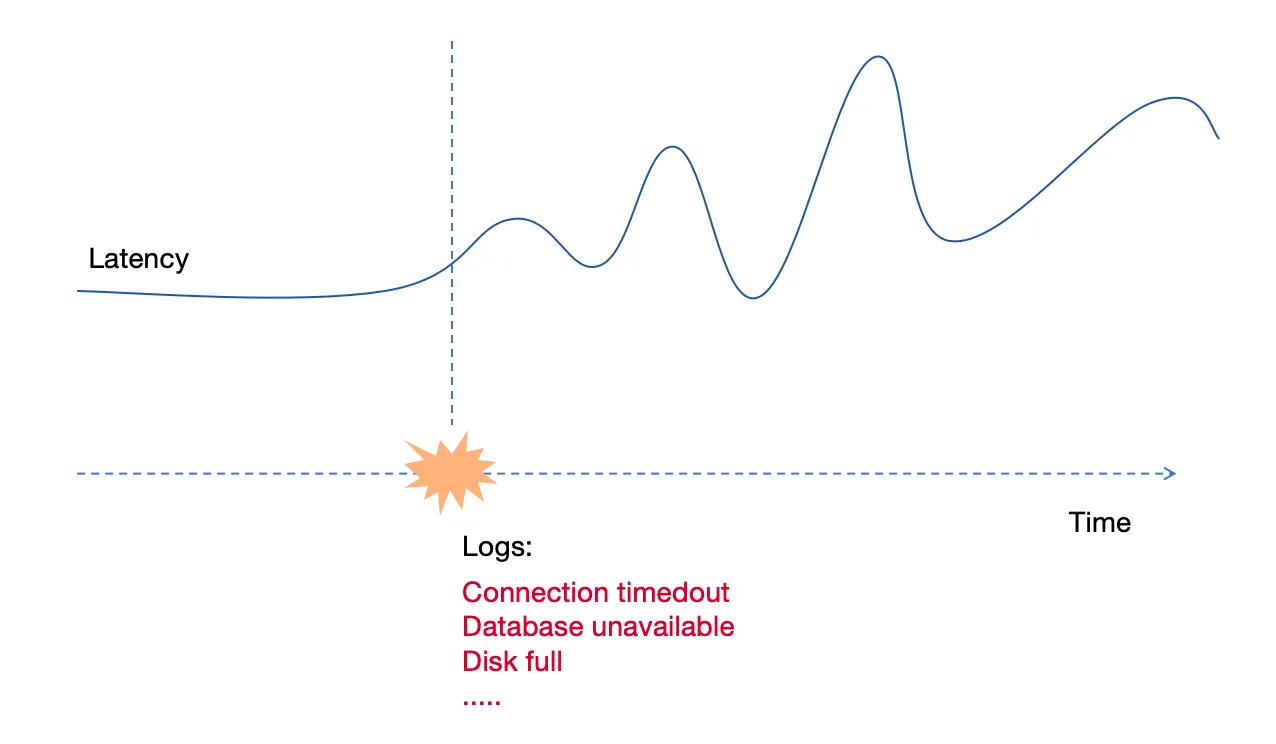
('2024-07-11 20:00:16', 'dc1', 'host1', '/api/v1/resource', 'Error: Network issue');Since 2024-07-11 20:00:10, the latency of RPC requests has become problematic, increasing from about 100ms to 1000ms or more. Additionally, some error logs were collected at that time.
We are using the INSERT statement just for demonstration. In an actual system, you might collect metrics and logs using Prometheus, Vector, or OTEL.
We already have logs and metrics for the application. How can we perform correlation analysis to quickly and easily find the failure timepoint and possible error logs?
Step 4: Perform Correlation Analysis to Find Failure and Error Logs
We already have logs and metrics for the application. How can we perform correlation analysis to quickly and easily find the failure timepoint and possible error logs?
Calculate p95 Latency for Metrics
Let's start with the metrics. We'll calculate the p95 latency of requests using a 5-second time window:
sql
SELECT
  ts,
  host,
  approx_percentile_cont(latency, 0.95) RANGE '5s' AS p95_latency
FROM
  app_metrics
ALIGN '5s' FILL PREV;
We use range queries for it:
sql
+---------------------+-------+-------------+
| ts | host | p95_latency |
+---------------------+-------+-------------+
| 2024-07-11 20:00:00 | host1 | 102 |
| 2024-07-11 20:00:05 | host1 | 104.5 |
| 2024-07-11 20:00:10 | host1 | 4200 |
| 2024-07-11 20:00:15 | host1 | 3500 |
| 2024-07-11 20:00:20 | host1 | 2950 |
| 2024-07-11 20:00:25 | host1 | 2800 |
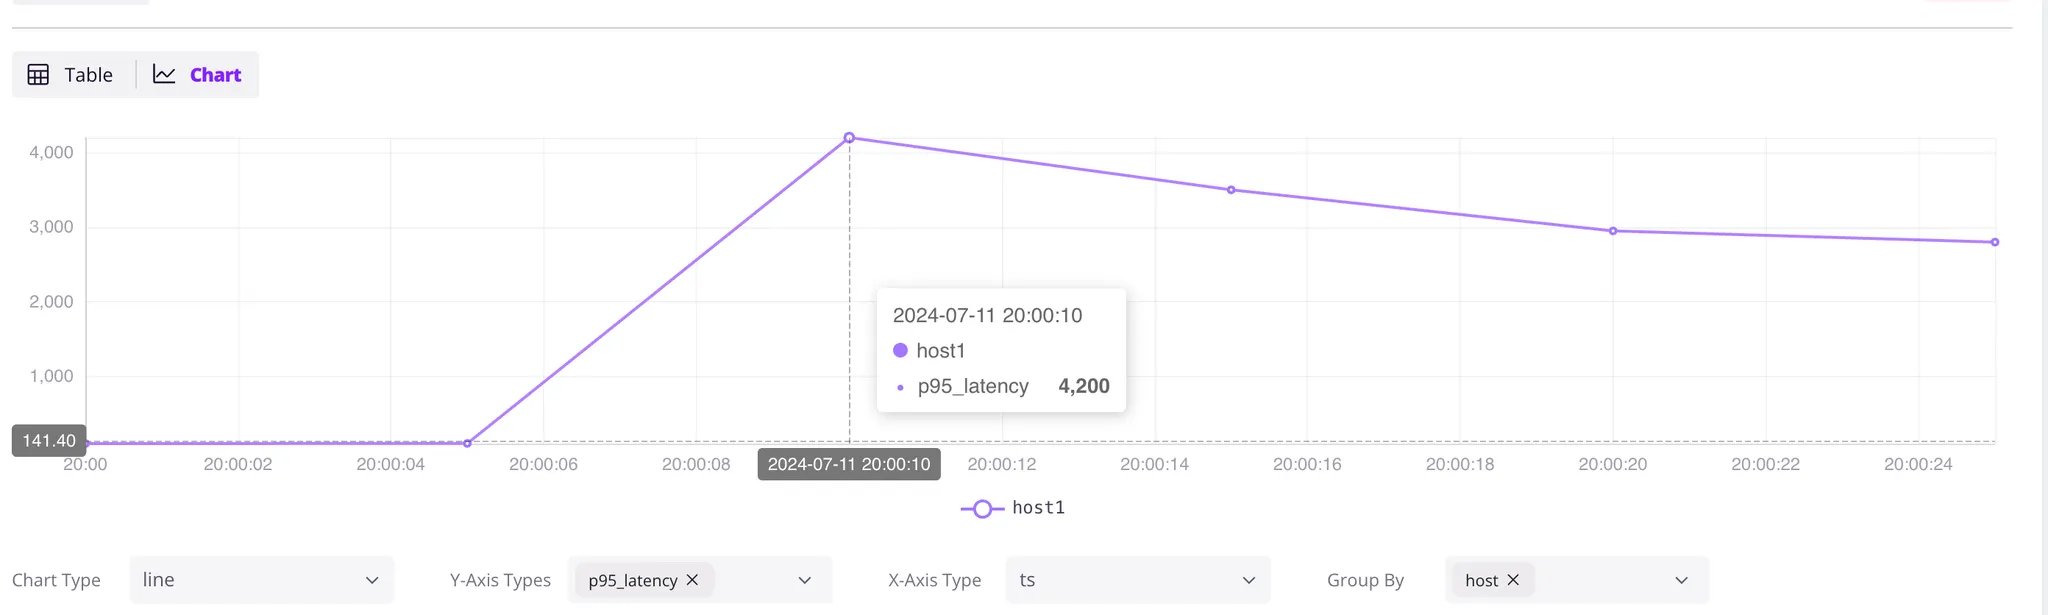
+---------------------+-------+-------------+Latency issues began on 2024-07-11 at 20:00:10. Displaying this data on a dashboard like Grafana would clearly show the trend, allowing for periodic anomaly detection.
Analyzing Log Errors
Next, we should analyze the logs similarly and calculate the total error log count using a 5-second time window.
sql
SELECT
  ts,
  count(error) RANGE '5s' AS num_errors,
  first_value(error) RANGE '5s' AS first_error,
  last_value(error) RANGE '5s' AS last_error,
  host
FROM
  app_logs
WHERE
  matches(path, 'api/v1')
ALIGN '5s';
Because we only care about the API, it has a log search matches(path, 'api/v1') to select the API logs.
Besides the error countnum_errors, we also retrieve the first and last error log of every time window:
sql
+---------------------+------------+---------------------------+----------------------+-------+
| ts                  | num_errors | first_error               | last_error           | host  |
+---------------------+------------+---------------------------+----------------------+-------+
| 2024-07-11 20:00:10 |          5 | Error: Connection timeout | Error: Timeout       | host1 |
| 2024-07-11 20:00:15 |          2 | Error: Disk full          | Error: Network issue | host1 |
+---------------------+------------+---------------------------+----------------------+-------+
Yes, the application was working well until 2024-07-11 20:00:10, when an Error: Connection timeout occurred. Between 2024-07-11 20:00:10 and 2024-07-11 20:00:15, there are 5 error logs.
From an engineer's perspective, we can determine the failure time and the associated logs from the above query.
But if we put it all together, we can get there more easily and quickly.
Combining Metrics and Logs for Correlation
To correlate the metrics and logs in a single query, we use a Common Table Expression (CTE) for both metrics and logs, and perform a LEFT JOIN on them:
sql
WITH
  metrics AS (
    SELECT
      ts,
      host,
      approx_percentile_cont(latency, 0.95) RANGE '5s' AS p95_latency
    FROM
      app_metrics
    ALIGN '5s' FILL PREV
  ),
  logs AS (
    SELECT
      ts,
      host,
      first_value(error) RANGE '5s' AS first_error,
      last_value(error) RANGE '5s' AS last_error,
      count(error) RANGE '5s' AS num_errors,
    FROM
      app_logs
    WHERE
      matches(path, 'api/v1')
    ALIGN '5s'
)
--- Analyze and correlate metrics and logs ---
SELECT
  metrics.ts,
  p95_latency,
  coalesce(num_errors, 0) as num_errors,
  logs.first_error,
  logs.last_error,
  metrics.host
FROM
  metrics
  LEFT JOIN logs ON metrics.host = logs.host
  AND metrics.ts = logs.ts
ORDER BY
  metrics.ts;
It uses the WITH clause (CTE: Common Table Expressions) to reference the two queries above and perform the correlation analysis by LEFT JOIN on metrics and logs, with the same host and ts:
The query results:
sql
+---------------------+-------------+------------+---------------------------+----------------------+-------+
| ts                  | p95_latency | num_errors | first_error               | last_error           | host  |
+---------------------+-------------+------------+---------------------------+----------------------+-------+
| 2024-07-11 20:00:00 |         102 |          0 | NULL                      | NULL                 | host1 |
| 2024-07-11 20:00:05 |       104.5 |          0 | NULL                      | NULL                 | host1 |
| 2024-07-11 20:00:10 |        4200 |          5 | Error: Connection timeout | Error: Timeout       | host1 |
| 2024-07-11 20:00:15 |        3500 |          2 | Error: Disk full          | Error: Network issue | host1 |
| 2024-07-11 20:00:20 |        2950 |          0 | NULL                      | NULL                 | host1 |
| 2024-07-11 20:00:25 |        2800 |          0 | NULL                      | NULL                 | host1 |
+---------------------+-------------+------------+---------------------------+----------------------+-------+
It tells us that the p95 latency increased from over 100 milliseconds to 4200 milliseconds at 2024-07-11 20:00:10. At that time, there were 5 error logs in 5 seconds. The first error log was Error: Connection timeout and last one was Error: Timeout.
With such a correlated query, we quickly pinpointed the time of the failure and suspicious logs using just one SQL query! There is no need to combine different systems, use different query languages, or write a lot of application code to do it.
Including this SQL in a regularly running dashboard will help us identify failures in real-time.
Start your Journey with GreptimeDB for Easier Unified Metric and Log Analysis
Hope you enjoy the journey as you read this. By using GreptimeDB’s powerful SQL features, we can easily correlate logs and metrics in a unified system, quickly pinpoint failures, and reduce the time and complexity of monitoring. This makes it easier to monitor and debug applications in real-time, directly in your dashboard.
About Greptime
Greptime offers industry-leading time series database products and solutions to empower IoT and Observability scenarios, enabling enterprises to uncover valuable insights from their data with less time, complexity, and cost.
GreptimeDB is an open-source, high-performance time-series database offering unified storage and analysis for metrics, logs, and events. Try it out instantly with GreptimeCloud, a fully-managed DBaaS solution—no deployment needed!
The Edge-Cloud Integrated Solution combines multimodal edge databases with cloud-based GreptimeDB to optimize IoT edge scenarios, cutting costs while boosting data performance.
Star us on GitHub or join GreptimeDB Community on Slack to get connected.


